CTKUSDT UPDATE#CTK
UPDATE
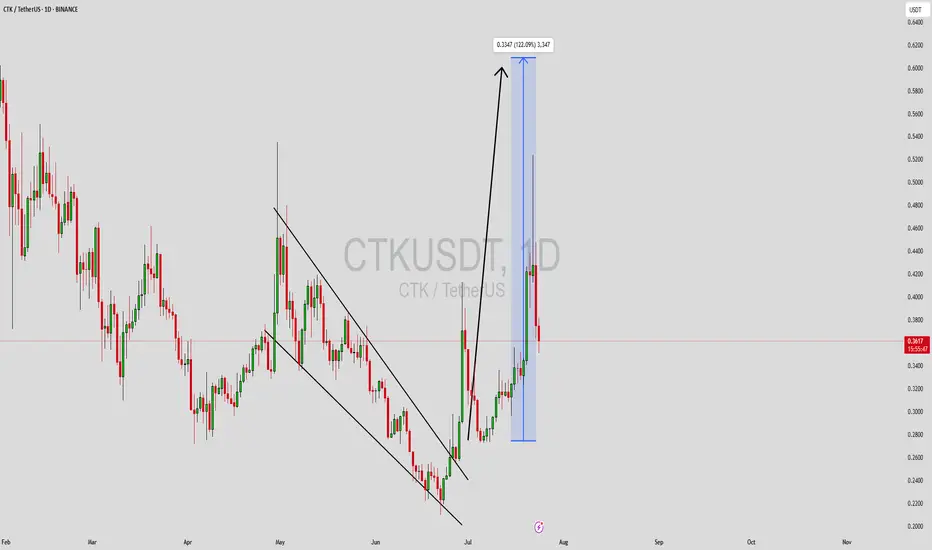
CTK Technical Setup
Pattern : Falling Wedge Breakout
Current Price: $0.3535
Target Price: $0.52
Target % Gain: 47%
Technical Analysis: CTK has broken out of a falling wedge pattern on the 1D chart with bullish confirmation. Price is holding above the breakout trendline, suggesting fu

Shentu (CTK) Breaks Above MA200 · 415% Easy Target MappedLook here. First notice the volume. Immediately you see green bars sticking out. Since we have a low but some mixed action also, this volume signal is the first thing that will tell us that the bulls are in the game. If it isn't showing on the price, it will do eventually.
Then we notice the entire

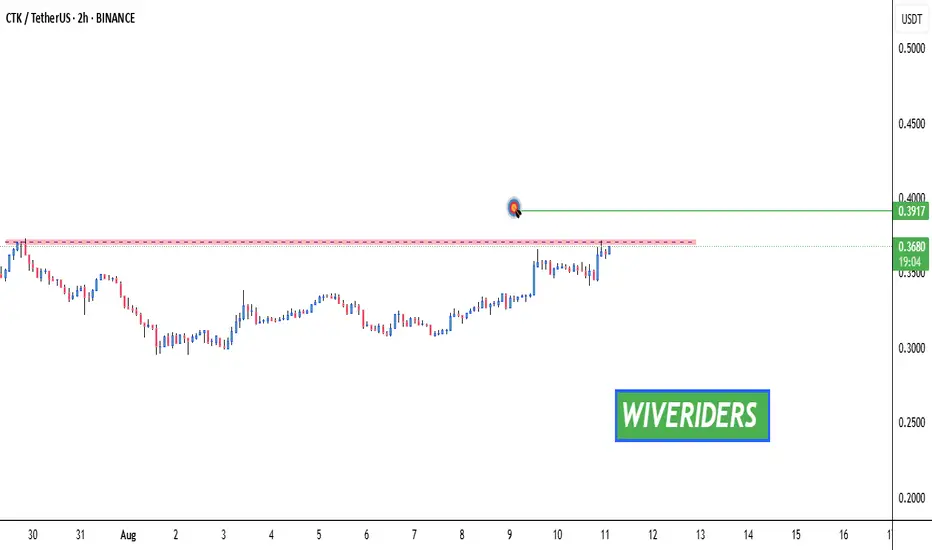
CTK Breakout Watch – Red Resistance Being Tested!🚨 CTK Breakout Watch – Red Resistance Being Tested! 🔴⏳
CTK is testing the red resistance zone.
📊 If breakout confirms, next move could target:
🎯 First Target → Green line level
A breakout could trigger bullish continuation and upside momentum.
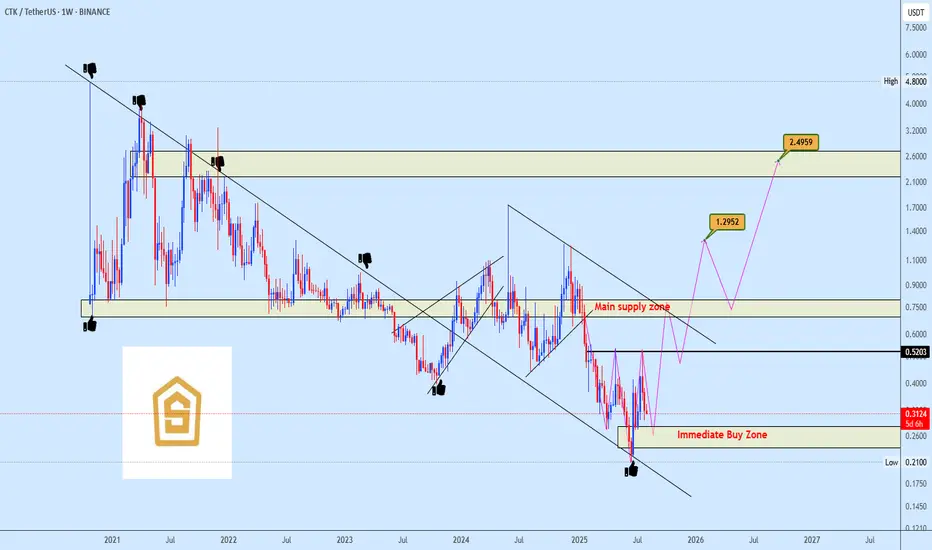
CTKUSDT Trendline Flip Impulsive Wave Build-Up in FocusCTKUSDT has completed a meaningful retest of a long-standing trendline, previously acting as resistance and now confirming its role as structural support. Price is reacting firmly around this key demand zone, signaling potential for a bullish reversal.
The plan is to accumulate within the immediate
CTKUSDT at Critical Retest After Major Trendline Break!CTK/USDT has successfully broken out of a long-term descending trendline that has dominated the price since November 2024, signaling a potential trend reversal from bearish to bullish. The price is now retesting a crucial supply-turned-demand zone in the $0.36 - $0.39 area, which now acts as new sup

CTKUSDT Forming Falling WedgeCTKUSDT is currently trading within a well-defined falling wedge pattern, a classic technical indicator that often signals a bullish breakout. The structure reflects a period of consolidation after a prolonged downtrend, with gradually narrowing price action hinting at a potential reversal. Volume r
Ctk uzun vade trend kırılımı ve direnç üstü hedefler..Who will wake up this long-dormant monster? Trend break? Resistance break? Or both?
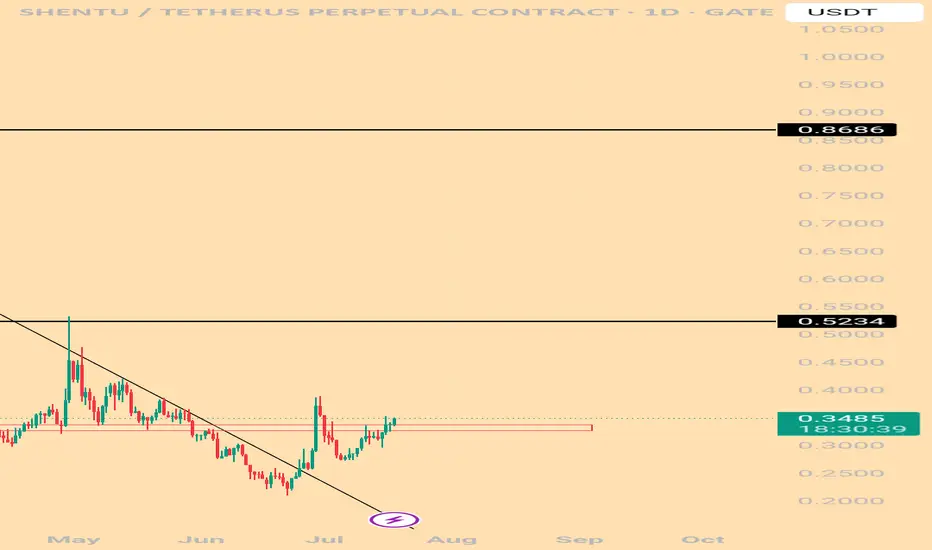
CTKUSDT 1DKeep an eye on #CTK on the daily timeframe.
It’s on the verge of breaking above the descending resistance and the Ichimoku cloud.
In case of a breakout, the targets are:
🎯 $0.4698
🎯 $0.5500
🎯 $0.6302
🎯 $0.7445
⚠️ Always use a tight stop-loss and apply proper risk management.

CTKUSDT Swing Trade Setup – Bottom Confirmed, Uptrend in Progres🔔 CTKUSDT Swing Trade Setup – Bottom Confirmed, Uptrend in Progress
Market Context:
CTK has completed its W-shaped bottoming process, retracing over 80% from the high of $0.98 to the bottom at $0.213. After multiple sessions of accumulation around the $0.213 area, price has gradually recovered to $

CTKUSDT UPDATE
Pattern: Falling Wedge Breakout
Current Price: \$0.2713
Target Price: \$0.61
Target % Gain: 130%
Technical Analysis: CTK has broken out of a long-term falling wedge on the 1D chart with strong bullish candles. The breakout is supported by a noticeable increase in momentum, suggesting potential co

See all ideas
Summarizing what the indicators are suggesting.
Oscillators
Neutral
SellBuy
Strong sellStrong buy
Strong sellSellNeutralBuyStrong buy
Oscillators
Neutral
SellBuy
Strong sellStrong buy
Strong sellSellNeutralBuyStrong buy
Summary
Neutral
SellBuy
Strong sellStrong buy
Strong sellSellNeutralBuyStrong buy
Summary
Neutral
SellBuy
Strong sellStrong buy
Strong sellSellNeutralBuyStrong buy
Summary
Neutral
SellBuy
Strong sellStrong buy
Strong sellSellNeutralBuyStrong buy
Moving Averages
Neutral
SellBuy
Strong sellStrong buy
Strong sellSellNeutralBuyStrong buy
Moving Averages
Neutral
SellBuy
Strong sellStrong buy
Strong sellSellNeutralBuyStrong buy