BULLISH MOMENTUMHELLO TRADER'S THIS IS MY BULLISH TREND ANALYSE . WAIT FOR COME KEY LEVEL AFTER TREND CONTINUE TO UPTREND YOU CAN ENTRY .THIS IS MY OPINION ONLY NO MORE SIGNAL .
Trade ideas

DASHUSD: Time to have another ride here?Chari is "Daily". Pullbacks are possible.
I you work in futures you need to set proportionated stop-losses &/or stop-limits.
Important S&Rs have been depicted.
- Daily price has made a double bottom.
- RSI (14) is showing accumulation & getting more strength.
- Also MFI has a positive divergence at the bottom with price chart - money is coming in.
- PSAR is going to be broken up.
- TP1: 245
- TP2: 337
- TP3: 408
- SL: -5 to 10%
Not a financial advice. Drop a like & follow if you find this analysis useful.

Important RSI Trend ChannelIn this analysis, I show 2 major trend channels on the price action chart, and a key trend channel on the RSI.
On the price action chart, I show how price is capable of moving inside of one channel, or inbetween two trend channels.
Ex) From February 25th to March 20th of this year, price moved in between the top of the red channel and the mid-line of the yellow channel.
Every single time that price has been seen moving in between both a yellow trend channel line and a red trend channel line, price made a decisive move in the direction of the trend motion. It did this once in an upward fashion on February 11th-13th, with all of the other times being bearish.
As you can see in the chart, price fell to the red mid-line and made a bounce to the 50 day moving average depicted in green. I expect that price will get rejected here, but if it doesn't, I expect it to get rejected at the yellow mid-line at max. Assuming this happens, price should make its way down towards the bottom of the yellow trend channel, at minimum, the bottom of the red channel. However, I expect it to reach the bottom of the yellow one, as this is also where the 200 day moving average is lying.
To corroborate these findings, we can take a look at the RSI trend channel. The RSI is also at the crucial mid-line, taking it as resistance. I expect that the RSI will get rejected at this level, and make a decisive move towards the bottom of the trend channel.
I only make decisions based off of the chart, but another thing to take into account, is the market sentiment. Looking on tradingview, I see a lot of people who are bullish/long, and not many bears, I think, a little to prematurely, and purely because of the upwards move towards the 50 day moving average- which will likely just be a fake out.
Please leave a LIKE and SUBSCRIBE if you enjoy this idea and perspective, and as always, do your own due diligence.
Have a great night everybody!

DASH/USDT - potential 42% setupHello, Traders!
DASH is consolidating in the $184 - $212 range before moving further.
Entry into the position can be sought between $204 - $212
Stop-loss can be placed under the lower boundary of the consolidation range - the level of $184
The targets are the following price levels:
$240
$260
$290
Good luck and watch out for the marekt!
P.S. This analysis is created for educational purposes only and shall not be considered financial advice


It seems that time repeats itself again (1500 Dollar)? Coming weeks will show us if that is going to happen

DASH attempting to break out of downward trendIt looks like DASH might be trying to break out of its downward trend slightly. Still a bit of time to see if it continues, but at least it is a start in the upward direction.
Obviously there are still a bit of potential negative effects if BTC heads downward, so it should be interesting if DASH will be able to hold a position against a potentially falling BTC, but I think it is something to watch over the next few days to see if it continues.

DASH: Ready to FlyDash looks ready to go. When it leaves the gate, I wanna go with it. What about you? Here's a nice set-up for those interested in taking a position. I trade all these swings right alongside you; these are my actual positions. My entry point is always the current price before you update the load bars. I am not a financial advisor. Join me at your own risk.
If you have strong hands, patience, and like big wins and big money, follow me. I track all the USD & USDC-paired cryptocurrencies on Coinbase Pro (along with many other coins & tokens) and regularly seek out the most potentially lucrative trades available. All my charts are clean, straightforward, and easy-to-follow. My technical analysis is based upon Wyckoff phase analysis, Elliott wave & Fibonacci extensions. If some of my sell zones seem conservative, it's only because I believe in exiting while still holding the fat money bags. The more intrepid traders can let the winners run a bit longer. Good luck and safe trading to all!
My wins so far for March 2021:
1. Filecoin: 31.92% in 14 days
2. Kyber Network: 12.09% in 7 days
3. Loom Network: 66% in 10 days
4. Ravencoin: 78.55% in 11 days
5. NMR: 19% in 2 days
6. Elastos: 178% in 15 days
7. Qtum: 66.84% in 24 days
8. Filecoin: 24% in 5 days

DASH on Daily. Retracements and targets.Blue trend lines, fib retracement and fib targets set on daily. 30 min purple trend lines added. Support and resistance lines set on weekly, daily, 4 hour. I see 3 different potential outcomes. If dips any further, more than likely to find support in the 0.618.
Buy in alert added.

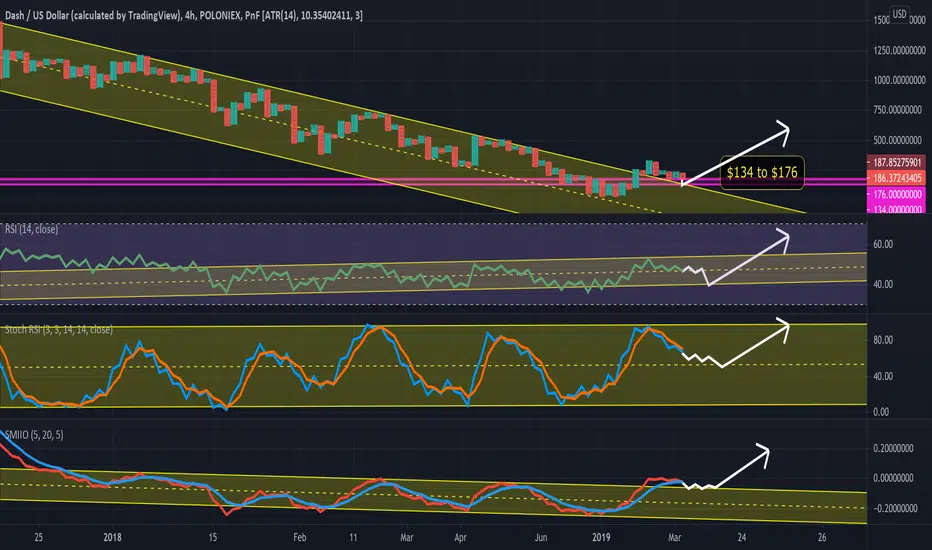
DASH to $134-$176 before LongThis is a 4hr Point and Figure Chart for DASH/USD.
In the same time that the RSI will go the bottom of its trend channel, the Stochastic RSI will bottom in the middle line of the trend channel, with the SMIIO confirming support on the top of its trend channel, as this is the 2nd time it has ever gone above this channel (the first was when it made its massive bull run in 2017).
My area of support can range anywhere from around $134 to $176.
I included $134, as it touched down once, but this was an anomaly. Price may very well end up at around $134, but this is not where I will place my buy order as it is just too much risk versus reward. There is a plentiful amount of support at the $144.95 level, and I think this is a reasonable place to place a buy order, although a little bit above to ensure my buy order gets fulfilled.
This region also happens to be where the top level of the price channel is, and has been for the entire bear market. The rally in February of this year was the first time that price has gone above this INTENSELY strong resistance level since December of 2017. It makes sense that price is correcting and will confirm support on this level.
Something to keep in mind is that the 100 day moving average is at $161 right now, which is still a good area in terms of the overall big picture. The 200 day moving average is currently at $119.
NOTE: The UP arrow in my chart is not signifying a certain price or indicator level it will reach, this was just showing that it will go up after it contacts these support levels.
Feel free to check out my previous analysis of DASH/USDT from March 17th, when everyone was expecting a bullish run-up:
Follow and Hit like for more DASH charts
Simple Trend ChannelIn this chart, I show a clear and concise trend channel that DASH/USD has been in, and what its next footsteps will likely be.

DASH - descending triangleDash is currently in descending triangle pattern which means the price can go both up and down, the price must stay at 200$.
DASH/BTC also needs to breakout and after that the price of Dash won't be affected by Bitcoin dumps so hard.
Will update this idea when the breakout happens.
Still it's just a pattern and it could go sideways, let's wait and see where the price is heading.


DASH Accumulating for explosive runHello everyone,
Currently dash is in a lateral accumulation phase.
As we could see in the previous run, the explosiveness of this altcoin is massive.
Be aware of key points:
250$
Breaking RSI downtrend
500$ Long term objective, timing is not bad but you could get bored watching other altcoins growing.
Good Luck!

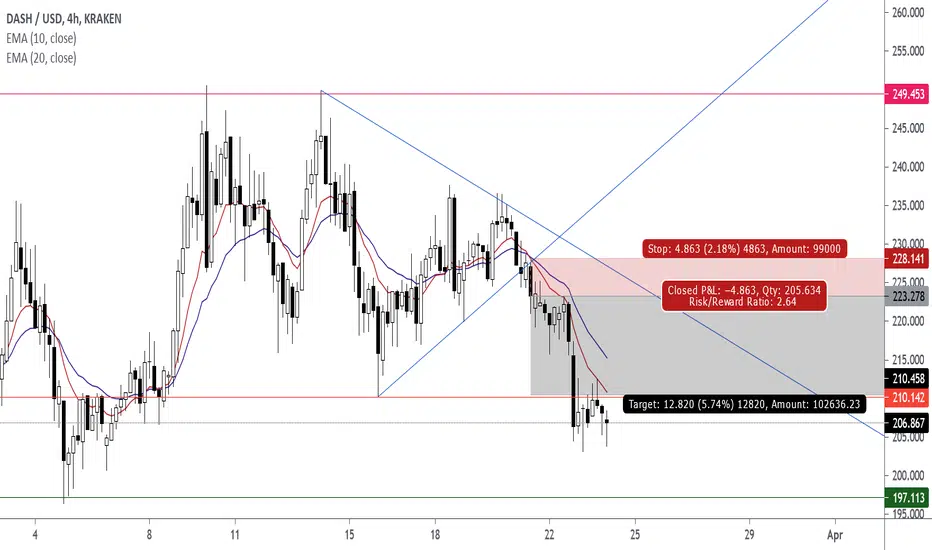


DASH is about to hit crucial supportDASH just broke out of what could be considered a bear flag which could mean it is about to head downward.
What makes matters worse for DASH is it is about to hit the bottom of a long term wedge (green lines) right around the 50% Fibonacci level near $212. Although this is a great opportunity for a bounce, with the bear flag just breaking, it must also be considered that if support breaks, it can easily hurl into a whirlwind downward over the next month.
Hence there is some crucial support to watch soon around $212 for DASH.


Huge Dash Move IncomingChart Speaks for itself. Also ALtcoin market cap is about to have huge upwards breakout.
not financial advise.

