Trade ideas

DASH/USDhi. hope my ideas can help you guys
here is DASH US DOLLAR, the SHORT senario is ON
the price is going to pull back to 44.55, kiss it and go to the main target at 34.769

About DASHUSDhi everybody.this what i think about DASHUSD with two senarios of increase and decrease

DASHUSD (4H) Bullish reversalHi Traders
DASHUSD (4H Timeframe)
Waiting for the upward break of 46.35 resistance level, which will complete a bullish trend reversal pattern to go LONG. Only the downward break of 38.50 would cancel the bullish scenario.
Trade details
Entry: 46.35
Stop loss: 38.50
Take profit 1: 51.18
Take profit 2: 59.00
Score: 4
Strategy: Bullish reversal

DASHUSD (4H) Bearish Wave We2Hi Traders
DASHUSD (4H Timeframe)
A Medium-high probability, entry signal to go SHORT will be given with the downward break of 41.350after the market found resistance at 46.30. Only the upward break of 46.30 would cancel the bearish scenario.
Trade details
Entry: 41.35
Stop loss: 46.30
Take profit 1: 33.40
Take profit 2: 28.15
Score: 7
Strategy: Bearish Wave We2

Dash Working on Dash... Should be great opportunity to buy very soon.
It looks like DASH from 20$ to 5k

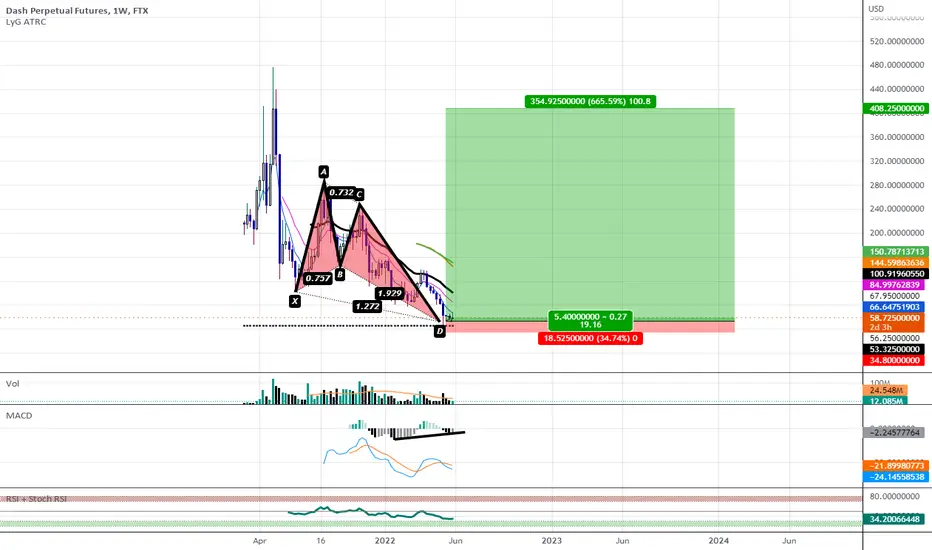
Bullish Butterfly with Bullish Divergence on WeeklyWe Have Weekly MACD Bullish Divergence Visible at the PCZ of a Bullish Butterfly on DASH
DASH, breaking range resistance.The following content is machine translation:
In the 4-hour chart, this rebound fluctuated in the 54-64 support and resistance range. There are signs of breaking through the range resistance today, which is bullish.
The fast and slow line of the indicator macd runs above the zero axis, and it is dominated by more. The current energy column is weak, which may bring a small step back. The RSI indicator is currently weak on the edge of overbought, and may fall back slightly to adjust, and the general direction is bullish.
In operation, the market breaks through the resistance of the range and is bullish. The indicator is weak in the uptrend and lacks kinetic energy. It may slightly step back and adjust, and then continue to uptrend and be bullish. Step back to stabilize and do more, the upper target is near $78.

as expected
dash broke through the descending channel and then stepped back to rise
At present, the short-term bulls still have the advantage
We recommended it a few days ago
you can keep holding it
Follow me to take you to achieve financial freedom

Production cuts are good
Dash has the benefit of cutting production next month
At present, there are also breakthrough technical patterns in the short-term
In the short term, it is expected to rise for a while
You can hold your dash or buy some on dips
Follow me to take you to achieve financial freedom

Ready to the moon DASHUSD Everyone been waiting for this post and the Fib is off the charts so that means we are in the bottom and a good buy opportunity. Deep up your pockets and hold.. once 500 area breaks then we are in a breakout bullish max out. If the recent yearly high breaks then we are to the moon. Buy and hold its still at the 57 area still.

DASH bottomed? 5 years from now people will remember this time... best buying opportunity in crypto!!

DASH INCREDIBLE BUYING OPPORTUNITY - Accumulation Zone!!DASH INCREDIBLE BUYING OPPORTUNITY - Accumulation Zone!!


DASH Fractal / Chart PatternSxS comparison from the 2018 bull run.
DASH is about to make a dash w/the bulls!

DASH to cut production in June
dash has the benefit of production cuts in June
The trend is also very good, breaking through the local downtrend
I expect that dash will be dominated by shocks in the short term
Follow me to take you to achieve financial freedom

Dash looks good from here 👍Dash could break out after this long descending triangle, 90 dollar area is sinds 2017 a support line.
Hopefully we'll see some decent uptrend next few monts to come.

BULLISH RUN IS GOING If you miss the buy , buy it now and also in Coinbase too.
The green is screaming for the bulls and played the support very well and thanks to the meta share had been going on.
Bullish trend and big push up; watch any reversal happens.
Time to go to the moon

Dash 2 week outlookHello Traders,
Here is a long term chart on DASH, same deal for the colors. Pink we want to stay above, if not, green lines are the points of interest for buying opportunities. Red rays are resistance and white lines are targets when the light blue trend lines are broken.
If you look at the previous run, this all looks very similar to the present run but on a larger scale.
Please leave a comment with your opinion and requests for additional charts.
Savvy

DASHUSD (1H) Bearish Wave We2Hi Traders
DASHUSD (1H Timeframe)
A high probability, entry signal to go SHORT will be given with the downward break of 93.50 after the market found resistance at 96.35. Only the upward break of 96.35 would cancel the bearish scenario.
Trade details
Entry: 93.50
Stop loss: 96.35
Take profit 1: 88.80
Take profit 2: 84.10
Score: 8
Strategy: Bearish Wave We2

TRIPLE bottom dashusdeasy 200% for dashusd
go check there website and learn more about dash
sl bellow the bottom

DASH/USD Main trend. Price reversal zone.This chart shows the main trend of this cryptocurrency. Term 1 week. The idea is to understand where the price is on a global scale and what to expect. It is advisable to trade on a lower timeframe, but a large timeframe gives you an idea of what to expect in the future.
Pay attention to what formations have formed on the chart and how they can "flow" into each other, depending on how the situation develops in the reversal zones. Now the price is in the reversal zone below the line of the secondary downtrend. Which trend will dominate in the near future depends on this zone.
If a breakout occurs and the price consolidates above the resistance of the secondary trend (the resistance of the triangle) - a complete reversal and the emergence of a new upward secondary trend. If the price fails to break through and gain a foothold above this zone, it may roll back inside the triangle to support - the next reversal zone, and this is the level of 62.22. Next, you need to see how this support will react.
