TradeCityPro | DASHUSDT Potential Continuation of the Uptrend!
👋 Welcome to TradeCityPro!
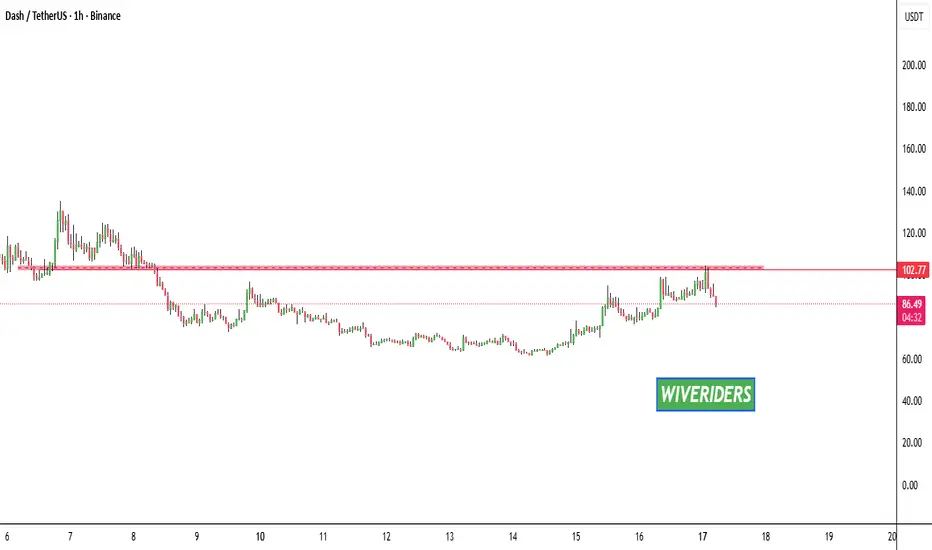
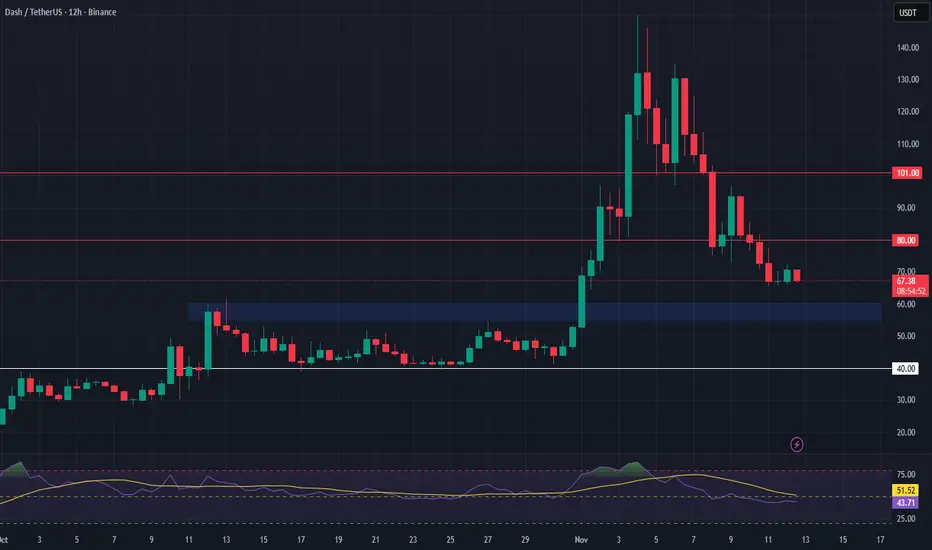
Let’s take a look at the DASH chart — one of the well-known privacy coins in the crypto market. Ever since XMR started its bullish trend, DASH has also shown strong upward movement.
🌐 Overview of Bitcoin
Before starting the analysis, let me remind you once again that we’ve moved the Bitcoin analysis section to a dedicated daily report at your request — allowing us to discuss Bitcoin’s trend, dominance, and overall market sentiment in greater detail each day.
In the 4-hour timeframe, after bouncing from the 28.84 support, price experienced a sharp upward move and then formed a new consolidation box.
After forming a higher low inside the box, the breakout of 51.84 triggered a strong bullish rally, pushing the price all the way to the 135.32 resistance, where it faced rejection.
From that resistance, price began a corrective move and retraced down to the 0.618 Fibonacci level, where it found support again.
At the moment, for a long position, we can consider entering after the breakout of 98.66, especially since the previous trend structure still favors bullish continuation.
For a short position, there isn’t much room to operate right now. The overall trend is still bullish, and a true trend reversal would only become valid if the price breaks below 62.48.
📝 Final Thoughts
Stay calm, trade wisely, and let's capture the market's best opportunities!
This analysis reflects our opinions and is not financial advice.
Trade ideas

Update: DASHUSDT – Wave (2) Completed, Wave (3) Expansion Ahead📊 #DASHUSDT – 4h Update
I’m getting even more confident about Dash’s structure right now.
With Wave (2) confirmed and the retracement completed perfectly inside the Fibonacci zone, the market looks ready to initiate Elliott Wave (3) — the strongest impulsive wave in the sequence.
If this plays out, the mid-term upside potential sits around +120% to +140%, with the primary target range positioned between $168 – $180, and an extended move possibly reaching $230+ as Wave (5) completes.
⚠️ Invalidation remains the same:
If DASH breaks below $70, this entire wave structure would be invalidated.
🟢 For now, I’m closely watching the local support area for early bullish confirmation before Wave (3) acceleration begins.
#Crypto #ElliottWave #Fibonacci #DASH #Altcoins #TA #PatternIQ

DASH?
Hi,
As per chart.
Resist 92-95
It broke till 100
Now retrace to 87-88
My pointer. If break 95 again. Gonna test recent 100
Then will test 132 resist \ 148 resist
All the best
Keep watching if idea viable.
Not a guru

DASH Update🚨📊 DASH Update
DASH tried to break out above the red resistance zone 🔴 around $102,
but the move failed and price got rejected.
This level is still acting as a strong barrier,
and buyers must reclaim it for the next bullish leg.
DASH USDT SHORT SIGNAL---
📢 Trade Idea: DASH/USDT
Type: Short
Entry: 88.36
🎯 Take-Profit Targets (Partial Exits):
• TP1 = 85.47
• TP2 = 81.00
• TP3 = 76.95
• TP4 = 71.66
• TP5 = 66.12
🛑 Stop-Loss: 93.56
⏱ Timeframe: 15m
⚖️ Risk/Reward Ratio: 4.84
💥 Suggested Leverage: 5×–10×
---
🧠 Technical Analysis Summary:
DASH is currently rejecting from a key resistance area near 88.3–89.0, showing strong bearish momentum.
Price has formed a lower high and broken below its short-term support zone, signaling continuation downside potential.
Momentum indicators such as RSI show bearish divergence and are trending downward, confirming weakening buyer strength.
If price stays below 88.50, market structure favors a deeper correction toward 81.00 and potentially lower support levels.
---
⚙️ Trade Management Tips:
• Secure partial profit at TP1 and move stop-loss to breakeven.
• Use a trailing stop if momentum accelerates toward TP3–TP5.
• Avoid entering if the price closes above 89.00 on the 15m chart.
---
⚠️ Disclaimer:
This analysis is for educational purposes only and is not financial advice.
Always conduct your own research and manage your capital responsibly.
---
📌 Hashtags for TradingView:
#DASHUSDT #CryptoSignal #TradingViewIdeas #CryptoAnalysis
#Altcoins #FuturesTrading #ShortTrade #TechnicalAnalysis
DASHUSDT - Another Leg up ahead!DASH has gained over 300% in the past few weeks and is now in a healthy correction. It formed a consolidation and a falling wedge pattern, which it broke and successfully retested.
It’s starting to climb again.
A golden cross has formed, which should give it the momentum to break the 0.618 Fibonacci resistance, potentially pushing it past the $180 level
Best Regards:
Ceciliones🎯

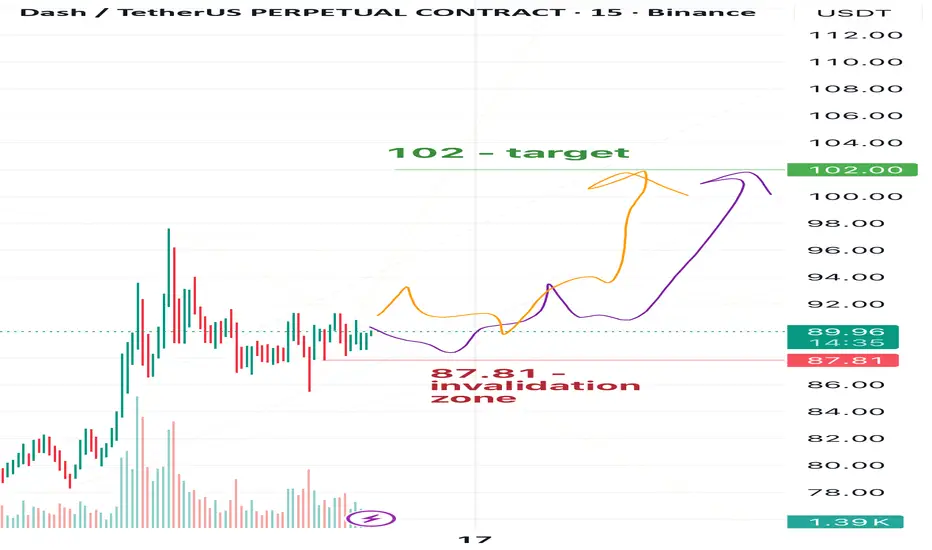
DASH: Building Momentum Toward 102📈In my view, Dash is currently forming an impulse. From the current levels, I’m expecting a move toward 102.
The invalidation level for this plan is 87.81.
🎯Target - 102
❌ Plan invalidation zone - 87.81
⚠️Disclaimer: This is not financial advice or a call to action — just my personal market view. Always make decisions based on your own risk management, and make sure to trade with stop-losses.
💬If you find this analysis helpful, feel free to leave a reaction, drop a comment, and follow so you don’t miss future updates and new Dash publications🚀
$DASH/USDT has now pumped more than 30% after breaking $DASH/USDT has now pumped more than 30% after breaking out of the falling wedge and holding above the 50 EMA with strong volume.
If it stays above the 74–76 zone, the uptrend can continue, with the next targets around 100–120. 🚀
Just watch pullbacks; as long as price respects the breakout trendline, buyers remain in control.

DASH/USDT - Ready for a New Rally? Strong Trendline Break?DASH is entering a highly critical phase. After a deep corrective move, the price has finally broken above the main downtrend line, which has been suppressing every bullish attempt for several sessions. This breakout is not just a casual push — it occurred exactly after the market retested the strong demand zone at $83–$75, an area that has repeatedly acted as an accumulation block for larger players.
The market structure paints a clear story:
Impulsive rally toward $150 → distribution → controlled retracement.
A series of lower highs → well-defined downtrend → bearish pressure gradually fading.
Strong 4H breakout above the trendline → early trend reversal signal.
DASH now stands at an inflection point. Buyers successfully defended the demand zone, and the next move will determine whether this breakout evolves into a full bullish reversal or simply a temporary relief rally.
---
Bullish Scenario (Rising Momentum + Structural Shift)
If the buyers maintain this momentum, the bullish setup becomes very compelling:
1. Successful retest/hold above the broken trendline → validation of the reversal.
2. Clean 4H breakout above $96.9 → opens the next range.
3. Upside targets become:
Target 1: $105
Target 2: $134 (major supply zone)
Primary Target: $149–150 (previous swing high)
A confirmed breakout above $134 would signal the start of a larger markup phase.
---
Bearish Scenario (If the Breakout Turns Into a Fakeout)
The bearish scenario activates only if price breaks back below the $83–$75 demand zone.
A 4H close beneath this region would:
Invalidate the bullish breakout
Shift structure back into bearish continuation
Confirm downside targets toward:
$68
$60
And in an extended selloff, a revisit to the $40 region.
This $83–$75 zone remains the final defensive line for buyers. As long as it holds, bullish bias stays intact.
---
Key Pattern Breakdown
Downtrend Breakout → transition from distribution to accumulation.
Demand Zone Rejection ($83–$75) → shows strong buy-side interest and potential structural reversal.
Potential Higher Low Formation → early stages of bullish trend development.
Continuation Potential if $96.9 is broken with strength.
These elements suggest that DASH may be preparing for the early phase of an uptrend — pending confirmation.
---
Technical Insight
Bulls have successfully defended structural support above the demand zone.
Momentum shift appears after the trendline break.
A confirmed 4H close above $96.9 will likely activate the next leg upward.
Any pullback into the $83–$75 zone remains a high-value accumulation area (as long as the zone holds).
#DASH #DASHUSDT #CryptoAnalysis #Breakout #Reversal #DemandZone #PriceAction #CryptoMarkets #TechnicalAnalysis

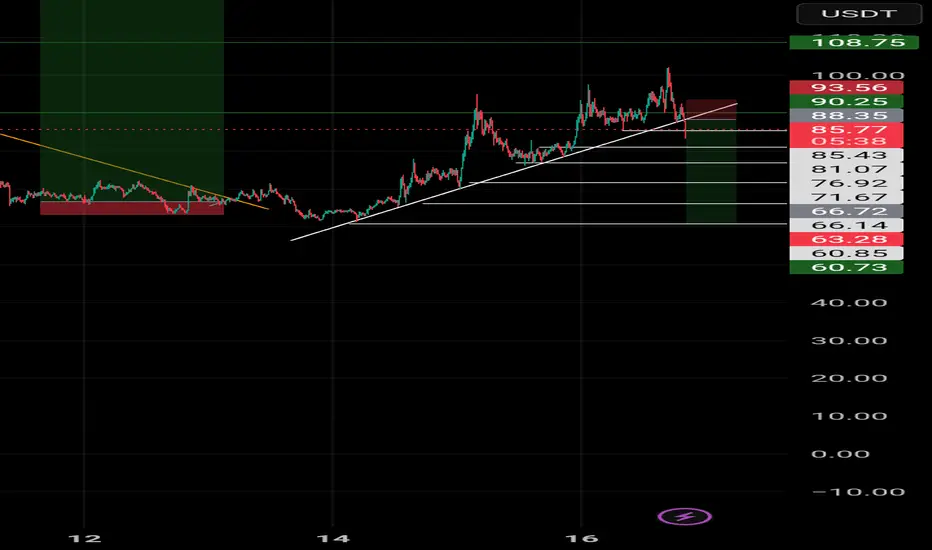
DASHUSDT.P - November 15, 2025Price has been climbing in a steady uptrend, supported by a rising trendline, and is now stalling inside a key resistance zone where sellers have previously been active. A clean break above this area could open the move toward the 88–90 level, while rejection here may trigger a pullback toward the 72–70 support zone where buyers last defended.

DASH Update🚨📊 DASH Update
DASH is testing the red resistance zone 🔴.
Until we see a clear breakout, price remains under pressure
and the resistance continues to block the upside.
$DASH/USDT has broken out of the falling wedge! $DASH/USDT has broken out of the falling wedge with strong volume a clean breakout.
If DASH stays above the 74–76 zone, it can keep moving up.
If the momentum continues, the next targets are 100–120. 🚀
Just watch pullbacks as long as price stays above the breakout trendline, the uptrend can continue.

DASH - BEARISH NASDAQ:DASH - bearish outlook 📉
Fallowing my yesterday's view: TP1 already ✅
58 - 57$ 🎯
52 - 50$ 🎯
44 - 45$ 🎯
#DASH #trading

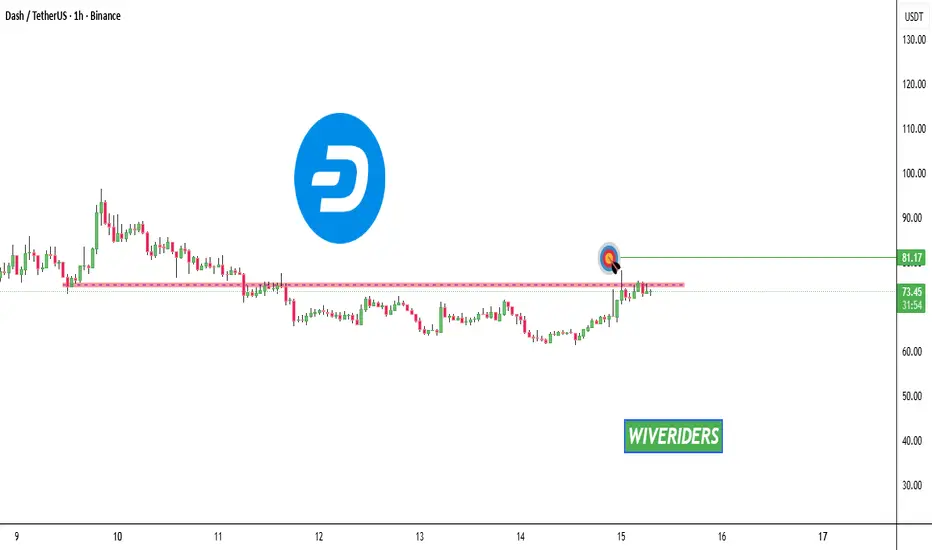
Dash Awakens — Correction TakenIn my view, Dash has completed its corrective phase.
Now I see the first technical signs of possible recovery and growth.
🎯My targets are 71.4 and 76.0
❌Plan would be invalidated at 65.68.
⚠️ This post is for analysis purposes only, not a trade signal.
Always control your risk and place stop-losses.
If you agree (or disagree!) — share your thoughts in the comments,
and don’t forget to follow for my next updates! 💬📊

DASH – Watching for a Higher Timeframe ReversalWe’re looking for DASH to pull back and test the next major support zone before potentially reversing its trend back to the upside. This setup provides an opportunity to position early for a long spot trade once confirmation appears.
Trade Setup:
• Entry Zone: $55 – $60
• Take Profit Targets:
🥇 $80
🥈 $101
• Stop Loss: $40
Potential Bearish Price movement in the short termPotential Bearish Price movement in the short term - followed by a nice buying opportunity
high risk asset

Dash Setup — One More Push, Then UpIn my view, the correction in Dash is coming to an end. I expect one little final move down before we see a potential shift to the upside.
As usual, I see two possible scenarios — along the purple or the orange path. In both cases, I’m expecting a slight drop first before the trend turns upward.
💹 Target: 88
❌Invalidation zone: 72.78
⚠️ Disclaimer: This is not a trading signal, just my personal market outlook. Always trade with stop-losses and manage your risk!
💬 Feel free to react, comment, and follow if you’d like to see regular updates!

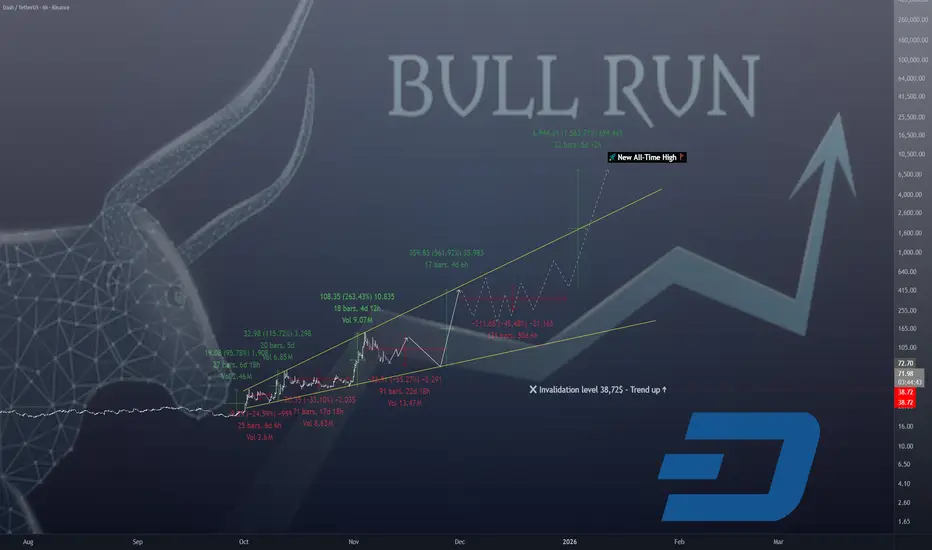
DASH - YOU CAN'T FIGHT PHYSICS! CORRECTIONS ARE INEVITABLE!📣 Hello everyone!
1. DASH currently has an ideal bull market structure.
Microphases of growth are impulsive and lightning-fast: In September, in 6 days +95%, in October in 5 days + 115%, in November in 5 days +263%
The correction microphases grow proportionally over time, which is the absolute norm: 6 days, 17 days, and the current correlation can probably stretch to 21-28 days!
2. If the bull market structure is maintained until the end of 2025, the DASH price may test the 2021 maximum in the region of $476!!
_________________________________________
Total: while the minimum of the last consolidation of $ 38.72 has not been violated, I believe that we should remain cautiously optimistic about DASH and give the bulls time to prove themselves once again. I believe that this time we are dealing with a breakdown of the 8-year bearish trend and now is the earliest phase of the long-term bull market in this coin.
That's all for today, I wish you good luck in making independent trading decisions and profit. Please analyze the information you receive from me, always think only with your head!
Goodbye! ✊
DASHUSDT – 4h (Wave 3 Possible? )📊 #DASHUSDT – 4h
I’ve seriously started to like Dash lately.
Based on Fibonacci retracements and my 15-minute chart analysis, the market seems ready to start forming Elliott Wave (3) — potentially delivering around +130% in the mid-term.
Target zone lies between $180 – $200.
⚠️ This setup becomes invalid if the price drops below $70 again.
🟢 Currently watching for early confirmation signs around the local support zone.
#Crypto #ElliottWave #Fibonacci #DASH #Altcoins #TA #PatternIQ

#Dash Ready for a Massive 426% Breakout? The weekly chart of #DASHUSDT is showcasing a massive descending wedge pattern, a formation often signaling a major reversal. Currently priced at $25.50, DASH has the potential to skyrocket to $107.35, marking a staggering 426.78% gain. This setup hints at a significant bullish momentum building up—could this be the breakout that Dash traders have been waiting for?
⚠️ All trading ideas are published with a time delay. If you want to follow the trading in real-time, please follow the link:

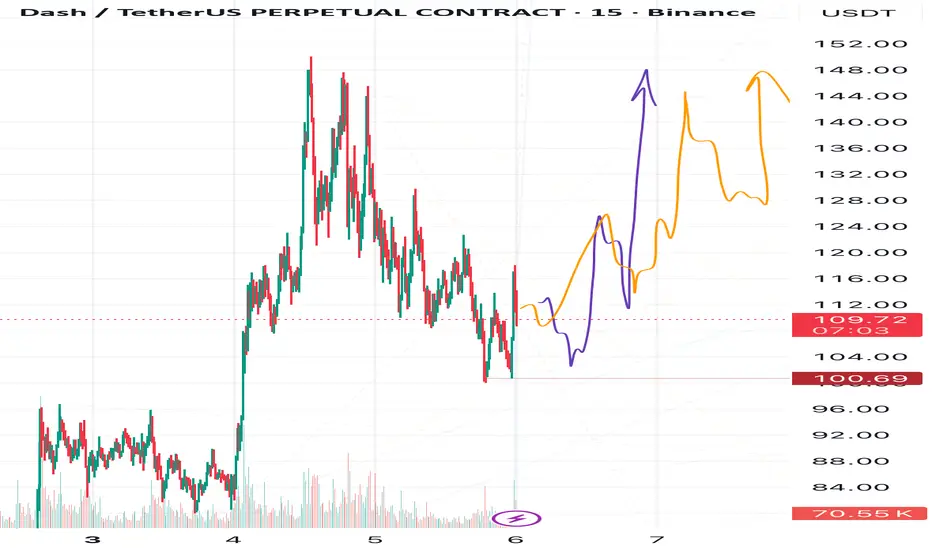
Dash in a Slow and Steady ClashIn my view, DASH is slowly gaining strength before reaching for new highs.
And it will definitely need that strength — the $150 level won’t be easy to break.
For now, I’m not setting that as a target, since the coin might move sideways between $110–146 before it’s ready to cross $150.
I currently see two possible scenarios, shown by the orange and purple arrows on the chart.
🎯 Target 1: $128
🎯 Target 2: $146
❌ Invalidation: $100.69
After some accumulation near $150, DASH might fly to $180, and later to $210 — but since I’m a bit pessimistic about Bitcoin right now, I prefer to stay cautious and not set those ambitious targets yet.
⚠️ Disclaimer:
This is not financial advice — just my personal market view for educational purposes only.
💬 Follow me so you don’t miss the next updates on DASH and other coins!
Dash/USDT Analysis – November 5, 2025This projection is based on VWAP and the Z-Score of VWAPs, which are the tools that give my analysis its precision and edge. 📊
The main analysis was performed on the 1-month candle chart, allowing me to capture the broader market context and identify key levels for potential growth.
What makes this approach unique is the combination of multi-timeframe VWAPs and Z-Score, enabling me to spot high-probability moves and better understand market structure compared to standard methods.
The chart indicates a potential rebound from current support, aiming for a target around $218.24, representing a +126% upside from recent lows.

DASHUSDT Forming Bullish WaveDASHUSDT is currently showing a strong bullish wave pattern, signaling renewed momentum and strength from the buyers. This pattern often appears during early stages of a potential trend reversal, indicating that the coin could be gearing up for a powerful rally. The structure suggests that DASH is building a higher low formation, a key sign of accumulation by investors preparing for the next upward breakout. If momentum continues, the projected gain of 70% to 80% looks achievable as bullish pressure intensifies.
Volume remains healthy, supporting the overall bullish narrative. Sustained trading volume often confirms investor confidence and validates the price movement, making the ongoing uptrend more reliable. A rise in volume during breakout points would be a strong indicator that the coin is set for a significant price expansion.
Investor sentiment toward DASHUSDT has been improving, as more traders view it as an undervalued asset with solid recovery potential. The combination of a clear bullish structure, strong technical signals, and consistent market activity positions DASH as a promising short-to-mid-term opportunity. If the bullish momentum continues, this pair could become one of the top-performing assets in the coming sessions.
✅ Show your support by hitting the like button and
✅ Leaving a comment below! (What is You opinion about this Coin)
Your feedback and engagement keep me inspired to share more insightful market analysis with you!
