DASHUSDT.P - November 4, 2025DASHUSDT.P is exhibiting a strong corrective rebound within a prolonged downtrend, with price approaching the $207.29–$407.47 zone marked for short entries. The setup anticipates a potential rejection from this resistance area, targeting $48.40 for partial profit and $21.22 as the final objective. The stop loss is positioned above $603.93, defining the invalidation level. A sustained move below $48.40 would confirm renewed bearish momentum, while a breakout above $603.93 would negate the short setup.
Risk Assessment: High risk — the trade relies on rejection from major resistance after an aggressive upside move, but the wide stop zone provides flexibility against volatility.
Trade ideas

Dash is Back — Ready to Attack!Hey friends! 👋 How are you feeling after today’s drop?
Let’s talk about Dash.
In my opinion, Dash is finally ready to move toward my long-awaited targets at 100 and then 120.
My previous forecast didn’t play out as expected, since Dash entered the invalidation zone I mentioned earlier.
This time, the invalidation zone is at 83.70.
I currently have two possible scenarios for Dash — all shown on the chart with arrows of different colors. Each color represents a slightly different path the price could take before the next major move.
Let’s see which scenario the market chooses this time! 🚀
Disclaimer:
This is not a trading signal or financial advice.
Always make your own decisions based on your risk management, and never trade without stop-losses.

DASHUSDTI think if the uptrend continues and BINANCE:DASHUSDT can break out above $50, it could gain bullish momentum toward $65.
⚠️Please control your risk.

Dash in Motion — Riding the Bullish Ocean Dash looks ready to push higher.
I’m still targeting 100, and then 120 next.
The invalidation zone is marked at 87,99
Momentum looks strong — let’s see if the bulls keep control.
🚀 Drop a reaction if you’re tracking DASH too,
and follow me for my next update with a new entry setup

DASHUSDT UPDATE #DASH
UPDATE
SOPH Technical Setup
Pattern: Bullish Falling Wedge Pattern
Current Price: $88.10
Target Price: $96.00
Target % Gain: 8.97%
NASDAQ:DASH has broken out of a bullish falling wedge pattern on the 4H timeframe. The move has already confirmed strong bullish momentum, producing an impressive upside continuation following the breakout. The structure supports further short-term bullishness toward the $96 region.
Time Frame: 4H
Risk Management Tip: Always use proper risk management and consider trailing stops to secure profits after a strong breakout.

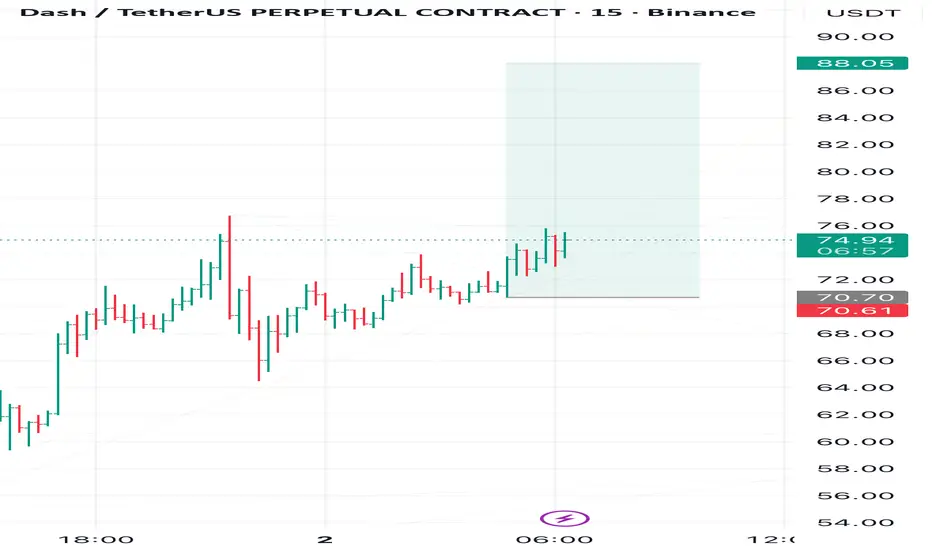
DASH on Fire – Aiming Higher!I’m expecting the Dash rally to keep going — the chart still looks full of energy.
My next target is 88, and maybe even higher 📈
🚀Globally, I’m watching 100 and 120 as long-term goals, but for now, 88 is my main focus.
❌The invalidation zone is marked in red on the chart at 70.61.
I’m personally expecting the momentum to stay strong — let’s see what the chart will show us next.
This is not financial advice; everyone should manage their own risks.
Privacy Coins narrative may be exhaustedAs soon as beta coins outperform the leader, it often indicates that we are close to the top
📊Last 3 days price change:
#ZEC +30%
#ZEN +86%
#DASH +120%
Keep an eye on privacy coins. This narrative may be exhausted.

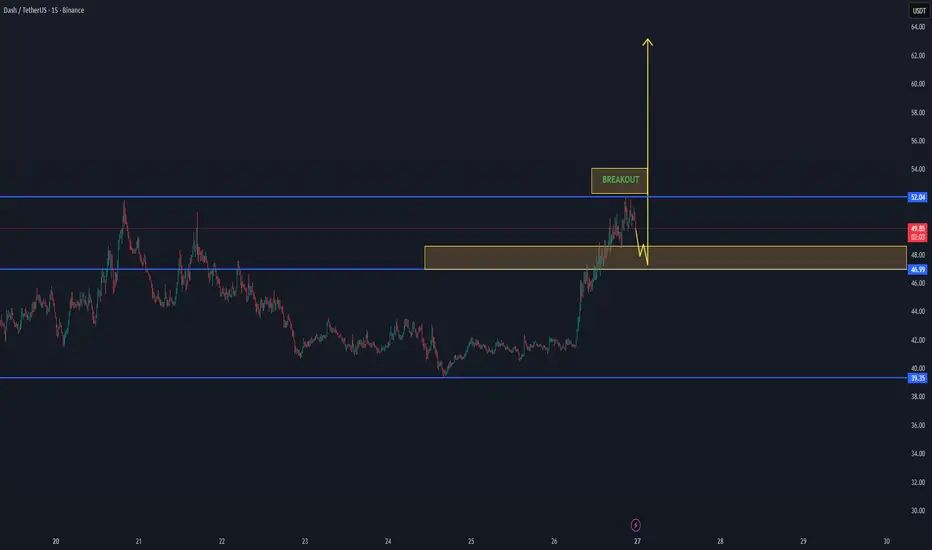
Dash on the Move — Bulls ApproveI expect DASH to rise toward 52, then 56, and later 68.
Two possible paths:
either it reaches 52, makes a pullback to current levels, and then moves up to 56,
or it goes straight to 56 without a pause.
In both cases, this move is part of a corrective triangle ABCDE,
with an upside breakout expected afterward —
which could take DASH even beyond 68 in the foreseeable future.
🎯 Targets:
• Target 1: 52
• Target 2: 56
• Global target: 68
Green — nearest growth potential.
Red — invalidation zone.
Let’s see which path DASH chooses 👀
Stay tuned for updates 🔔

#DASH/USDT#DASH
One of the currencies that witnessed a significant decline over the course of two years
The price has been moving in a descending triangle since the beginning of 2022
But recently the price reached a downward trend and is currently being broken
At a price of 33.00
First goal 59.00
Second goal 79.00
This represents 250% of the current price
With significant oversold and upward momentum
We also find that the MACD indicator is highly oversold
All of this supports the descending triangle pattern that has now been broken
We have a big support area on the chart at 25.00

#DASH/USDT#DASH
The price is moving in a bearish channel on the 12-hour frame and is largely sticking to it
We have a green support area at 26.00 that is expected to be bounced from due to its strength
We have a trend to hold above the Moving Average 100, which is strong support for the rise
We have very strong oversold resistance on the RSI indicator to support the rise with a strong uptrend
Entry price is 29.00
The first goal is 31.83
Second goal 34.24
The third goal is 37.00

DASH TA (Y25.P4.E1).Looking for a major move and how to approachHI Traders,
One can say this is an educational piece as well as the approach to trading it.
If you like it or enjoy it, or not, please give your comments and a like and share.
All the best,
S.SAri


DASHUSDTRisk warning, disclaimer: the above is a personal market judgment based on published information and historical chart data on Tradingview, all analysis is only subjective. Hope investors consider, that I am not responsible for your investment decision.
Thank you.
Good luck

DASHUSDT Forming Bullish WaveDASHUSDT is currently showing a strong bullish wave pattern, signaling renewed momentum and strength from the buyers. This pattern often appears during early stages of a potential trend reversal, indicating that the coin could be gearing up for a powerful rally. The structure suggests that DASH is building a higher low formation, a key sign of accumulation by investors preparing for the next upward breakout. If momentum continues, the projected gain of 70% to 80% looks achievable as bullish pressure intensifies.
Volume remains healthy, supporting the overall bullish narrative. Sustained trading volume often confirms investor confidence and validates the price movement, making the ongoing uptrend more reliable. A rise in volume during breakout points would be a strong indicator that the coin is set for a significant price expansion.
Investor sentiment toward DASHUSDT has been improving, as more traders view it as an undervalued asset with solid recovery potential. The combination of a clear bullish structure, strong technical signals, and consistent market activity positions DASH as a promising short-to-mid-term opportunity. If the bullish momentum continues, this pair could become one of the top-performing assets in the coming sessions.
✅ Show your support by hitting the like button and
✅ Leaving a comment below! (What is You opinion about this Coin)
Your feedback and engagement keep me inspired to share more insightful market analysis with you!

DASH chart shows dual bullish formationsDASH has formed an ascending channel (marked in blue), within which two bullish patterns have formed
The descending expanding wedge, where the price is bouncing off the lower boundary of the global channel, is marked in yellow
A more localized bullish flag has formed within the wedge (marked in green)
Current price: $46.02
Therefore, we have two bullish patterns within the ascending channel, where we see buyer strength. The price is more likely to continue its upward movement, to $47.73 , $50.91 , and above...
The purple area indicates a potential breakout. If the price consolidates there, it will exit the ascending channel, which will become a bearish flag, and the lower boundary of the ascending channel will become the resistance limit for the downward movement
More detailed analysis, additional charts, and key levels to watch are available on our website

DASHUSDT UPDATE#DASH
UPDATE
DASH Technical Setup
Pattern: Bullish Falling Wedge
Current Price: $49.17
Target Price: $65.20
Target % Gain: 36.00%
DASH is breaking out of a bullish falling wedge pattern on the 4H timeframe. Current price is $49.17 with a target near $65.20, showing about 36% potential upside. The breakout indicates strengthening bullish momentum and potential continuation toward higher levels.
Time Frame: 4H
Risk Management Tip: Always use proper risk management.

DASH - PRICE ANALYSIS: NASDAQ:DASH - price analysis:
DOJI on the H4 basis & price is stuck under the 525.50$ key resistance.
Weekly chart looks pretty good,
If bulls manage to hold above the H4 uptrend, then it might be a bullish consolidation before the next big move toward 75$ or even 80$+ 📈
Key support to be maintained:
44.60 - 41.00 - 39.20$
Sum up:
Neutral (short term) (under resistances) ⚠️📉
Bullish bias medium term if uptrend & support mentionned hold. 📈

DASH/USDT Market Update – Breakout Tested, Pullback ExpectedDASH/USDT recently confirmed a breakout above the previous resistance zone near 46.9–47.0 USDT, showing strong upside momentum.
However, after this breakout move, the market is currently cooling down, suggesting a potential pullback retest before continuation.
The key support zone sits around 46–47 USDT — holding this level would confirm healthy consolidation and prepare the structure for a potential next leg up toward the 52–66 USDT range.
If price fails to hold the zone, a deeper retracement toward 39.3 USDT remains possible before another attempt to push higher.
📊 Summary:
Support zone: 46.0 – 47.0 USDT
Resistance target: 52.0 – 66.0 USDT
Structure: Breakout → Retest → Potential continuation
Bias: Bullish, but expecting short-term correction first
🔎 Focus: Watching for retest confirmation and buy pressure re-entry around the support range before any renewed upside.
DASHUSDT UPDATE#DASH
UPDATE
DASH Technical Setup
Pattern: Bullish Falling Wedge
Current Price: $49.17
Target Price: $65.20
Target % Gain: 36.00%
NASDAQ:DASH is breaking out of a bullish falling wedge pattern on the 4H timeframe. Current price is $49.17 with a target near $65.20, showing about 36% potential upside. The breakout indicates strengthening bullish momentum and potential continuation toward higher levels.
Time Frame: 4H
Risk Management Tip: Always use proper risk management.

DASH USDT BULLISH Dash formed bullish structure on 30 min TF, it hit a high of 51$ Monday and it's currently retracing, I believe there's liquidity under that low id like to see that get tapped and swept,filling the FVG and block,Wait for confirmation,
NFA

DASHUSDT Aiming Higher | BullishHi there,
DASHUSDT looks bullish on the M30 timeframe. The price must form a higher low above 44.06 to maintain bullish interest. The price is responding to the support area at 42.00, but there is significant resistance around 46.65.
The potential target area is 49.09, with a bias toward 52.30.
Happy Trading,
K.
--
Not trading advice

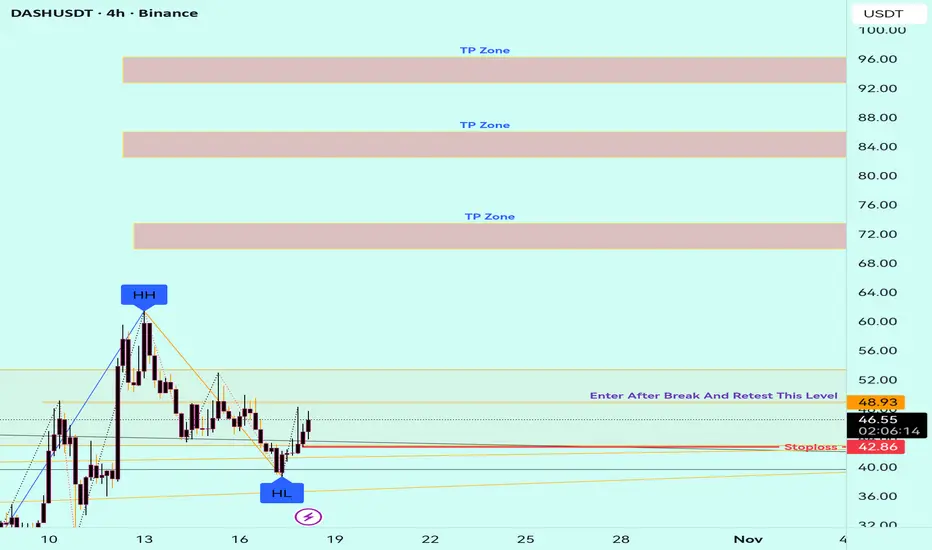
TradeCityPro | DASHUSDT One of the Strongest Long Setups🔹 DASHUSDT Technical Analysis — One of the Strongest Long Setups in the Market!
Let’s dive into the analysis of DASH, one of the older yet technically impressive coins in the crypto market. Despite the recent volatility, DASH has shown stronger bullish structure compared to most altcoins — making it one of the few charts currently setting up for a potential long opportunity.
🌐 Market Overview
Before diving deeper, keep in mind that today and tomorrow the global crypto market will have lower liquidity due to the weekend. This often leads to lighter trading volume and potentially unpredictable price spikes.
If you’re planning to open a position during this period, it’s highly recommended to reduce your risk and avoid over-leveraging.
📈 Bullish Scenario (Long Setup)
The DASHUSDT chart is showing a strong bullish structure and currently consolidating below a key resistance level at 49.22.
Once this level is broken with confirmation and volume, it will likely trigger a sharp upward continuation — supported by the strong uptrend that has been forming over recent sessions.
✅ Long Trigger: Break and close above 49.22
🎯 Target 1: 55.00
🎯 Target 2: 60.13
The area around 60.13 is crucial, as breaking it could lead to a parabolic move, especially if market volume returns early next week.
📉 Bearish Scenario (Short Setup)
In case of an early rejection from 49.22 or a sudden drop due to the low-volume weekend conditions, we should monitor the 39.34 support zone closely.
A confirmed break below 39.34 could signal a shift in short-term momentum, opening room for a short position.
However, it’s worth noting that other coins — particularly TON and IMX — currently show cleaner short triggers and may offer better setups in case the market turns bearish.
⚙️ Risk Management Tip
Since the market is in a low-liquidity phase, it’s important to:
Use smaller position sizes
Wait for candle confirmation on the breakout
Set tight stop-losses just below local supports
🎯 Summary
🟢 Long Setup: Break above 49.22 → Target 55.00–60.13
🔴 Short Setup: Break below 39.34 → Conservative entry (better shorts on TON & IMX)
⚠️ Note: Trade lighter due to low weekend volume
💬 Final Thoughts:
DASH stands out among altcoins this week with a notably stronger bullish chart structure. The trend is constructive, and if momentum continues next week, a confirmed breakout could deliver one of the best long trades of the week.
Stay patient, watch the 49.22 level closely, and let the market confirm the move before entering.

DASH (DASHUSDT) — Technical Breakout Setup & Key Levels
💡 Description:
DASH, one of the early privacy-focused cryptocurrencies, aims to provide fast and low-cost digital payments through its unique two-tier network and masternode system. Despite declining market attention compared to its peak years, DASH continues to maintain strong fundamentals in transaction efficiency and governance decentralization.
In this analysis, I highlight potential breakout zones, trend structure, and dynamic support/resistance areas. Key price levels will determine whether DASH continues its short-term bullish momentum or faces rejection near the upper range. Volume confirmation and RSI divergence are closely monitored for validation.
This setup is for educational and informational purposes only — not financial advice. Always do your own research and manage risk accordingly.
#DASH #DASHUSDT #CryptoAnalysis #PriceAction #TechnicalAnalysis #BreakoutTrading #RSI #ChartPatterns #CryptoTrading #Altcoins #MarketStructure #TraderCommunity #TradingView