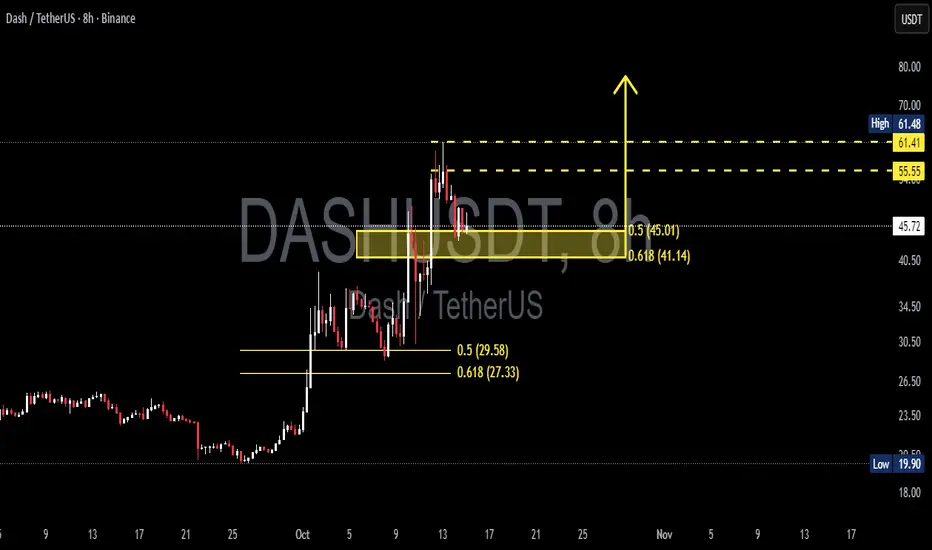
DASHUSDT — Decision Point at Golden Zone: Can Bulls Defend TrendThe price of DASH/USDT is now standing at a critical decision zone. After breaking out from a long consolidation phase, DASH experienced a strong rally toward 61.4 USDT, followed by a healthy correction into the golden pocket (0.5–0.618 Fibonacci retracement) area between 45.0–41.1 USDT.
This region now acts as the battleground between buyers and sellers, which will determine whether the bullish trend continues or fades.
---
🔶 Technical Overview & Key Levels
Timeframe: 8 Hours
Current Price: ~46.4 USDT
Key Zones:
Main Support / Retest Area: 45.01 – 41.14 USDT
Primary Resistance: 55.55 USDT
Major Resistance: 61.41 – 61.48 USDT
Next Supports (if breakdown occurs): 29.6 – 27.3 USDT
Major Low / Last Defense: 19.9 USDT
This corrective move toward the golden pocket shows a healthy retracement structure within an impulsive trend — suggesting that the market might be cooling off before attempting another leg higher.
---
🟩 Bullish Scenario — Golden Pocket as the Launchpad
If price can hold above 41.1 USDT and show strong bullish reaction (e.g., bullish engulfing candle, pinbar, or increasing volume), the golden pocket could become the launchpad for the next upward wave.
Bullish Confirmation:
8H close above 46.5 USDT
Increasing buy volume
Clear rejection wicks from 45–41 zone
Upside Targets:
TP1: 55.55 USDT (minor supply zone)
TP2: 61.4 USDT (previous high)
Stretch Target: 70.0 USDT if bullish momentum strengthens
Possible Strategy:
Conservative entry: After 8H close above 46.5
Aggressive entry: Within 43–45 zone with a tight stop below 41.0
---
🟥 Bearish Scenario — Failure to Defend the Golden Zone
If sellers manage to push the price below 41.1 USDT, with strong volume and a solid 8H close, the bullish structure weakens. This would signal potential for a deeper correction.
Bearish Confirmation:
8H candle closes below 41.1 USDT
Increased sell volume
Weak or no bullish reaction in the golden pocket
Downside Targets:
TP1: 29.6 USDT
TP2: 27.3 USDT
TP3 (final support): 19.9 USDT
Possible Strategy:
Enter short after 8H close below 41.1
Stop-loss above 45.0
---
📊 Pattern Structure
From a technical perspective, the current setup resembles a bullish flag / breakout retest pattern — where price pulls back gradually after a strong impulse.
The yellow box area highlights a potential accumulation or re-entry zone where buyers could step back in.
If DASH shows strong rejection candles or a surge in buy volume from this zone, it would validate the idea of the market recharging for the next upward leg.
---
⚖️ Conclusion
DASH is currently testing the golden Fibonacci zone (45–41 USDT) — a make-or-break area that will define the next medium-term move.
As long as price stays above this zone, the probability of a rebound toward 55–61 USDT remains strong.
However, a confirmed breakdown below 41.1 could trigger a deeper correction toward 30–20 USDT levels.
With volatility rising and structure tightening, DASH is entering a decision point — a zone where bulls must defend to maintain control, or risk a reversal led by sellers.
---
#DASH #CryptoAnalysis #TechnicalAnalysis #Fibonacci #CryptoTrading #Altcoins #PriceAction #MarketStructure #SwingTrade
Trade ideas
DASH/USDT , 1W ( Ready for 85% Up Move ) Dash is moving inside wedge or ascending channel pattern , when it is at support and forming the pattern at support after breaking out the pattern it is giving very good move like previous and now we can expect 80% move .
and at the same time Bitcoin dominance is decreasing and altcoins dominance is started increasing , so look on all the altcoins
and follow proper risk management , it has very good chances to move UP side but first we have to protect the down side , where risk management comes into game .

Dash free cash This is a conservative target for Dash, just the next move before a small retrace - In comparison Zec has already hit its 200% fib and now loading up for the 300%, I've only charted Dash here to the 161.80%, i expect to revise this
Dash candles need to hold the parabolic channels of the ascending Gann fib rays, breaking below these fib rays would be bearish

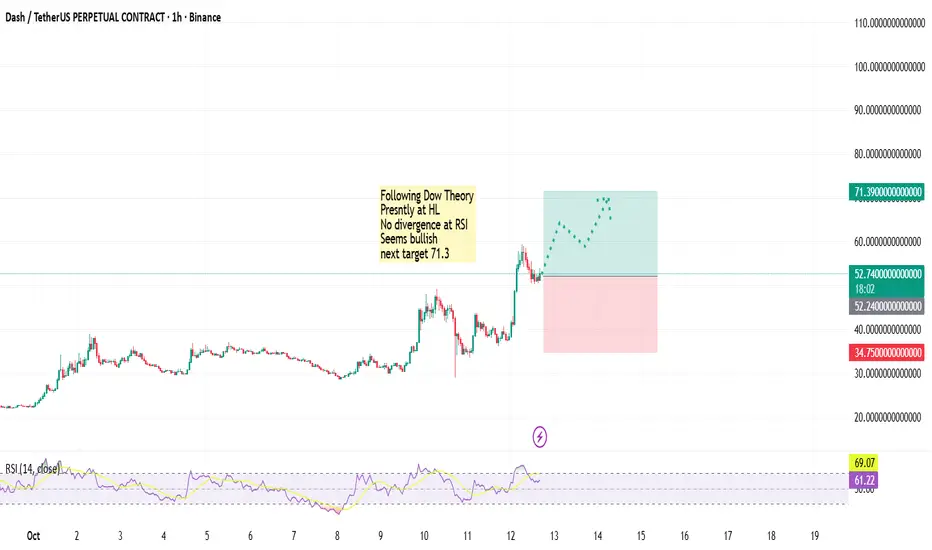
DASHUSDT Holding Higher Low — Eyeing 71.3 NextDASHUSDT is currently maintaining structure in line with Dow Theory, forming a Higher Low (HL), indicating that buyers are still in control of the broader move. RSI shows no bearish divergence, supporting the continuation of bullish momentum rather than signaling exhaustion. With price holding above recent support and structure remaining intact, sentiment leans bullish. As long as current HL is respected, the next upside objective stands around 71.3, where the next resistance zone is likely to be tested.
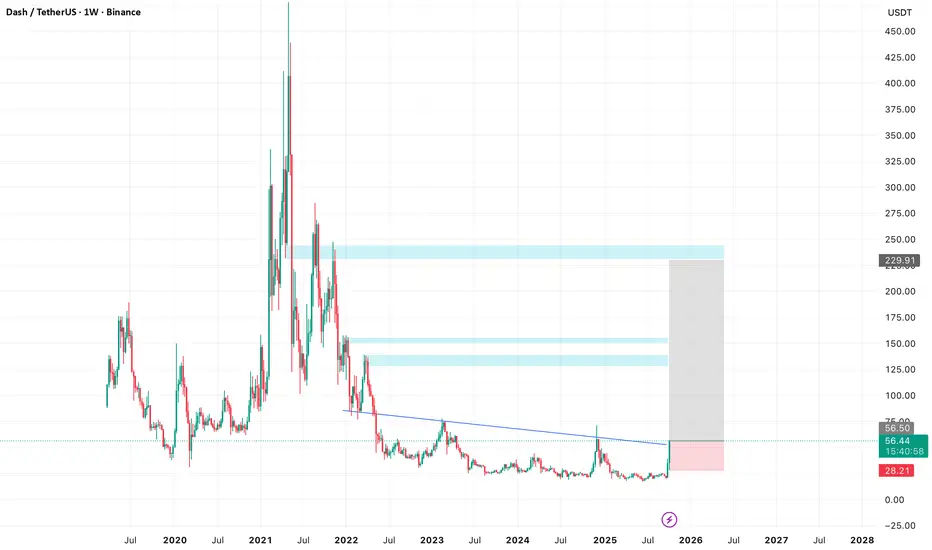
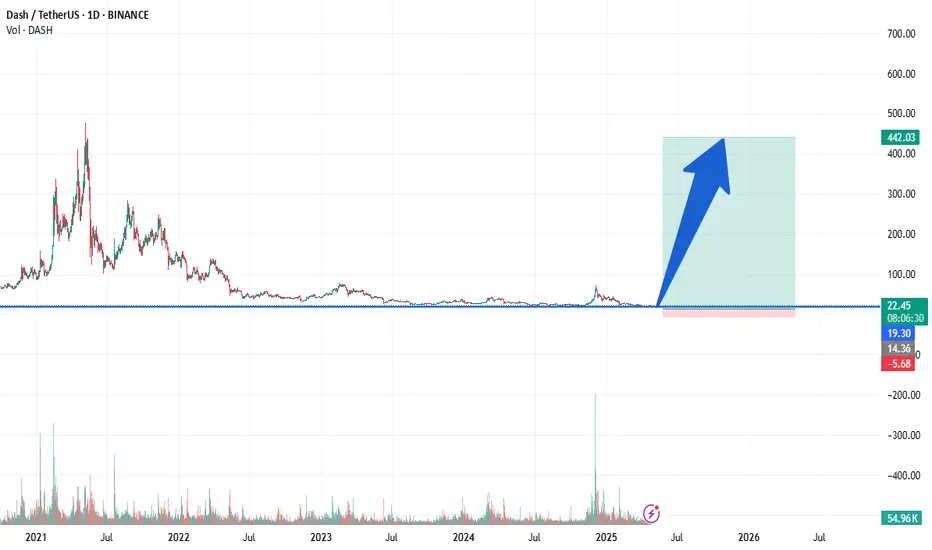
Dash is breaking out! Next ZEC?Hi, Dash is breaking out the 3 years trendline, looks like this massive triple bottom could send price higher. Dash market cap is now at 700M, i think we will see 1B very soon.
If you find this useful, feel free to share this setup with your trader friends.
Thanks for reading!
Luke.
Very simple method to follow for TP'sVery simple method to follow for TP's - Looking at DASH trade today using Candle by Candle method for TP's

Dash Goes Bullish · My Market EdgeIt is always such an interesting situation, when the market is about to turn. It is always so hard to predict the next bullish wave, yet in retrospect, we can see all the signals were present before the event. Dash is already moving higher.
This is a long-term chart and here we have everything but bullish action. Bullish action is the "missing part." "We are only missing the bull-run."
For someone that is familiar with the cryptocurrency market and the charts of project that have been around for 6-8 years, the missing part is a done deal.
For someone who trades commodities, forex or stocks, things might not be the same. This market has a bullish bias, and not everybody knows this. This is a young growing market; to start, the tendency is up.
With this, we already know in which direction we should err. Never bearish always bullish. That's the motto. But, I will let you know when the market turns bearish and we will ride the bearish wave oh yes.
There is nothing wrong with making money from something that cannot be avoided. Market prices will always fluctuate. If we have the ability to know this information in advance, before it happens, it is our right to make the most of it. It is the logical thing to do.
If you have food and you know how to cook, and you feel hungry, you cook.
If you want to make money and you have access to the Cryptocurrency market, TradingView and these charts, well, let's trade.
What's your edge?
I can read the chart.
I can feel the market.
What about you?
Namaste.

DASHUSDT TRADING IDEA
Traders can open their Buy Trades after the breakout is confirmed.
🔴 SL @ 22.80
🔵 TP1 @ 25.00
🔵 TP2 @ 28.00
🔵 TP3 @ 30.00
What are these signals based on?
📊 Classical Technical Analysis
📈 Price Action Candlesticks
📉 Fibonacci
🔵 RSI, Moving Average, Ichimoku, Bollinger Bands
⚠️ Risk Warning:
Trading Forex, CFDs, Crypto, Futures, and Stocks involves a risk of loss. Please consider carefully if such trading is appropriate for you. Past performance is not indicative of future results.
If you liked our ideas, please support us with your likes 👍 and comments.

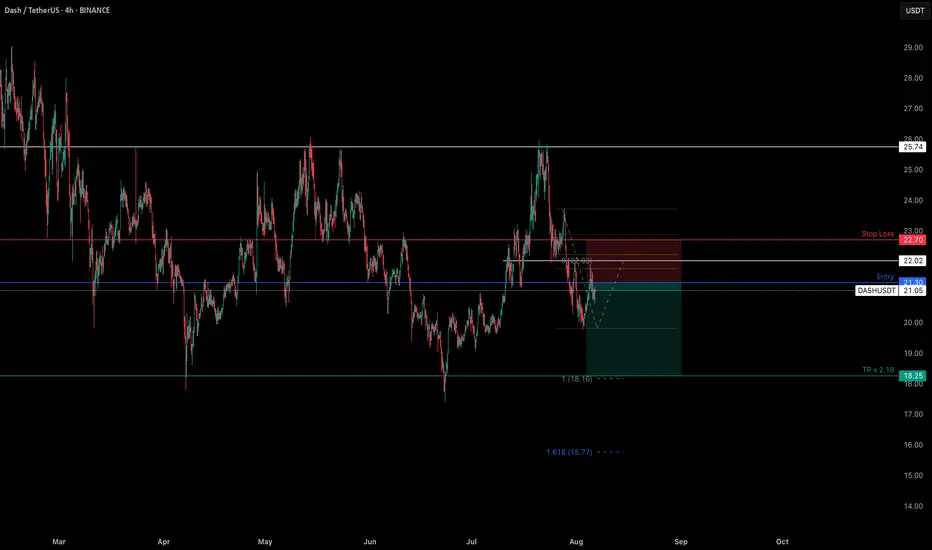
DASHUSDT - SHORTMarket Structure: Based on the 1D TF, there is a support level @ 17.25 and a resistance level @ 25.74. On July 23, the price of DASHUSDT bounced off the resistance level therefore we can assume that the price will move towards the support level @ 17.25.
Area of Value: Based on the 4H TF, we can see the possible pivot points with the confluence of the Fib. Retracement and Resistance level @ 22.02.
Entry: We have entered the trade @ 21.30, after a justifiable bounce off our Area of Value.
Exits:
- Stop Loss level @ 22.70 which is the top off our bounce + ATR Value.
- Take Profit @ 18.25 which respects the Fib. Extension @ 18.16, and Support level @ 17.25
Max R:R = 2.18
DASH double top (Chart is inverted)Using this source as it highlights the basing pattern better.
Crypto is annoying due to the multiple sources and exchange dependancy, as my crypto.com sourced chart doesn't highlight the highest the basing line could be.
Not financial advice

DASHUSDT 2D AnalysisDASH ~ 2D Analysis
#DASH Buy back gradually from this support block with short term target of at least 15%+ , Long term target $65

DASHBreak the floors one by one
In the short term, if the blue one is not lost, it will go to the red box, and if it fails, the first step is the orange lines
But if it fails, it should come to the green ones
If you read it, you can make sharp moves, they can grow between 60 and 240 percent. But entry is important

DASH/USDT , 1DPattern is Broken Out and Retesting the Trendline
if Bitcoin is continues its bullishness , then we can take up this trade
Enter with proper risk management , allocate less first and them allocate more if the direction is confirm

Bearish Momentum Resumes in DASH – Entry, Target, and Risk LevelThe daily chart shows a clear downtrend within a defined bearish channel where the price has been forming lower highs and lower lows. After a false breakout above the channel resistance in late April, the price failed to hold above that breakout level and quickly dropped back into the channel — a classic bearish signal that confirms the ongoing downward pressure.
Read My Latest Analysis on LTC , XRP and BNB
At present, DASH is trading around $21.02 to $21.19, just below the upper trendline of the descending channel. This area has acted as a resistance zone, especially after the false breakout failed to gain momentum. The broader structure indicates that the bears are still in control.
Your short entry should ideally be placed between $21.00 and $21.20, just under the resistance line. The target for this trade would be the key support area at $17.86, and if the bearish momentum strengthens, the next level to watch is $15.00, which is a strong historical support and psychological round number.
A reasonable stop-loss for this trade would be $25.12, which is above the most recent high where the false breakout occurred. If price climbs back to that level, it would invalidate the bearish setup.
This trade setup offers a good risk-reward ratio — aiming for a potential drop of 15–28% while risking around 19%. The rejection after the breakout and return into the bearish channel suggests that sellers have regained control and that the price is likely to retest the support levels in the coming days or weeks.

Technical Analysis for $Dash:🔵
#DASH Price is currently moving above a strong collection area, suggesting a potential bullish move.
Key Support Level: The strong support lies between 20.00 – 21.00 USD.
Safe entry if the price maintains above 21.00$.
Or after a corrective move towards 21.00$ with a confirmed bounce.
📈 Target Levels (TPs):
🎯 Target 1: 44.00 USD
🎯 Target 2: 60.00 USD
⚠️ Note: Breaking above the 27$–30$ area with strong volume will confirm the bullish trend continuation toward the targets.

DASHCOIN BULLISHDASH COIN IS PRETTY BULLISH AND GOOD TO HOLD FOR A LONGTERM YOU CAN GET UP TO 3000% gain to max your Earnings. NOW IS THE TIME TO BUY BOTTOM IS HERE at this current price level!
As of April 25, 2025, Dash (DASH) is experiencing a bullish trend, with its price ranging between $29.05 and $32.41 for the month. This marks a significant recovery from earlier in the year, indicating renewed investor confidence and market interest.
📈 Dash Price Forecast for 2025
Analysts have provided the following projections for Dash's price movement throughout 2025:
May 2025: Expected to trade between $30.25 and $33.91, with an average price of $31.35.
CoinCodex
+3
InvestMage 🧙
+3
CryptoDisrupt
+3
June 2025: Anticipated range of $31.78 to $35.48, averaging $32.60.
CryptoDisrupt
July 2025: Forecasted between $32.76 and $36.78, with an average of $33.58.
CryptoDisrupt
These projections suggest a steady upward trajectory, potentially reaching a high of $44.59 by December 2025.
CryptoDisrupt
🔍 Factors Influencing Dash's Bullish Outlook
Several elements contribute to Dash's positive market performance:
Enhanced Privacy Features: Dash's emphasis on privacy and fast transactions appeals to users seeking secure alternatives to traditional financial systems.
Investopedia
Masternode Network: The masternode structure not only facilitates faster transactions but also supports governance and funding for network improvements.
Investopedia
Market Sentiment: A neutral Fear & Greed Index of 54 indicates balanced investor sentiment, with a slight tilt towards bullishness.
CoinCodex
⚠️ Considerations
While Dash's outlook appears promising, potential investors should be aware of:
Regulatory Challenges: Privacy-focused cryptocurrencies like Dash face scrutiny in various jurisdictions, which could impact adoption and usage.
Investopedia
Market Volatility: Cryptocurrency markets are inherently volatile; thus, price fluctuations are common and should be anticipated.
In conclusion, Dash is positioned for potential growth in 2025, driven by its unique features and favorable market conditions. However, it's essential to stay informed about regulatory developments and market dynamics when considering investment decisions.
DASHUSDT 1D#DASH recently broke above the descending resistance and is now breaking above the MA50 on the daily chart. Keep an eye on the Ichimoku cloud. In case of a breakout above it, the targets are:
🎯 $30.51
🎯 $38.37
🎯 $44.72
🎯 $51.08
🎯 $60.12
⚠️ Use a tight stop-loss.

DASHUSDT 2D AnalysisDASH ~ 2D Analysis
#DASH If you still have a Conviction on this Coin, Maybe this support block you can consider to start buying back from here with a short -term target of at least 15%+.

DashUSDTRSI indicates Bullish Divergence. Which means that at any time the market trend can change to HH and HL.


No DASH anymore!I believe that DASH will no longer be able to maintain its value if it loses this support zone.


DASHUSDT 1WDASH ~ 1W Analysis
#DASH Support that you might be able to consider to start buying back from here with a minimum target of 20%+.
Reason, This is the lowest support for now.
