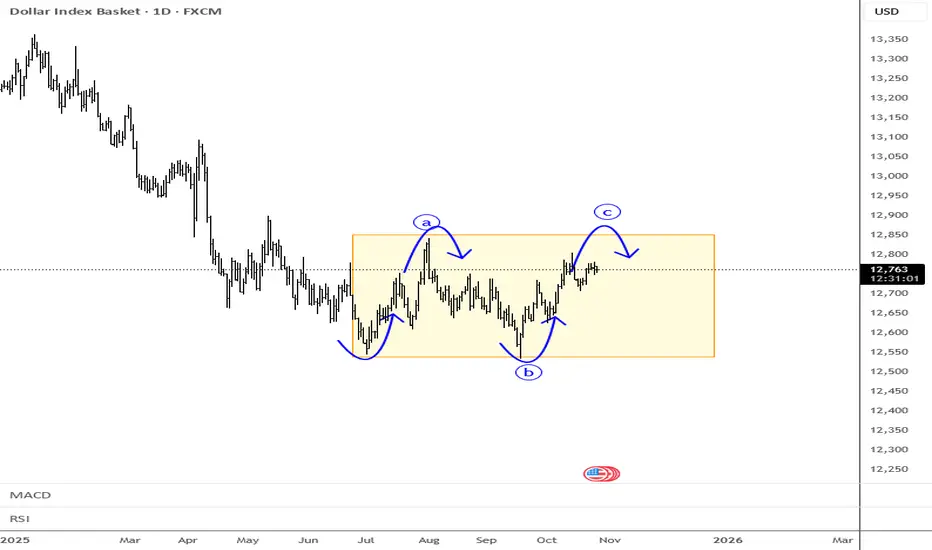
Dollar In Range-And It May Not Be Broken Soon...Stocks are pushing nicely to the upside after some optimism that a deal could be reached between the US and China regarding tariffs, as reported this weekend by Trump himself. He’s clearly driving the market into a risk-on mode.
However, it’s interesting to see that the dollar is still going nowhe
About Dow Jones FXCM Dollar
The Dow Jones FXCM Dollar Index (short: DJ FXCM Index) is a currency index that tracks the strength of the US Dollar against a basket of the four most liquid currencies in the world. It is the product of collaboration between FXCM and S&P Dow Jones Indices. The index was designed to help traders assess whether the US Dollar is strengthening or weakening and is known for its transparency and simplicity. It reflects the change in value of the US Dollar measured against the basket of currencies: it rises when the US Dollar gains value relative to this basket and it falls when the opposite happens.
The basket contains the Euro, the British Pound, The Japanese Yen and the Australian Dollar in equal amounts, which are equally weighted. It is geographically balanced and accounts for 80% of worldwide Forex activity. The DJ FXCM Index was introduced on January 1, 2011, at a value of 10,000.00, is calculated every 15 seconds and updated Monday to Friday. It should not be mistaken for the much older and more complex US Dollar Index (DXY), which represents the weighted geometric mean of the US Dollar's value compared to six specific currencies. The weights were set according to trade weights and the Euro has the dominant weight in the DXY.
The basket contains the Euro, the British Pound, The Japanese Yen and the Australian Dollar in equal amounts, which are equally weighted. It is geographically balanced and accounts for 80% of worldwide Forex activity. The DJ FXCM Index was introduced on January 1, 2011, at a value of 10,000.00, is calculated every 15 seconds and updated Monday to Friday. It should not be mistaken for the much older and more complex US Dollar Index (DXY), which represents the weighted geometric mean of the US Dollar's value compared to six specific currencies. The weights were set according to trade weights and the Euro has the dominant weight in the DXY.
Related indices
USDXUSDX could confirm by reversal conditions and keep the uptrend as liquidity shortage in FED to indicate the lack of supply in liquidity in banks to confirm the opportunity of decreasing Interest rate so that is normal to push USDx higher and Gold down and when the rate confirmed the direction and th

Gold USDXIntermarket now works between USDx and Gold so if that demand zone broken at this supply zone @USDX then @XAUUSD will activate the 4100 demand and if Usdx respect this small demand zone and keep the uptrend the Gold will fall to 4040
#MA_Intermarket

Gold --USDXAfter USDX go uptrend it might be go to demand zone and if that happened Gold might make uptrend and that appeared when USDX go a little bit in lower price Gold run to higher price that means no Gold affected by USDX more than bonds. and those zones control the market
#MA_Strategy
#MA_Intermarket

USD Index: Bearish for today?At least for today it looks like dollar index is bearish.
Waiting for #1 BOS - as initial confirmation that bearish is taking over.
#2 BOS - should provides a confirmation that bearish is on its way.

Dollar Index: Bullish Momentum Builds Above $12,545FenzoFx—The dollar index rose from $12,545.0 after a liquidity sweep below July's low. The index is up by 0.33% today, while the bullish FVG at $12,601.0 hasn't been tested or filled. This indicates the bullish momentum is strong.
From a technical standpoint, we expect the price to fill the bearish

Cutting Losses is an Art – and the Trader is the Artist.🎨 Cutting Losses is an Art – and the Trader is the Artist.
Why Traders Struggle with Losses
In theory: cut your losses early, let your winners run.
In practice? It's an art – forged through discipline, experience, and the battle within.
Many enter the market quickly, full of hope, with no pla
Potential Head and Shoulders for the USDThis pattern has been forming on the daily for a while. Still not confirmed with some choppy action so await confirmation of a break to the neckline before shorting USD. However, a coincidence or not, we have some significant US economic reports GDP, unemployment, and PCE. If the numbers underwhelm

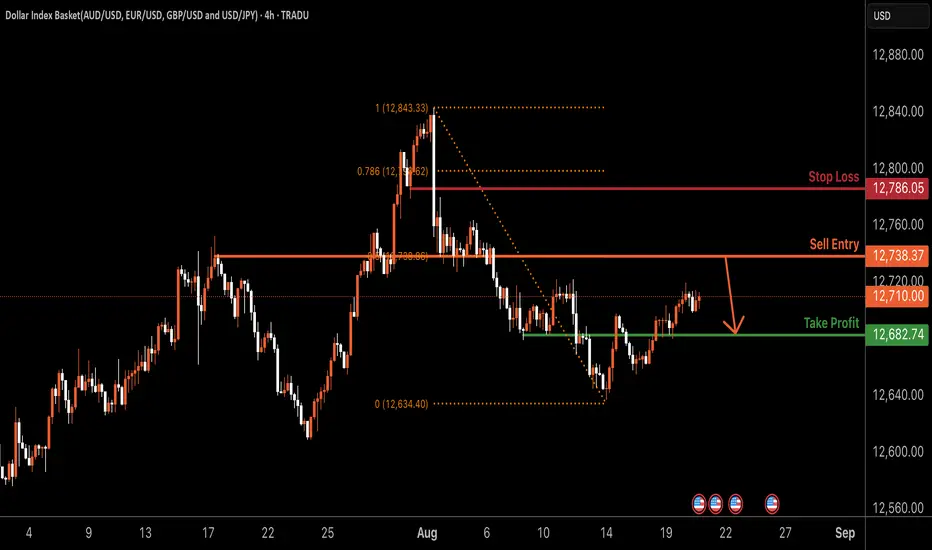
USDOLLAR H4 | Bearish reversal off 50% Fibonacci resistanceBased on the H4 chart analysis, we could see the price rise to the sell entry, which is an overlap resistance that aligns with the 50% Fibonacci retracement and could reverse from this level to the take profit.
Sell entry is at 12,738.37, which is an overlap resistance that lines up with the 50% Fi
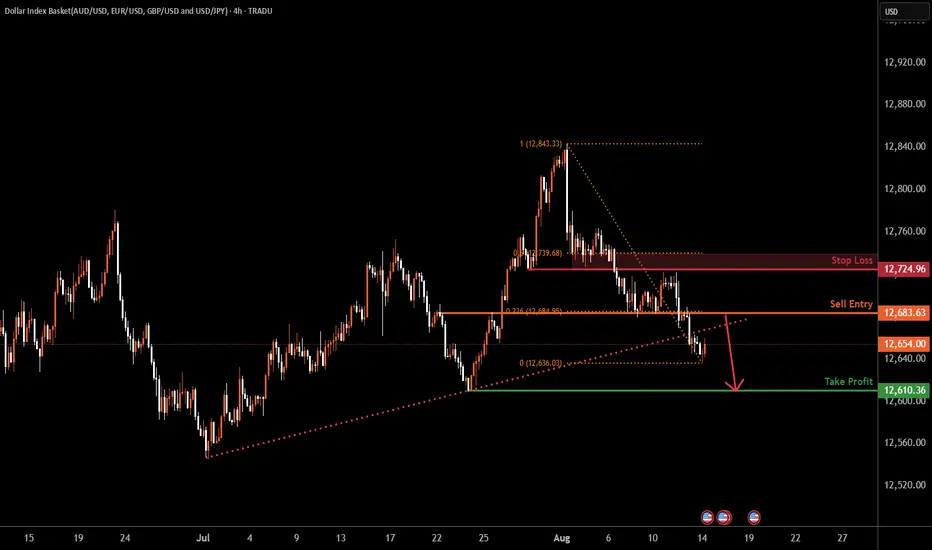
USDOLLAR H4 |Bearish reversal off overlap resistance?Based on the H4 chart analysis, we could see the price rise to the sell entry at 12,683.63, which is an overlap resistance that aligns with the 23.6% Fibonacci retracement. From this level, the price could drop towards the take profit.
Stop loss is at 12,724.96, which is an overlap resistance that
See all ideas
Summarizing what the indicators are suggesting.
Oscillators
Neutral
SellBuy
Strong sellStrong buy
Strong sellSellNeutralBuyStrong buy
Oscillators
Neutral
SellBuy
Strong sellStrong buy
Strong sellSellNeutralBuyStrong buy
Summary
Neutral
SellBuy
Strong sellStrong buy
Strong sellSellNeutralBuyStrong buy
Summary
Neutral
SellBuy
Strong sellStrong buy
Strong sellSellNeutralBuyStrong buy
Summary
Neutral
SellBuy
Strong sellStrong buy
Strong sellSellNeutralBuyStrong buy
Moving Averages
Neutral
SellBuy
Strong sellStrong buy
Strong sellSellNeutralBuyStrong buy
Moving Averages
Neutral
SellBuy
Strong sellStrong buy
Strong sellSellNeutralBuyStrong buy
Displays a symbol's price movements over previous years to identify recurring trends.