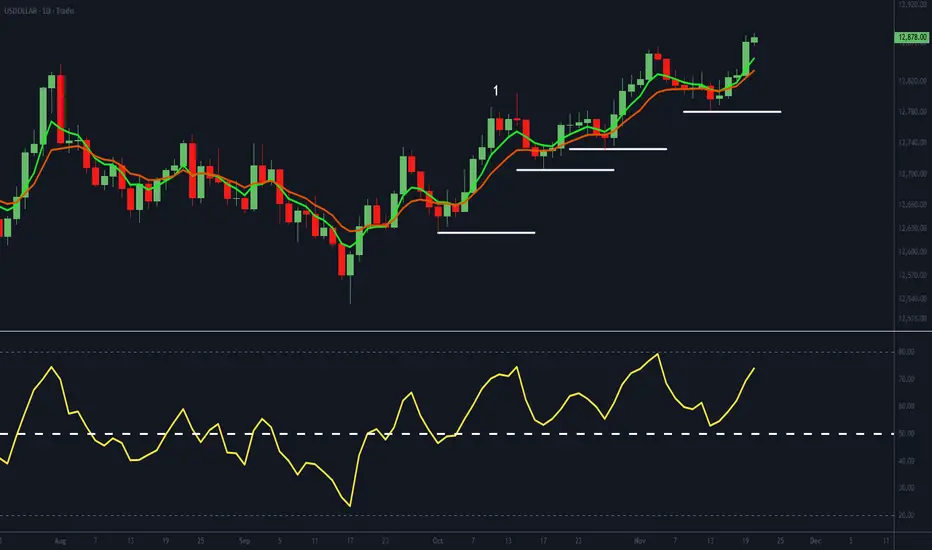
The Dollar’s Climb: A Trend With More Fuel in the Tank?The USDOLLAR daily chart is in a clear uptrend, defined by a sequence of higher troughs and higher peaks. The EMAs are aligned in a bullish formation with strong angle and separation, and the RSI remains above 50 - signalling positive underlying momentum for the greenback.
Market participants positioned themselves well early on, with the first higher peak after a higher trough forming at point 1, even before Fed Chair Jerome Powell pushed back - in unusually blunt terms - against a December rate cut during his 29 October press conference.
Since then, the dollar has been on a tear. A break below the most recent higher trough would warrant a reassessment, but for now the USDOLLAR continues to present a firm uptrend.
Trade ideas
USDXUSDX could confirm by reversal conditions and keep the uptrend as liquidity shortage in FED to indicate the lack of supply in liquidity in banks to confirm the opportunity of decreasing Interest rate so that is normal to push USDx higher and Gold down and when the rate confirmed the direction and the date of next meeting the Gold will keep uptrend again and USDx downtrend
so now the USDx direction might be those two scenarios one of them confirm the reversal conditions of MA to run to the next higher zone to let the Gold fall again. Also the second scenario is breaking the MA2 zone and retest it with MA reversal conditions to fall and let Gold go to the moon again
#MA_Intermarket

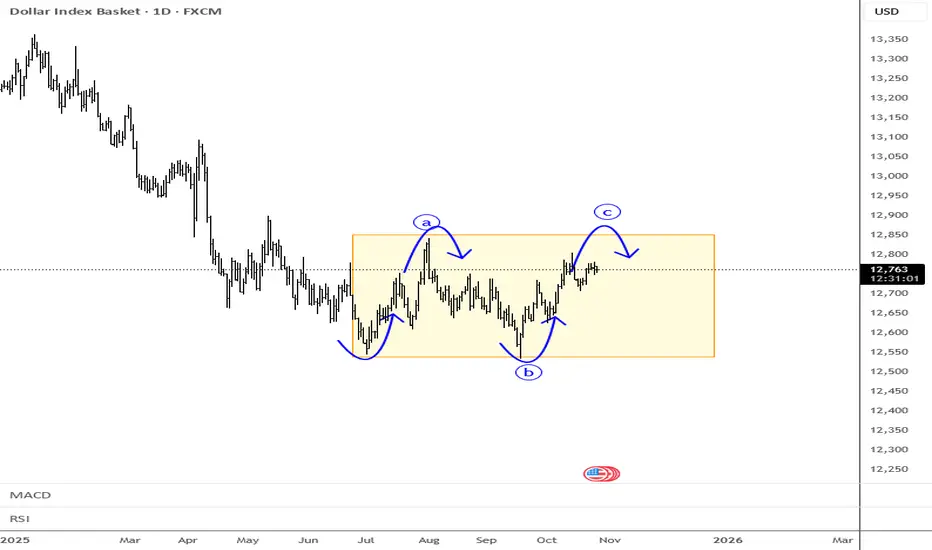
Dollar In Range-And It May Not Be Broken Soon...Stocks are pushing nicely to the upside after some optimism that a deal could be reached between the US and China regarding tariffs, as reported this weekend by Trump himself. He’s clearly driving the market into a risk-on mode.
However, it’s interesting to see that the dollar is still going nowhere; the only FX market showing a more decisive move is the Aussie, which is naturally benefiting from this story.
Looking at the dollar index, no one knows where it wants to move but basic analysis in ranges is simple; "down from resistance, up from the support".
Keep in mind we’re still missing the latest US jobs data, so the outlook for further cuts remains uncertain, and that could keep the dollar moving sideways for now.
Have a nice trading week!
GH
Gold --USDXAfter USDX go uptrend it might be go to demand zone and if that happened Gold might make uptrend and that appeared when USDX go a little bit in lower price Gold run to higher price that means no Gold affected by USDX more than bonds. and those zones control the market
#MA_Strategy
#MA_Intermarket

Gold USDXIntermarket now works between USDx and Gold so if that demand zone broken at this supply zone @USDX then @XAUUSD will activate the 4100 demand and if Usdx respect this small demand zone and keep the uptrend the Gold will fall to 4040
#MA_Intermarket

USD Index: Bearish for today?At least for today it looks like dollar index is bearish.
Waiting for #1 BOS - as initial confirmation that bearish is taking over.
#2 BOS - should provides a confirmation that bearish is on its way.

Dollar Index: Bullish Momentum Builds Above $12,545FenzoFx—The dollar index rose from $12,545.0 after a liquidity sweep below July's low. The index is up by 0.33% today, while the bullish FVG at $12,601.0 hasn't been tested or filled. This indicates the bullish momentum is strong.
From a technical standpoint, we expect the price to fill the bearish FVG with resistance at $12,686.0. Furthermore, if the price closes above this level, the uptrend could extend to the equal highs at $12,740.0.
Please note that the bullish outlook should be invalidated if the price closes below $12,601.0.

Cutting Losses is an Art – and the Trader is the Artist.🎨 Cutting Losses is an Art – and the Trader is the Artist.
Why Traders Struggle with Losses
In theory: cut your losses early, let your winners run.
In practice? It's an art – forged through discipline, experience, and the battle within.
Many enter the market quickly, full of hope, with no plan or risk awareness.
One wrong click – and they rely on luck instead of a system.
Anyone who trades without a setup or stop-loss isn't playing the game –
they're gambling.
Stop-Loss Isn’t Just Technical – It’s a Mirror of Your Discipline
It should be placed where your idea is objectively invalidated,
not where it just "feels okay."
Why is that so hard?
Because money is emotional
Because losses feel like personal failure
Because the market teaches you with pain if you don’t learn
🧠 “You should consider the money gone the moment you enter a trade.”
That’s not cynicism – it’s psychological armor.
If the trade fails, your self-worth and peace of mind remain intact.
That’s how you protect your mental capital and stay in the game – in trading and in life.
Technical Control + Psychological Honesty = Survival
Ask yourself:
Where is my personal pain threshold?
When do my hands start to sweat?
What is “a lot of money” – to me, objectively and emotionally?
Can I lose without falling apart emotionally?
Because the market will test you.
📉 It will test your ego.
💸 It will take without giving – if you're not prepared.
⏳ Patience is your sharpest weapon.
⚔️ And your greatest enemy? Greed, fear, hope.
A Pro Cuts Losses Mechanically – Not Emotionally
Every trade is just a try – with risk, with expectation, but no guarantee.
In the end, it’s not about how often you win –
it’s about how little you lose when you’re wrong.
📊 Chart Examples: Real-World Loss Management in Action
✅ Disciplined Exit
Clean stop-loss executed as planned. No hesitation, no hope.
“My setup was invalidated. The loss was expected, sized correctly, and accepted.”
❌ Emotional Hold
Ignored the stop-loss, hoping for a reversal.
“I hoped instead of acted. This was costly and unnecessary.”
⚖️ Clean Loss Despite Perfect Setup
All rules followed – but still hit the stop.
“Good trade, bad outcome. Still the right decision. Long-term edge remains.”
💬 How do YOU handle losses? Share your thoughts in the comments below.
🔔 Follow me for more on trading psychology, risk management & real chart breakdowns.
Potential Head and Shoulders for the USDThis pattern has been forming on the daily for a while. Still not confirmed with some choppy action so await confirmation of a break to the neckline before shorting USD. However, a coincidence or not, we have some significant US economic reports GDP, unemployment, and PCE. If the numbers underwhelm then we could break bearish.

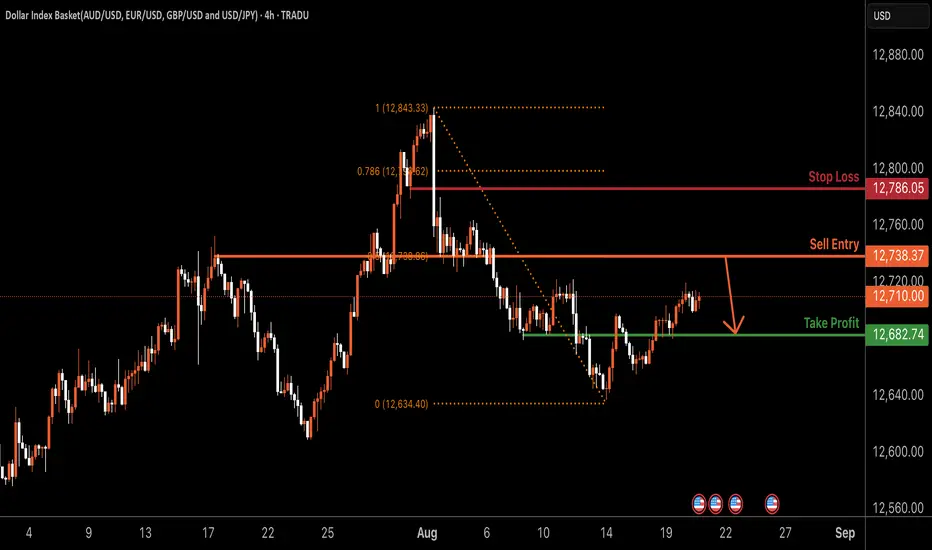
USDOLLAR H4 | Bearish reversal off 50% Fibonacci resistanceBased on the H4 chart analysis, we could see the price rise to the sell entry, which is an overlap resistance that aligns with the 50% Fibonacci retracement and could reverse from this level to the take profit.
Sell entry is at 12,738.37, which is an overlap resistance that lines up with the 50% Fibonacci retracement.
Stop loss is at 12,786.05, which is a pullback resistance that is slightly below the 78.6% Fibonacci retracement.
Take profit is at 12,682.74, which is a pullback support.
High Risk Investment Warning
Trading Forex/CFDs on margin carries a high level of risk and may not be suitable for all investors. Leverage can work against you.
Stratos Markets Limited (tradu.com ):
CFDs are complex instruments and come with a high risk of losing money rapidly due to leverage. 65% of retail investor accounts lose money when trading CFDs with this provider. You should consider whether you understand how CFDs work and whether you can afford to take the high risk of losing your money.
Stratos Europe Ltd (tradu.com ):
CFDs are complex instruments and come with a high risk of losing money rapidly due to leverage. 66% of retail investor accounts lose money when trading CFDs with this provider. You should consider whether you understand how CFDs work and whether you can afford to take the high risk of losing your money.
Stratos Global LLC (tradu.com ):
Losses can exceed deposits.
Please be advised that the information presented on TradingView is provided to Tradu (‘Company’, ‘we’) by a third-party provider (‘TFA Global Pte Ltd’). Please be reminded that you are solely responsible for the trading decisions on your account. There is a very high degree of risk involved in trading. Any information and/or content is intended entirely for research, educational and informational purposes only and does not constitute investment or consultation advice or investment strategy. The information is not tailored to the investment needs of any specific person and therefore does not involve a consideration of any of the investment objectives, financial situation or needs of any viewer that may receive it. Kindly also note that past performance is not a reliable indicator of future results. Actual results may differ materially from those anticipated in forward-looking or past performance statements. We assume no liability as to the accuracy or completeness of any of the information and/or content provided herein and the Company cannot be held responsible for any omission, mistake nor for any loss or damage including without limitation to any loss of profit which may arise from reliance on any information supplied by TFA Global Pte Ltd.
The speaker(s) is neither an employee, agent nor representative of Tradu and is therefore acting independently. The opinions given are their own, constitute general market commentary, and do not constitute the opinion or advice of Tradu or any form of personal or investment advice. Tradu neither endorses nor guarantees offerings of third-party speakers, nor is Tradu responsible for the content, veracity or opinions of third-party speakers, presenters or participants.
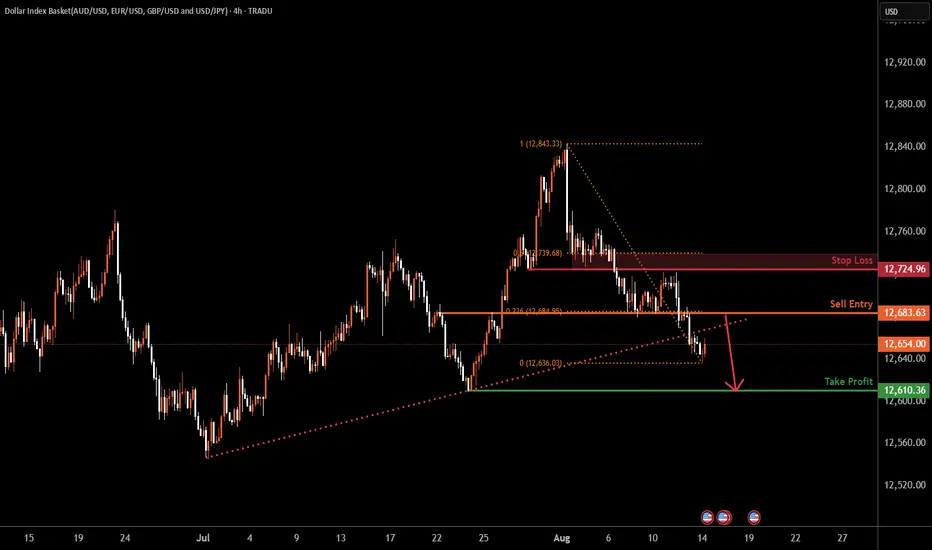
USDOLLAR H4 |Bearish reversal off overlap resistance?Based on the H4 chart analysis, we could see the price rise to the sell entry at 12,683.63, which is an overlap resistance that aligns with the 23.6% Fibonacci retracement. From this level, the price could drop towards the take profit.
Stop loss is at 12,724.96, which is an overlap resistance that is slightly below the 50% Fibonacci retracement.
Take profit is at 12,610.36, which acts as a swing low support.
High Risk Investment Warning
Trading Forex/CFDs on margin carries a high level of risk and may not be suitable for all investors. Leverage can work against you.
Stratos Markets Limited (tradu.com ):
CFDs are complex instruments and come with a high risk of losing money rapidly due to leverage. 65% of retail investor accounts lose money when trading CFDs with this provider. You should consider whether you understand how CFDs work and whether you can afford to take the high risk of losing your money.
Stratos Europe Ltd (tradu.com ):
CFDs are complex instruments and come with a high risk of losing money rapidly due to leverage. 66% of retail investor accounts lose money when trading CFDs with this provider. You should consider whether you understand how CFDs work and whether you can afford to take the high risk of losing your money.
Stratos Global LLC (tradu.com ):
Losses can exceed deposits.
Please be advised that the information presented on TradingView is provided to Tradu (‘Company’, ‘we’) by a third-party provider (‘TFA Global Pte Ltd’). Please be reminded that you are solely responsible for the trading decisions on your account. There is a very high degree of risk involved in trading. Any information and/or content is intended entirely for research, educational and informational purposes only and does not constitute investment or consultation advice or investment strategy. The information is not tailored to the investment needs of any specific person and therefore does not involve a consideration of any of the investment objectives, financial situation or needs of any viewer that may receive it. Kindly also note that past performance is not a reliable indicator of future results. Actual results may differ materially from those anticipated in forward-looking or past performance statements. We assume no liability as to the accuracy or completeness of any of the information and/or content provided herein and the Company cannot be held responsible for any omission, mistake nor for any loss or damage including without limitation to any loss of profit which may arise from reliance on any information supplied by TFA Global Pte Ltd.
The speaker(s) is neither an employee, agent nor representative of Tradu and is therefore acting independently. The opinions given are their own, constitute general market commentary, and do not constitute the opinion or advice of Tradu or any form of personal or investment advice. Tradu neither endorses nor guarantees offerings of third-party speakers, nor is Tradu responsible for the content, veracity or opinions of third-party speakers, presenters or participants.
USDOLLAR H4 | Bearish dropUSDOLLAR is rising towards the sell entry which is a pullback resistance that is slightly above the 23.6% Fibonaccic retracement and could drop to the take profit.
Sell entry at 12,725.54, which is a pullback resistance that is slightly above the 23.6% Fibonacci retracement.
Stop loss is at 12,768.05, which is a pullback resistance that lines up with the 50% FIbonacci retracement.
Take profit is at 12,659.26, whic is a pullback support that lines up with the 78.6% Fibonacci retracement.
High Risk Investment Warning
Trading Forex/CFDs on margin carries a high level of risk and may not be suitable for all investors. Leverage can work against you.
Stratos Markets Limited (tradu.com ):
CFDs are complex instruments and come with a high risk of losing money rapidly due to leverage. 65% of retail investor accounts lose money when trading CFDs with this provider. You should consider whether you understand how CFDs work and whether you can afford to take the high risk of losing your money.
Stratos Europe Ltd (tradu.com ):
CFDs are complex instruments and come with a high risk of losing money rapidly due to leverage. 66% of retail investor accounts lose money when trading CFDs with this provider. You should consider whether you understand how CFDs work and whether you can afford to take the high risk of losing your money.
Stratos Global LLC (tradu.com ):
Losses can exceed deposits.
Please be advised that the information presented on TradingView is provided to Tradu (‘Company’, ‘we’) by a third-party provider (‘TFA Global Pte Ltd’). Please be reminded that you are solely responsible for the trading decisions on your account. There is a very high degree of risk involved in trading. Any information and/or content is intended entirely for research, educational and informational purposes only and does not constitute investment or consultation advice or investment strategy. The information is not tailored to the investment needs of any specific person and therefore does not involve a consideration of any of the investment objectives, financial situation or needs of any viewer that may receive it. Kindly also note that past performance is not a reliable indicator of future results. Actual results may differ materially from those anticipated in forward-looking or past performance statements. We assume no liability as to the accuracy or completeness of any of the information and/or content provided herein and the Company cannot be held responsible for any omission, mistake nor for any loss or damage including without limitation to any loss of profit which may arise from reliance on any information supplied by TFA Global Pte Ltd.
The speaker(s) is neither an employee, agent nor representative of Tradu and is therefore acting independently. The opinions given are their own, constitute general market commentary, and do not constitute the opinion or advice of Tradu or any form of personal or investment advice. Tradu neither endorses nor guarantees offerings of third-party speakers, nor is Tradu responsible for the content, veracity or opinions of third-party speakers, presenters or participants.


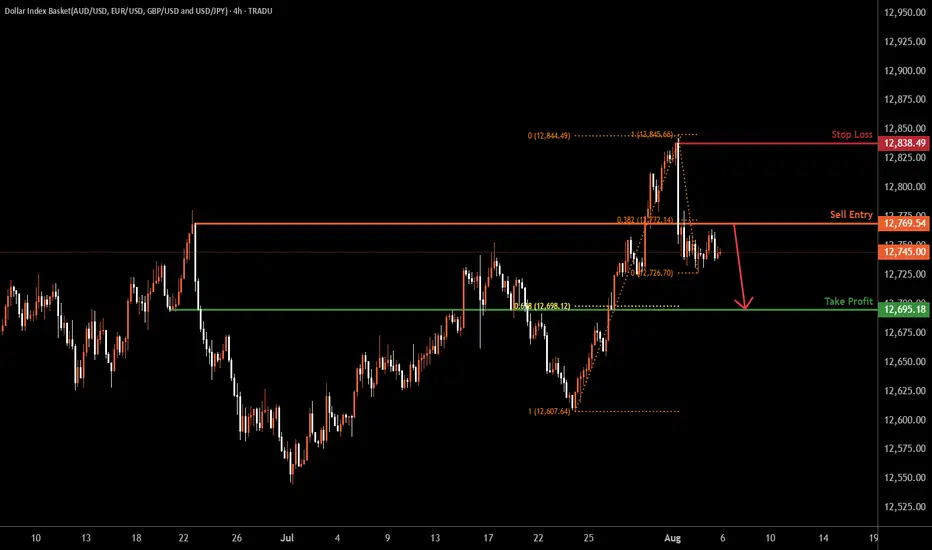
USDOLLA H4 | Bearish dropBased on the H4 chart analysis, we can see the price rise to the sell entry which is a pullback resistance and could drop from this level to the take profit.
Sell entry is at 12,769.54, which is a pullback resistance that lines up with the 38.2% Fibonacci retracement.
Stop loss is at 12,838,49, which is a swing high resistance.
Take profit is at 12,695.18, which is a pullback support that aligns with the 61.8% Fibonacci retracement.
High Risk Investment Warning
Trading Forex/CFDs on margin carries a high level of risk and may not be suitable for all investors. Leverage can work against you.
Stratos Markets Limited (tradu.com ):
CFDs are complex instruments and come with a high risk of losing money rapidly due to leverage. 65% of retail investor accounts lose money when trading CFDs with this provider. You should consider whether you understand how CFDs work and whether you can afford to take the high risk of losing your money.
Stratos Europe Ltd (tradu.com ):
CFDs are complex instruments and come with a high risk of losing money rapidly due to leverage. 66% of retail investor accounts lose money when trading CFDs with this provider. You should consider whether you understand how CFDs work and whether you can afford to take the high risk of losing your money.
Stratos Global LLC (tradu.com ):
Losses can exceed deposits.
Please be advised that the information presented on TradingView is provided to Tradu (‘Company’, ‘we’) by a third-party provider (‘TFA Global Pte Ltd’). Please be reminded that you are solely responsible for the trading decisions on your account. There is a very high degree of risk involved in trading. Any information and/or content is intended entirely for research, educational and informational purposes only and does not constitute investment or consultation advice or investment strategy. The information is not tailored to the investment needs of any specific person and therefore does not involve a consideration of any of the investment objectives, financial situation or needs of any viewer that may receive it. Kindly also note that past performance is not a reliable indicator of future results. Actual results may differ materially from those anticipated in forward-looking or past performance statements. We assume no liability as to the accuracy or completeness of any of the information and/or content provided herein and the Company cannot be held responsible for any omission, mistake nor for any loss or damage including without limitation to any loss of profit which may arise from reliance on any information supplied by TFA Global Pte Ltd.
The speaker(s) is neither an employee, agent nor representative of Tradu and is therefore acting independently. The opinions given are their own, constitute general market commentary, and do not constitute the opinion or advice of Tradu or any form of personal or investment advice. Tradu neither endorses nor guarantees offerings of third-party speakers, nor is Tradu responsible for the content, veracity or opinions of third-party speakers, presenters or participants.
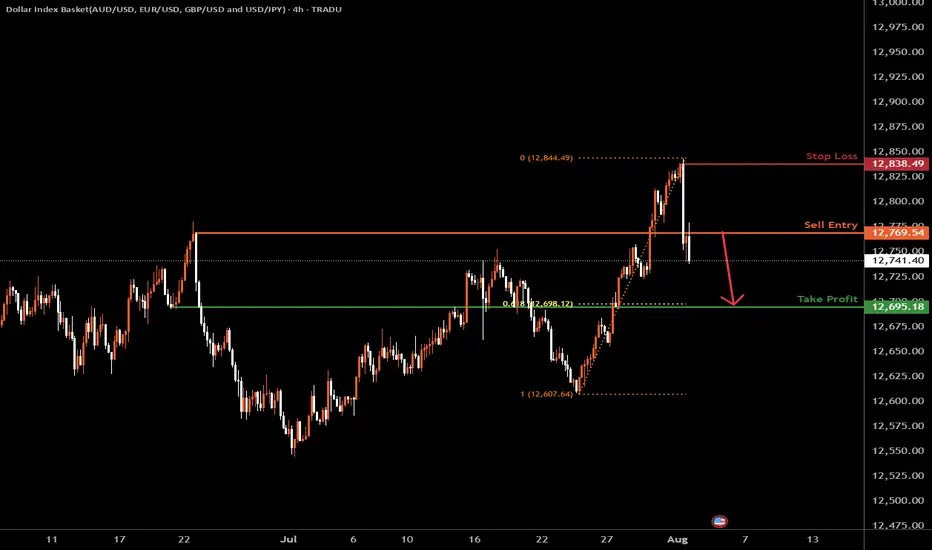
USDOLLAR H4 | Bearish dropBased on the H4 chart analysis, we could see the price drop lower from the sell entry, which is a pullback resistance and could drop to the downside.
Sell entry is at 12,769.54, which is a pullback resistance.
Stop loss is at 12,834.49, which is at 12,695.18, which is a pullback resistance.
Take profit is at 12,695.18, which is a pullback support that aligns with the 61.8% Fibonacci retracement.
High Risk Investment Warning
Trading Forex/CFDs on margin carries a high level of risk and may not be suitable for all investors. Leverage can work against you.
Stratos Markets Limited (tradu.com ):
CFDs are complex instruments and come with a high risk of losing money rapidly due to leverage. 65% of retail investor accounts lose money when trading CFDs with this provider. You should consider whether you understand how CFDs work and whether you can afford to take the high risk of losing your money.
Stratos Europe Ltd (tradu.com ):
CFDs are complex instruments and come with a high risk of losing money rapidly due to leverage. 66% of retail investor accounts lose money when trading CFDs with this provider. You should consider whether you understand how CFDs work and whether you can afford to take the high risk of losing your money.
Stratos Global LLC (tradu.com ):
Losses can exceed deposits.
Please be advised that the information presented on TradingView is provided to Tradu (‘Company’, ‘we’) by a third-party provider (‘TFA Global Pte Ltd’). Please be reminded that you are solely responsible for the trading decisions on your account. There is a very high degree of risk involved in trading. Any information and/or content is intended entirely for research, educational and informational purposes only and does not constitute investment or consultation advice or investment strategy. The information is not tailored to the investment needs of any specific person and therefore does not involve a consideration of any of the investment objectives, financial situation or needs of any viewer that may receive it. Kindly also note that past performance is not a reliable indicator of future results. Actual results may differ materially from those anticipated in forward-looking or past performance statements. We assume no liability as to the accuracy or completeness of any of the information and/or content provided herein and the Company cannot be held responsible for any omission, mistake nor for any loss or damage including without limitation to any loss of profit which may arise from reliance on any information supplied by TFA Global Pte Ltd.
The speaker(s) is neither an employee, agent nor representative of Tradu and is therefore acting independently. The opinions given are their own, constitute general market commentary, and do not constitute the opinion or advice of Tradu or any form of personal or investment advice. Tradu neither endorses nor guarantees offerings of third-party speakers, nor is Tradu responsible for the content, veracity or opinions of third-party speakers, presenters or participants.
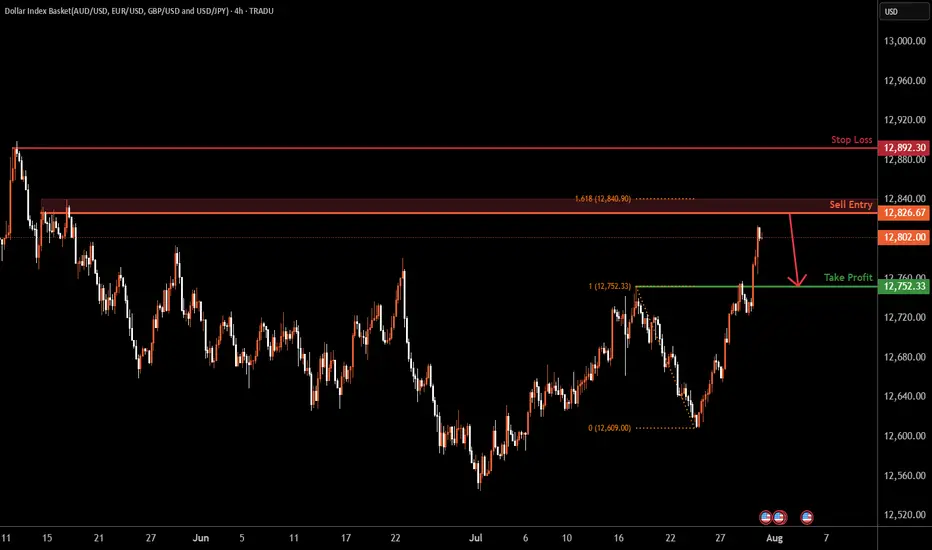
USDOLLAR H4 | Bearish reversalBased on H4 chart analysis, we can see the price rising towards the sell entry at 12,826.67, which is a swing high resistance.
Stop loss is at 12,892.30, which is a swing high resistance.
Our take profit will be at 12,752.33, which is a pullback support.
High Risk Investment Warning
Trading Forex/CFDs on margin carries a high level of risk and may not be suitable for all investors. Leverage can work against you.
Stratos Markets Limited (tradu.com ):
CFDs are complex instruments and come with a high risk of losing money rapidly due to leverage. 65% of retail investor accounts lose money when trading CFDs with this provider. You should consider whether you understand how CFDs work and whether you can afford to take the high risk of losing your money.
Stratos Europe Ltd (tradu.com ):
CFDs are complex instruments and come with a high risk of losing money rapidly due to leverage. 66% of retail investor accounts lose money when trading CFDs with this provider. You should consider whether you understand how CFDs work and whether you can afford to take the high risk of losing your money.
Stratos Global LLC (tradu.com ):
Losses can exceed deposits.
Please be advised that the information presented on TradingView is provided to Tradu (‘Company’, ‘we’) by a third-party provider (‘TFA Global Pte Ltd’). Please be reminded that you are solely responsible for the trading decisions on your account. There is a very high degree of risk involved in trading. Any information and/or content is intended entirely for research, educational and informational purposes only and does not constitute investment or consultation advice or investment strategy. The information is not tailored to the investment needs of any specific person and therefore does not involve a consideration of any of the investment objectives, financial situation or needs of any viewer that may receive it. Kindly also note that past performance is not a reliable indicator of future results. Actual results may differ materially from those anticipated in forward-looking or past performance statements. We assume no liability as to the accuracy or completeness of any of the information and/or content provided herein and the Company cannot be held responsible for any omission, mistake nor for any loss or damage including without limitation to any loss of profit which may arise from reliance on any information supplied by TFA Global Pte Ltd.
The speaker(s) is neither an employee, agent nor representative of Tradu and is therefore acting independently. The opinions given are their own, constitute general market commentary, and do not constitute the opinion or advice of Tradu or any form of personal or investment advice. Tradu neither endorses nor guarantees offerings of third-party speakers, nor is Tradu responsible for the content, veracity or opinions of third-party speakers, presenters or participants.
DXY DOLLAONLY looking for bullish price action..
we already have a plan paitence wins the race as per 😃

USDOLLARGrounds are ready to sell USD Uh further 12 600 That's why I have posted idea to buy Euro USD pattern is same need to follow the pattern.

USD finna DROP like Crazy!!Since we have clearly rejected this resistance area, there will likely be more downward movement for the USD. search for BUYS ON EURUSD. GBPUSD. ETC..
bullish isea pf EURCHFI'm using support and resistance and the market shift structure and Order blocks and handle shoulder and the Candlestick confirmation to confirm if that the price have probability to go higher from my support

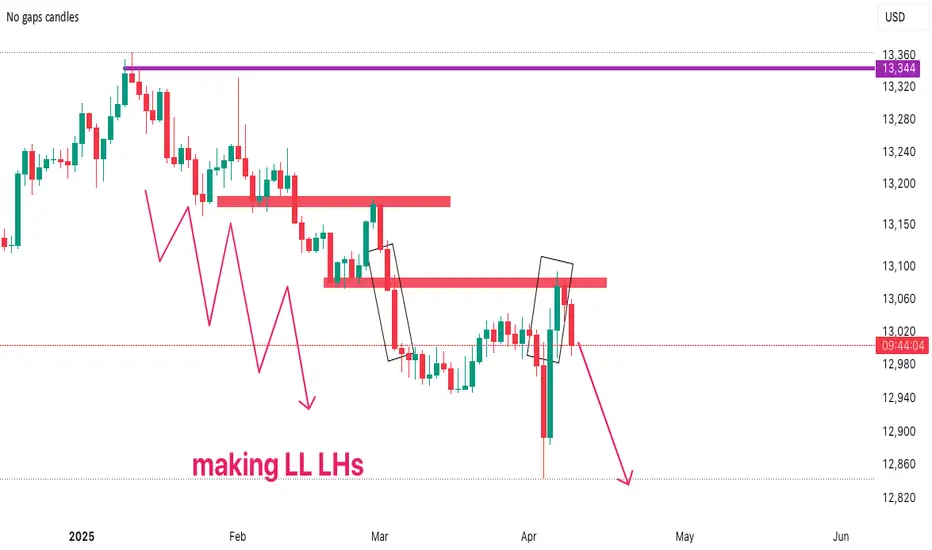
usdollarUS Dollar made a cup handle. It is currently retesting this area. It may reach the points I marked.

Dollar Index(DXY) Rebounds from Key Support–Is a New High Cominghello guys.
Let's see what happened for us index and what will happen:
Uptrend Support:
The price has been respecting a long-term ascending trendline since 2011, indicating a strong bullish structure.
Recent price action suggests that the index retested this trendline and bounced off it.
Key Resistance & Breakout Potential:
The index is in a consolidation phase after reaching a local high.
If the price holds above the trendline and breaks the previous high (~13,250-13,400), it could trigger further upside movement.
The next potential target is near 13,500-13,800 based on historical price action and Fibonacci extensions.
-------------------------------------------------
Possible Scenario:
Bullish Case: If the price holds above the trendline and breaks the current range resistance, it could continue toward new highs.
Bearish Case: A breakdown below the 12,800 support level could lead to a deeper correction toward 12,400-12,000.
-------------------------------------------------
Consequences of This Move:
For USD Strength:
A bullish continuation in the Dollar Index means a stronger USD, which could negatively impact commodities (gold, oil) and emerging market currencies.
Forex pairs like EUR/USD and GBP/USD could decline as the USD gains strength.
For Global Markets:
A weaker DXY (if the support breaks) would typically support equity markets and commodities like gold and Bitcoin, as a weaker dollar makes them more attractive.
-------------------------------------------------
Conclusion:
The chart suggests bullish momentum, but confirmation is needed with a breakout above 13,250-13,400.
As long as the price respects the trendline and Fibonacci support, the uptrend remains intact.
Keep an eye on macroeconomic events (e.g., Fed rate decisions, inflation data), as they can impact this movement significantly.

