Trade ideas

USDOLLAR extremely oversoldWhatever timeframe you look at the USDOLLAR is oversold. Take small long position and add when getting confirmation.

US DOLLAR BUY ANALYSIS US DOLLAR IS AT A 2 YEAR LOW. THE TECHNICAL ANALYSIS IS SHOWING A REVERSAL INTO THE UP SIDE. BUY US DOLLAR
USDOLLAR Bullish insightThe USDOLLAR can find strength this week as the bearish move has been over-extended now. If we see the 4H creating Bullish Structure, that will push the Buyers in and we can see a domino effect on all the above time frames like the Daily and the Weekly.


US Dollar Index outlook for the Week.Even though the outlook is Bearish on the Dollar Index, it is at a tested Liquidity zone. We can expect the Dollar Index to either move down, break the strong Demand zone and continue it's downwards trend. Or, break the recent Lower High and move upwards to the Supply zone where we had seen many previous rejections.

Time to buy USDOLLAR Index!It might continue downward few candles more But the vertical line shows a good time to buy !

US dollar Possibly a long movement due to ending the corrective move beginning of impulsive move towards north.

USDOLLAR on very strong support zoneUSDOLLAR on very strong support zone and missing information of head and shoulder look like. 1.2205 can be support zone for day trade if more fall. And we might see USDOLLAR for bull soon.

DOW JONES do not give up!keep on looking for buys on this pair. On lower time frame watch for price action for you to buy
USDOLLAR Crash?USD is about to reach its worst state in 2020 earlier this year.. Now price is at a key support area, if support not holding, we can see USD crash to the next low.
My bias is that USD will continue to go down to the previous low. Buyers are buying DXY to show rejection but betting on something with live economy contradicting the market is just gambling.
With the current state in US, I'm short bias.
*Please note that I am no professional trader, like most of you people. I am still learning and know that trading is only a possibility game. My analysis does not mean it is a signal for entry. If you would like to enter with my analysis, please see if it matches with your analysis & thoughts. I will not be liable for any losses incurred :D *

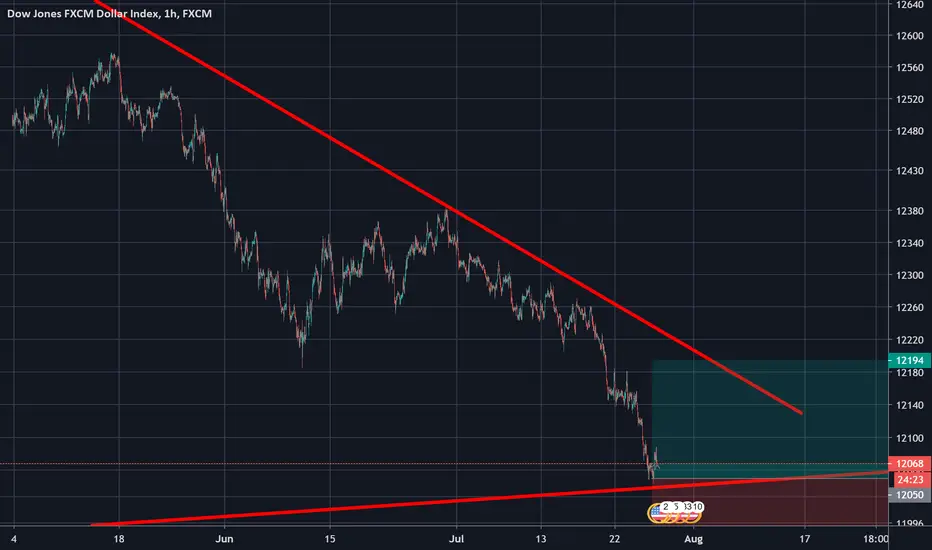
USDOLLAR SHORTSupport level did not hold resulting in a breakout for the USD, USD weakening, we are usually looking to LONG ***USD pairs and SHORT USD*** pairs.
*Please note that I am no professional trader, like most of you people. I am still learning and know that trading is only a possibility game. My analysis does not mean it is a signal for entry. If you would like to enter with my analysis, please see if it matches with your analysis & thoughts. I will not be liable for any losses incurred :D *

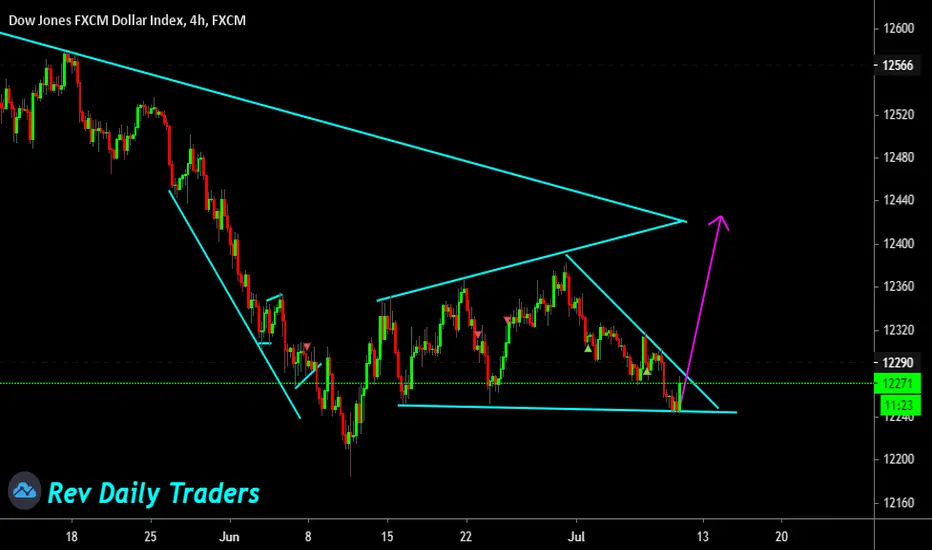
USDollar Analysis Break And RetestAlthough the higher timeframe bias is short.
I still go for long,, for the shorter time frame bias.
If USDollar is bullish, then GBPUSD will trend down
and if the USDollar is bearish, then GBPUSD will continue its main trend (up trend)
this analysis is for the confluence of my first analysis

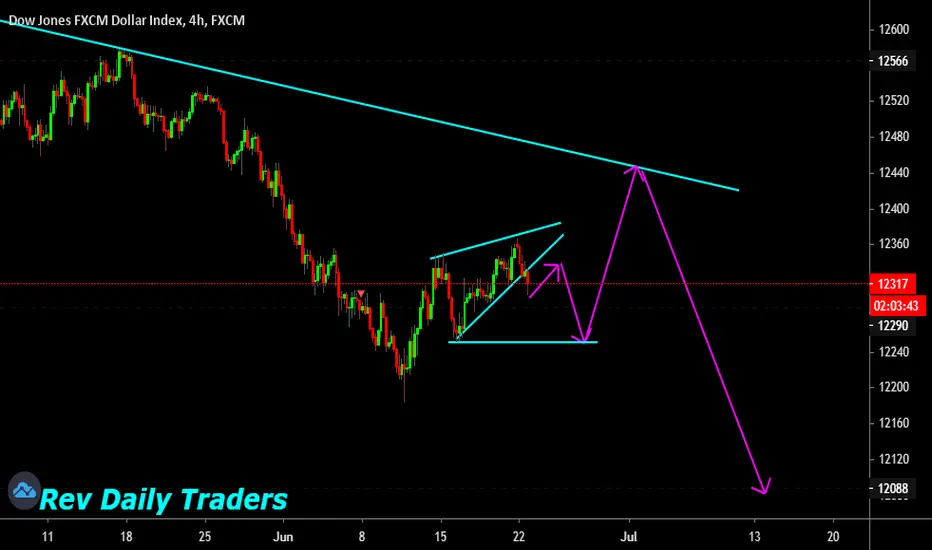
DOW JONES buying zone 1229?on lower time frame we will look for one more down wave to go and test 1229, on that price look for bounce setups to buy

USDOLLAR LONGWe can potentially see an upside for the dollar as it made a new high, and retested trendline. Currently, I am biased towards buying the dollar hoping it to reach previous support resistance, before coming back down for a trendline retest.
I will not be excited for longing it now. What I really want to see is a retracement after resistance to the trendline and take a long position as it offers a higher probability with a good risk-reward ratio. However, this is in the daily timeframe, any chances to the market condition may cause my analysis to be inaccurate. This perfect setup can be easily voided if news/economy does not go as planned so please take it with a pinch of salt, this trade can be invalid any point of time.
*Please note that I am no professional trader, like most of you people. I am still learning and know that trading is only a possibility game. My analysis does not mean it is a signal for entry. If you would like to enter with my analysis, please see if it matches with your analysis & thoughts. I will not be liable for any losses incurred :D *

US Dollar breakoutIs that a breakout or what, like I said put an eye on the chart and an ear on the fundamentals.
Manage your trades!!!

Time to go short USDollar Index or Buy EUR/USDIt might continue upward few candles more but uptrend is done and it is time to go short!

USDOLLAR Rallies In Longer-Term DowntrendThe above charts show FXCM's USD index - the USDOLLAR. The left chart shows the daily time frame. It is evident that the current trend remains down, until proven otherwise.
1. Price is below the cloud.
2. The cloud remains light pink in colour.
3. Price is below the black base line.
4. The black base line is trending down.
5. The orange lagging span is comfortably below price.
The right chart shows the H1 ichimoku of the USDOLLAR. The index has pulled back in the shorter term.
1. Price is approaching pink cloud resistance.
2. Price is above the black base line.
3. The black base line continues to move downwards.
4. The orange lagging span is at price.
The pullback is largely driven by fear creeping back into the market following comments by White House health advisor Dr Anthony Fauci noting that some US states are seeing a “disturbing surge” in coronavirus infections. Cases have increased by 5% or more in 26 states and hospitalisations are rising too.
To this end, we are closely watching the H1 ichimoku for any bearishness, which will realign the short-term chart with the daily. If this does not happen, the prospect of economic disarray cannot be ignored as the possibility and impact of a second wave is considered by market participants.
Past performance is not an indicator of future results
CHART SOURCE: FXCM MARKETSCOPE 2.0

DOW JONES setting for shortcheck on lower time frame to start to sell, at the moment we have that building correction that needs to give us down wave, how you can trade this sell breakout or start from roof on lower time frame to sell
we looking to sell, we will ignore buys

US DOLLAR IdeaBig broadening wedge forming
Hopefully the recent drops acts as a double bottom and pushes price back up into the wedge
The recent touch of the fib transition line suggests the action through it will be bOOlish