DOGECOIN - great setup w/ the use of a SL
We reached support with strong bullish divergences on the daily.
🚨 Use a SL if you feel the urge to step before the bearish trend is broken.
Trade ideas


$DOGE 10X now?Current pattern showing similar to 25th January 2021 from 1st resistance to next leg up was 10 weekly candles. See blue circle highlight.
We are currently at 10 weekly candles and showing great support similar to early 2021.
In 2021 it 10 x in 4 weeks, possible to happen starting now!
CHECKOUT my work for doge back in 2020

✳️ Dogecoin Set To Grow vs BitcoinWe are bullish on the DOGEUSDT pair but we are also seeing a potential recovery on the Dogecoin vs Bitcoin (DOGEBTC) pair...
Do you remember this trade idea from late November 2022?
✳️ Dogecoin vs Bitcoin | Correction & New Bullish Wave Target 200%+
What we see on this chart is a classic ABC correction based on Elliot Wave Theory.
After a bullish wave there is always a correction, this is normal...
After the correction we see a resumption of the initial move which in this case means additional growth.
Since we have a lower high, we expect to hit a higher high on the next jump.
In case things change, the blue space is the stop-loss.
Any trading above this level, 0.000004, and our bullish bias stays valid.
Thank you for reading and for your continued support.
Namaste.

Dogecoin vs Bitcoin | Correction & New Bullish Wave Target 200%+Dogecoin vs Bitcoin (DOGEBTC) is now in correction mode... This is good because after the correction comes a new high.
This is looking like a classic ABC correction, clearly marked/depicted on the chart.
If this correction ends at 0.00000400, we should see around 0.00001200 as the next bullish target.
Remember to do your own research.
Learn the basics of trading.
Manage your risk.
Have a plan beforehand.
You make your own decisions, you do your own clicking, you are reponsible for your own actions, etc. The legal stuff.
Patience is key.
Namaste.

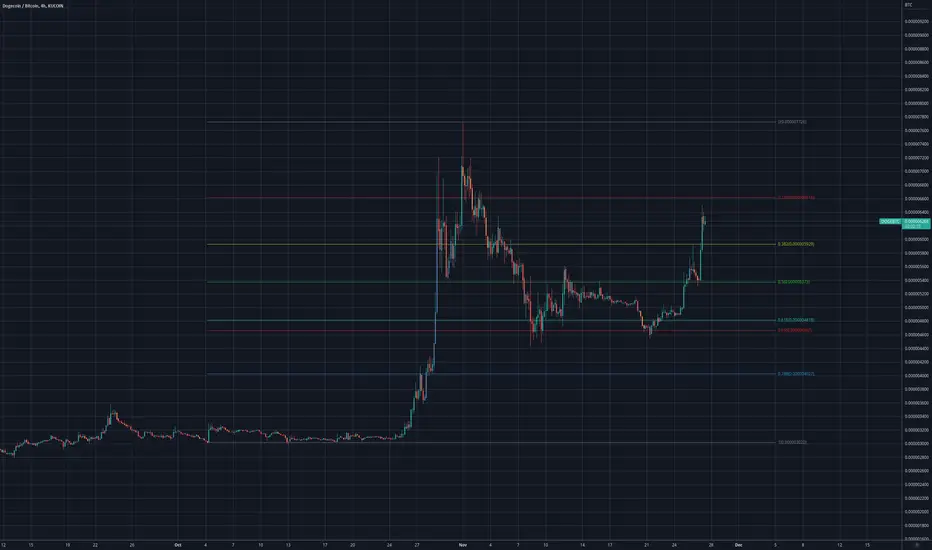
DOGE/BTC 4h FIB is perfect fitI like when a nice window of time fits in a FIB perfectly.
DOGE/BTC is looking good this moment.
Watching for a 0.382 or 0.5 FIB bounce with positive upward indicators.
Doge will test ATHJust look at this beautiful new weekly candle. After the correction we saw a strong buying power which pushed Doge above 500 Sats.
Doge looks very strong, and will go and test it's ATH point.

111% Coming Soon! Don't escape to be rich :)Pattern : Descending Wedge
Target: 0.00001
Time: In 7 days


BIG RESISTANCEI think that's the next bigger resistance can be this zone where we can find several HTF Level, like the Down move's VAH, a Monthly level, + a Daily OB+ the 0.618 fib level.

DOGE/BTC is breaking up mid level of downtrend channelBINANCE:DOGEBTC moves wonderingly completely different from the BINANCE:DOGEUSD chart.
It shows early signs of recovery. But it is certainly needs to continue the observation. Zoom in the chart to understand the movement.
For the study purpose only, not a financial advice.

DOGE will give birth to an Elephant...As you can see in the chart there is a huge bullish divergence in DOGE/BTC pair..
and yes it is carrying an Elephant in its womb..so it will take time..
if it plays out the move will be massive..
Have some patience.

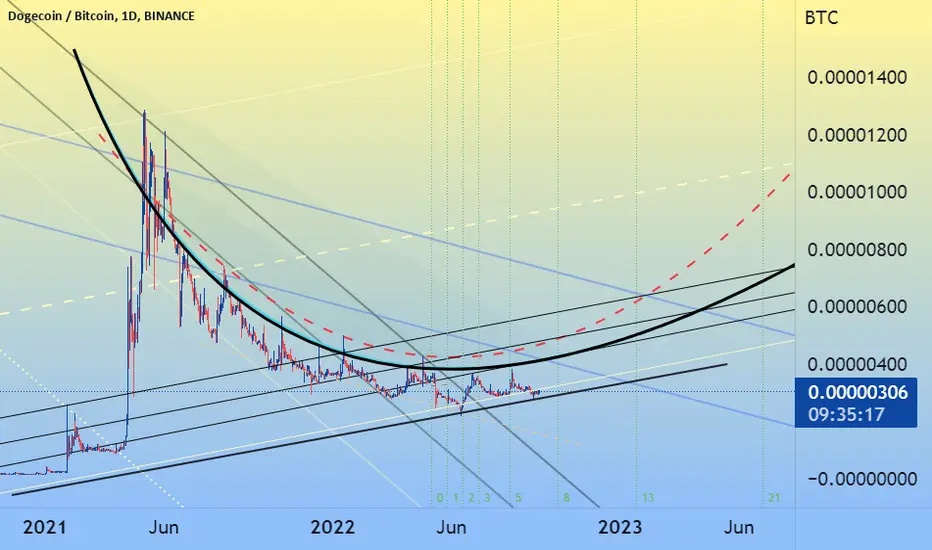
DOGEBTCDOGEBTC averagely will follow the black curve while some peaks(surges) will get to the red hatch line curve.------------------------------------------------------------------------------------------------------------------------------------------------------------------------------------------------------------------------------------------------------------------------------------------------
Shift in momentum, Dogecoin * FOR THE RECORD, I OWN 2.75Ɖ *
Dogecoin has been slowly chipping away at its Bitcoin ‘dominance’ for over a year — a losing battle of course — Bitcoin has always been the King of the crypto market. This “chipping away” has been happening at a relatively steady pace since it’s peak in relative strength in May, 2021. This chart clearly shows that shift in momentum, and dominance.
But why?
As economies go, the DOGE economy is no different — there are many factors involved in its ebbs and flows. I’d like to list off a few reasons that may possibly explain the shift we’re witnessing on this chart.
Interesting Note:
This smooth steady shift in momentum might suggest an inverse correlation between the two.
Momentum Shift, Why?
Sentiment: The Dogecoin movement has an energy unlike any other. In 2021, we saw the brunt of how powerful that sentiment can be. This energy has since gone from a roaring boil, down to a simmer — with many supporters realizing that Dogecoin is not just about making money — it is money.
Bitcoin’s sentiment has gone from bad to worse, with institutional investors realizing the “Store of Value” mantra was somewhat of a façade. Bitcoin, like all other cryptocurrencies, is a hedge against centralized corruption and poor reserve management. It will mot retain it’s value from purchase to sale. Furthermore, Bitcoin is inflationary until the last Bitcoin is mined in the year 2140.
Marketing: Coins cannot pay for their own marketing, that’s a nonsensical idea. It’s also clear that they shouldn’t even if they could — coins are only medium of exchange.
However, there are quasi ‘brands’ associated with each respective coin, brought on by the crowd they attract. For Bitcoin, the brand is anarchistic capitalism, while Dogecoin has become more geared toward humility. Surely we can see why these two coins are inversely correlated to some degree — their cultures contrast in many ways.
Upgrades: While this topic is too long to cover completely, one point to note is that Dogecoin developers have recently published “libdogecoin” which has catapulted development in the periphery of the flagship Dogecoin Core software. This advancement might be what we’re seeing with the most recent “curling up” of the Dogecoin’s relative strength.
MyDoge Mobile Wallet: This has been huge for Dogecoin over the past 6 months. This Dogecoin wallet has a very simple, with a innovative design that has caught the interest of thousands of users. The mobile app has made Dogecoin accessible to everyday folk who may have not had the technical expertise to use the Dogecoin Core wallet. We can imagine that this self-custodial wallet is slowly becoming discovered in the App stores, and being used increasingly for the purposes of commerce and interpersonal exchange.
It’s not hard to tell that Dogecoin has really grown up over the last year, and needless to say it seems to be helping it relative strength against Bitcoin. On a final note, this isn’t written in distaste for Bitcoin, I’ve only just grown to understand that Dogecoin is a stronger candidate than many people realize.

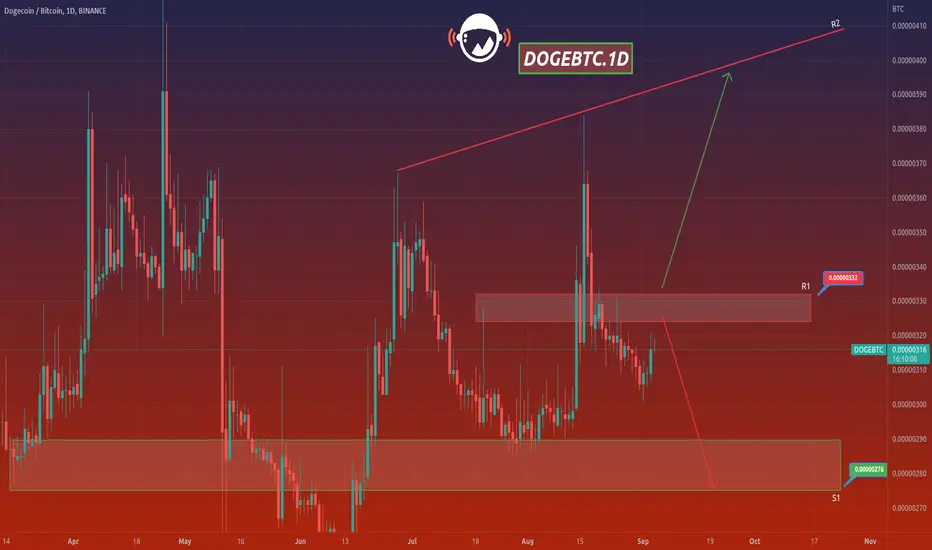
DOGEBTCHello Crypto Lovers,
Mars Signals team wishes you high profits.
This is a one-day-time frame analysis for DOGEBTC
Here you observe that R2 and R1 are our resistance areas and both contain the unsuccessful triumphs of the price to rise. And S1 is the support line in which the well support of the price since the past is clear. At the moment, we have the fluctuation of price below R1 and we must wait for some confirmation candles to make sure whether the price will have a rising or falling trend. Either the price will give us some rising signs, and therefore we predict an increase to R2. Or it may happen that the price loses the support here and a decline is waiting for it toward S1.
Warning: This is just a suggestion and we do not guarantee profits. We advise you to analyze the chart before opening any positions.
Wish you luck

900% Coming Soon - Buy or Stay Poor :)Target: 0.000024
Pattern: Cup and Handle
Time: In 3 months. End of year.
Profit: 900%

Falling Wedge & Inverse Head & Shoulders on Dogecoin/BTC WeeklyI've just today transferred my winning from ETC into Doge to hopefully ride this pattern upward. I think Doge has a good uptrend ahead of itself

Gaining a deeper understanding of Wave Theory Pt. 5Going deep into the weeds of elliot wave theory and how it will apply to the coming price action
in doge usd, doge btc, and litecoin.

Gaining a deeper understanding of Wave TheoryGoing deep into the weeds of elliot wave theory and how it will apply to the coming price action
in doge usd, doge btc, and litecoin.

Gaining a deeper understanding of Wave TheoryGoing deep into the weeds of elliot wave theory and how it will apply to the coming price action
in doge usd, doge btc, and litecoin.
