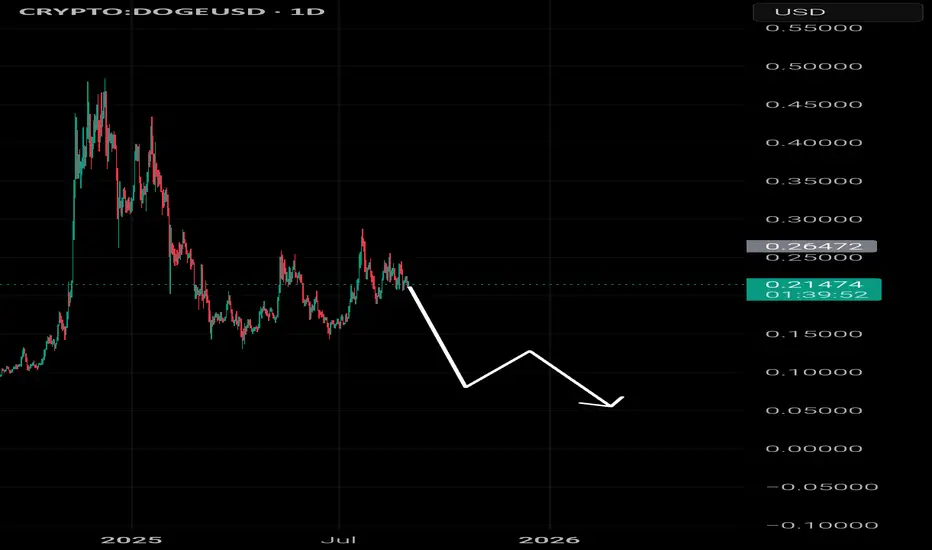
DOGEUSD H4 | Bearish momentum likely to extendBased on the H4 chart analysis, we can see that the price has rejected off the sell entry, which is a pullback resistance and could drop from this level to the downside.
Sell entry is at 0.22393, which is a pullback resistance.
Stop loss is at 0.23810, which is a pullback resistance that lines up with the 161.8% Fibonacci extension.
Take profit is at 0.19542, which is a swing low support that aligns with the 138.2% Fibonacci extension.
High Risk Investment Warning
Trading Forex/CFDs on margin carries a high level of risk and may not be suitable for all investors. Leverage can work against you.
Stratos Markets Limited (thttps://tradu.com/uk ):
CFDs are complex instruments and come with a high risk of losing money rapidly due to leverage. 65% of retail investor accounts lose money when trading CFDs with this provider. You should consider whether you understand how CFDs work and whether you can afford to take the high risk of losing your money.
Stratos Europe Ltd (tradu.com ):
CFDs are complex instruments and come with a high risk of losing money rapidly due to leverage. 66% of retail investor accounts lose money when trading CFDs with this provider. You should consider whether you understand how CFDs work and whether you can afford to take the high risk of losing your money.
Stratos Global LLC (tradu.com ):
Losses can exceed deposits.
Please be advised that the information presented on TradingView is provided to Tradu (‘Company’, ‘we’) by a third-party provider (‘TFA Global Pte Ltd’). Please be reminded that you are solely responsible for the trading decisions on your account. There is a very high degree of risk involved in trading. Any information and/or content is intended entirely for research, educational and informational purposes only and does not constitute investment or consultation advice or investment strategy. The information is not tailored to the investment needs of any specific person and therefore does not involve a consideration of any of the investment objectives, financial situation or needs of any viewer that may receive it. Kindly also note that past performance is not a reliable indicator of future results. Actual results may differ materially from those anticipated in forward-looking or past performance statements. We assume no liability as to the accuracy or completeness of any of the information and/or content provided herein and the Company cannot be held responsible for any omission, mistake nor for any loss or damage including without limitation to any loss of profit which may arise from reliance on any information supplied by TFA Global Pte Ltd.
The speaker(s) is neither an employee, agent nor representative of Tradu and is therefore acting independently. The opinions given are their own, constitute general market commentary, and do not constitute the opinion or advice of Tradu or any form of personal or investment advice. Tradu neither endorses nor guarantees offerings of third-party speakers, nor is Tradu responsible for the content, veracity or opinions of third-party speakers, presenters or participants.
DOGESOL_8UWRLS.USD trade ideas

DOGE: Multi-Year ConsolidationWhat we're looking at here is a high-timeframe logarithmic chart of Dogecoin, showing a massive ascending triangle/wedge structure that has been forming since as far back as 2014. On the log scale, this pattern becomes incredibly clear and highlights the consistent, long-term support line that has held through multiple market cycles. This isn't just a pattern; it's a story of accumulation and consolidation playing out over nearly a decade.
The Anatomy of the Trade: Fractals and the Ultimate Bear Trap
The structure of this chart is built on fractals. Notice how smaller triangle consolidations have repeatedly resolved to the upside, each breakout creating the foundation for the next, larger pattern. We are now in the final stages of the largest consolidation pattern, with price coiling tightly near the apex. This is the "calm before the storm," where maximum energy is being stored for an explosive move.
The ultimate setup here is a potential generational bear trap.
The Lure: A sharp, decisive dip below the multi-year logarithmic support trendline. This would be the signal many bears have been waiting for, a technical confirmation that the structure has failed, leading to mass selling and short positions.
The Trap: Instead of a continued meltdown, price action would see a violent reversal and reclaim the support line. This move would trap all the late shorts, triggering a massive squeeze.
The Launch: This squeeze would provide the rocket fuel necessary to break through the final overhead resistance of the triangle, likely sending DOGE into a new phase of parabolic price discovery.
The key takeaway is that while a breakdown could look terrifying, it might be the very catalyst needed for the next major bull run. For long-term bulls, any dip below this long-standing support—if it is quickly reclaimed—could represent a historic buying opportunity. Manage your risk accordingly.

DOGEUSD Last Drop Before Rally to ATHFirst week of September will be a manipulation move. And then 5 consecutive week rally to finish the current cycle. Let's see! :D


Dogecoin - The all time high will follow!🎁Dogecoin ( CRYPTO:DOGEUSD ) prepares new all time highs:
🔎Analysis summary:
Dogecoin has been creating bullish cycles for the past decade. Following these cycles, it is quite likely that Dogecoin will break the previous all time high soon. And with the recent bullish break and retest, bulls are picking up momentum for the next bullish cycle to continue.
📝Levels to watch:
$0.4
SwingTraderPhil
SwingTrading.Simplified. | Investing.Simplified. | #LONGTERMVISION

DOGEUSD H4 | Bullish bounce setupBased on the H4 chart analysis, we could see the price fall to the buy entry, which acts as a swing low support that aligns with the 138.2% Fibonacci extension and the 78.6% Fibonacci projection, and could bounce from this level to the upside.
Buy entry is at 0.19534, which is a swing low support that aligns with the 138.2% Fibonacci extension and the 78.6% Fibonacci projection.
Stop loss is at 0.18787, which is a swing low support that lines up with the 100% Fibonacci projection.
Take profit is at 0.22404, which is a pullback resistance.
High Risk Investment Warning
Trading Forex/CFDs on margin carries a high level of risk and may not be suitable for all investors. Leverage can work against you.
Stratos Markets Limited (tradu.com ):
CFDs are complex instruments and come with a high risk of losing money rapidly due to leverage. 65% of retail investor accounts lose money when trading CFDs with this provider. You should consider whether you understand how CFDs work and whether you can afford to take the high risk of losing your money.
Stratos Europe Ltd (tradu.com ):
CFDs are complex instruments and come with a high risk of losing money rapidly due to leverage. 66% of retail investor accounts lose money when trading CFDs with this provider. You should consider whether you understand how CFDs work and whether you can afford to take the high risk of losing your money.
Stratos Global LLC (tradu.com ):
Losses can exceed deposits.
Please be advised that the information presented on TradingView is provided to Tradu (‘Company’, ‘we’) by a third-party provider (‘TFA Global Pte Ltd’). Please be reminded that you are solely responsible for the trading decisions on your account. There is a very high degree of risk involved in trading. Any information and/or content is intended entirely for research, educational and informational purposes only and does not constitute investment or consultation advice or investment strategy. The information is not tailored to the investment needs of any specific person and therefore does not involve a consideration of any of the investment objectives, financial situation or needs of any viewer that may receive it. Kindly also note that past performance is not a reliable indicator of future results. Actual results may differ materially from those anticipated in forward-looking or past performance statements. We assume no liability as to the accuracy or completeness of any of the information and/or content provided herein and the Company cannot be held responsible for any omission, mistake nor for any loss or damage including without limitation to any loss of profit which may arise from reliance on any information supplied by TFA Global Pte Ltd.
The speaker(s) is neither an employee, agent nor representative of Tradu and is therefore acting independently. The opinions given are their own, constitute general market commentary, and do not constitute the opinion or advice of Tradu or any form of personal or investment advice. Tradu neither endorses nor guarantees offerings of third-party speakers, nor is Tradu responsible for the content, veracity or opinions of third-party speakers, presenters or participants.

Strong sale Dogecoin .
Warning: A major collapse is imminent. Cryptocurrencies are losing their strength. They're forcing you to buy. Then you'll see a bloody collapse. They'll make you lose your money.
This is not financial advice.
Do your own research

DOGEUSD HIGH PROBABILITY SETUP SOON!!🚨 DOGEUSD HIGH PROBABILITY BUY SETUP 🚨
* Here We Can See Clearly The Next Potential Moves For DODGECOIN Coming Hours/Days.
* Keep Your Eyes Close On Your Trading Positions.
* Happy PIP Hunting Traders.
£ FXKILLA £

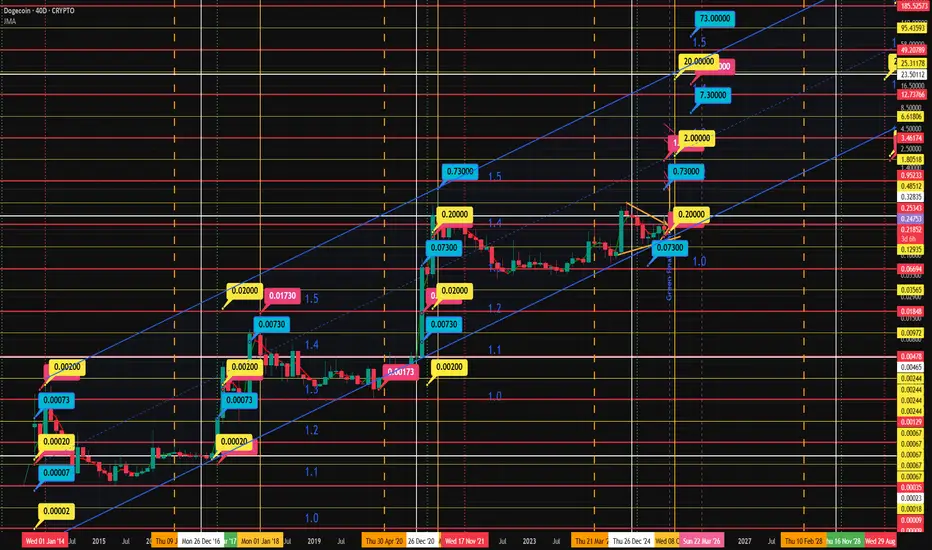
Dogecoin may be following a natural law of compounding cycles — Group Values Average Rounded Match?
1 0.00002, 0.00020, 0.00200 0.00074 0.00073 ✅
2 0.00020, 0.00200, 0.02000 0.0074 0.0073 ✅
3 0.00200, 0.02000, 0.20000 0.074 0.073 ✅
4 0.02000, 0.20000, 2.00000 0.74 0.73 ✅
5 0.20000, 2.00000, 20.00000 7.4 7.3 ✅
🔺 The Divine Law of "7.3"
Every time three yellow-highlighted price points (key bubbles) are added together and divided by 3, the result is eerily close to 7.3 — or its exponential echoes: 0.73, 73, or 7.30.
It's not coincidence.
It's not random.
It's a harmonic constant.
Each of these yellow price tags marks a critical inflection point — moments of explosive growth or stark reversals. Yet they all gravitate back to this numerical anchor, suggesting Dogecoin’s price path may be orbiting a gravitational field of mathematical resonance.
🤯 Final Revelation:
The averages of every 3 consecutive yellow bubbles form a perfect exponential alignment with the 7.3 family:
0.00073
0.0073
0.073
0.73
7.3
73
🧠 Mind-Bending Takeaway:
What if this chart isn’t just showing price...
But revealing a coded numerical language that Dogecoin is speaking?
A language where “7.3” is the base frequency.
A hidden harmonic behind market psychology.
A natural algorithm whispering its intent through Fibonacci-like echoes.
This is not technical analysis.
This is numerical alchemy.

DOGEUSD: Pumpamentals or Hopium?DOGEUSD is forming a fractal pattern within a broadening triangle. Every Peak there is a descending triangle that follows, and then there is a quick uptrend which breaks above the previous high.
Expect DOGE to hit ATH by EOY if not sooner.

DOGEUSD H4 | Bearish Reversal DevelopingBased on the H4 chart analysis, we can see that the price is reacting off the sell entry, which is a pullback resistance that aligns with the 50% Fibonacci retracement and could drop from this level to the downside.
Sell entry is at 0.22234, which is a pullback resistance that lines up with the 50% Fibonacci retracement.
Stop loss is at 0.25109, which is a swing high resistance that aligns with the 127.2% Fibonacci extension.
Take profit is at 0.19579, which is a swing low support that lines up with the 138.2% Fibonacci extension.
High Risk Investment Warning
Trading Forex/CFDs on margin carries a high level of risk and may not be suitable for all investors. Leverage can work against you.
Stratos Markets Limited (tradu.com):
CFDs are complex instruments and come with a high risk of losing money rapidly due to leverage. 65% of retail investor accounts lose money when trading CFDs with this provider. You should consider whether you understand how CFDs work and whether you can afford to take the high risk of losing your money.
Stratos Europe Ltd (tradu.com ):
CFDs are complex instruments and come with a high risk of losing money rapidly due to leverage. 66% of retail investor accounts lose money when trading CFDs with this provider. You should consider whether you understand how CFDs work and whether you can afford to take the high risk of losing your money.
Stratos Global LLC (tradu.com ):
Losses can exceed deposits.
Please be advised that the information presented on TradingView is provided to Tradu (‘Company’, ‘we’) by a third-party provider (‘TFA Global Pte Ltd’). Please be reminded that you are solely responsible for the trading decisions on your account. There is a very high degree of risk involved in trading. Any information and/or content is intended entirely for research, educational and informational purposes only and does not constitute investment or consultation advice or investment strategy. The information is not tailored to the investment needs of any specific person and therefore does not involve a consideration of any of the investment objectives, financial situation or needs of any viewer that may receive it. Kindly also note that past performance is not a reliable indicator of future results. Actual results may differ materially from those anticipated in forward-looking or past performance statements. We assume no liability as to the accuracy or completeness of any of the information and/or content provided herein and the Company cannot be held responsible for any omission, mistake nor for any loss or damage including without limitation to any loss of profit which may arise from reliance on any information supplied by TFA Global Pte Ltd.
The speaker(s) is neither an employee, agent nor representative of Tradu and is therefore acting independently. The opinions given are their own, constitute general market commentary, and do not constitute the opinion or advice of Tradu or any form of personal or investment advice. Tradu neither endorses nor guarantees offerings of third-party speakers, nor is Tradu responsible for the content, veracity or opinions of third-party speakers, presenters or participants.

DOGE/USD – Weakening Under Resistance🔴 SHORT below $0.2155 – target $0.2059
Dogecoin rallied to $0.2232 resistance but failed to hold, pulling back toward the 200 SMA ($0.2155). RSI at 49 shows fading momentum. If it stays below $0.2155, DOGE risks sliding back to $0.2059 support.
📊 Keywords: #DOGEUSD #CryptoShort #MemeCoin #ResistanceRejection #PriceAction

Dogecoin (DOGE) Market Update & Catalysts: Ready for 50 cents?🚀 Dogecoin (DOGE) Market Update & Catalysts
🐋 Whale Accumulation & Trading Activity
Large players (“whales”) have been steadily absorbing DOGE, fueling upward momentum. Recent market structure shows that bulls defended the $0.22 zone, while primary support and reload range sits at $0.15–$0.16 — the bottom of the accumulation range. A breakout above $0.25 could spark a run toward $0.40, especially if short positions get squeezed.
🏦 ETF Prospects & Institutional Tailwinds
Optimism is building around a potential Dogecoin Spot ETF, with growing speculation that approval could arrive in the next cycle. An ETF would open the doors for institutional capital, mirroring what happened with Bitcoin’s rally.
🔗 Expanding Utility (DogeOS & DeFi)
The development of DogeOS, which allows DOGE to interact with Ethereum DeFi ecosystems, could give the coin a major utility boost beyond its meme status. This evolution may help sustain higher valuations long-term.
📈 Technical Signals & Price Forecasts
Chart patterns are turning favorable:
Golden cross (50-day MA crossing the 200-day) shows momentum strength.
Oversold RSI signals suggest a potential reversal upward.
If support at $0.15–$0.16 holds and bulls reclaim $0.25, upside targets expand to $0.34–$0.40.
🔮 Bullish Scenarios & Analyst Sentiment
Mid-term projections highlight possible price zones:
Conservative path: $0.30–$0.33 into 2025.
Aggressive path: Retesting all-time highs near $1 if institutional demand + ETF + DeFi traction align.
🌟 Key Positive Catalysts
🔑 Catalyst 🚀 Impact
🐋 Whale absorption & accumulation Strengthens base; short squeezes possible.
🏦 Spot ETF approval potential Brings institutional demand.
📊 Technical bullish patterns Golden cross + RSI suggest uptrend.
🔗 DogeOS & DeFi integration Expands DOGE’s real-world use cases.
💬 Strong community + hype Keeps DOGE in the spotlight.
✅ Summary
Dogecoin is holding its accumulation base at $0.15–$0.16, with strong whale support and growing catalysts like ETFs and DeFi integration. If bulls can reclaim the $0.25–$0.26 zone, momentum could build toward $0.40 in the mid-term — with long-term upside scenarios eyeing $1+ if institutional and utility drivers align.

InvalidationPrice has found support on the 1 WEEK 50 EMA 0.20721(grey line) and on top of the Fibonacci golden zone again.
Price is also resting on top of the 50 daily EMA in blue 0.20349.
If price can close higher with momentum and volume over the 0.22436 level, that may possibly invalidate the possible Head and Shoulders formation and start a new bullish structure.

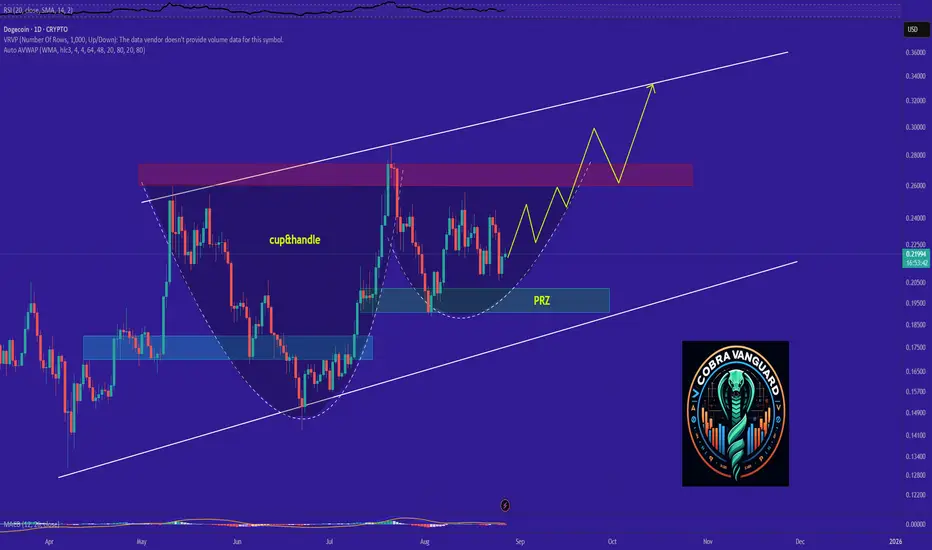
Can we be optimistic that this will come true?Perhaps this is a cup and handle pattern, and if that's the case, it could push the price up to around 0.30 .
Give me some energy !!
✨We spend hours finding potential opportunities and writing useful ideas, we would be happy if you support us.
Best regards CobraVanguard.💚
_ _ _ _ __ _ _ _ _ _ _ _ _ _ _ _ _ _ _ _ _ _ _ _ _ _ _ _ _ _ _ _
✅Thank you, and for more ideas, hit ❤️Like❤️ and 🌟Follow🌟!
⚠️Things can change...
The markets are always changing and even with all these signals, the market changes tend to be strong and fast!!
Doge Coin Stock Chart Fibonacci Analysis 082625Trading Idea
1) Find a FIBO slingshot
2) Check FIBO 61.80% level
3) Entry Point > 0.21/61.80%
Chart time frame:C
A) 15 min(1W-3M)
B) 1 hr(3M-6M)
C) 4 hr(6M-1year)
D) 1 day(1-3years)
Stock progress:C
A) Keep rising over 61.80% resistance
B) 61.80% resistance
C) 61.80% support
D) Hit the bottom
E) Hit the top
Stocks rise as they rise from support and fall from resistance. Our goal is to find a low support point and enter. It can be referred to as buying at the pullback point. The pullback point can be found with a Fibonacci extension of 61.80%. This is a step to find entry level. 1) Find a triangle (Fibonacci Speed Fan Line) that connects the high (resistance) and low (support) points of the stock in progress, where it is continuously expressed as a Slingshot, 2) and create a Fibonacci extension level for the first rising wave from the start point of slingshot pattern.
When the current price goes over 61.80% level , that can be a good entry point, especially if the SMA 100 and 200 curves are gathered together at 61.80%, it is a very good entry point.
As a great help, tradingview provides these Fibonacci speed fan lines and extension levels with ease. So if you use the Fibonacci fan line, the extension level, and the SMA 100/200 curve well, you can find an entry point for the stock market. At least you have to enter at this low point to avoid trading failure, and if you are skilled at entering this low point, with fibonacci6180 technique, your reading skill to chart will be greatly improved.
If you want to do day trading, please set the time frame to 5 minutes or 15 minutes, and you will see many of the low point of rising stocks.
If you want to prefer long term range trading, you can set the time frame to 1 hr or 1 day

Sal
"Dogecoin's recent performance has been bearish, with a 4.19% decline over the past 24 hours, bringing its price to $0.21. The current market capitalization stands at approximately $35.03 billion, with a trading volume of $4.21 billion.
*Key Price Levels:*
- *Support:* $0.08, where the price bounced back after reaching this zone
- *Resistance:* $0.22, which could lead to a downward rebound if the price reaches it
*Technical Analysis:*
- *Moving Averages:* Neutral
- *Indicators:* Sell signal
- *Expected Scenario:* Buy at the $0.08 support level and sell at the $0.22 resistance level
*Technical Insights:*
- Some analysts believe Dogecoin may continue to rise towards the upper trend line of the descending channel
- Others predict a decline due to short-term bearish resistance
Let me know if you need more details or specific analysis.

DOGE/USD – Holding Near Support Zone🟢 LONG above $0.2126 – target $0.2222+
Dogecoin trades at $0.2113, consolidating between $0.2059 support and $0.2126 resistance. RSI at 49 is balanced, showing indecision. A break above $0.2126 could push DOGE toward $0.2222.

DOGEUSD H4 | Bearish dropBased on the H4 chart analysis, we could see the price rise to the sell entry which is a pullback resistance that lines up with the 50% Fibonacci retracement and could drop from this level to the downside.
Sell entry is at 0.22235, which is a pullback resistance that lines up with the 50% Fibonacci retracement.
Stop loss is at 0.25109, which is a swing high resistance.
Take profit is at 0.19579, which is a swing low support that aligns with the 127.2% Fibonacci extension.
High Risk Investment Warning
Trading Forex/CFDs on margin carries a high level of risk and may not be suitable for all investors. Leverage can work against you.
Stratos Markets Limited (tradu.com ):
CFDs are complex instruments and come with a high risk of losing money rapidly due to leverage. 65% of retail investor accounts lose money when trading CFDs with this provider. You should consider whether you understand how CFDs work and whether you can afford to take the high risk of losing your money.
Stratos Europe Ltd (tradu.com ):
CFDs are complex instruments and come with a high risk of losing money rapidly due to leverage. 66% of retail investor accounts lose money when trading CFDs with this provider. You should consider whether you understand how CFDs work and whether you can afford to take the high risk of losing your money.
Stratos Global LLC (tradu.com ):
Losses can exceed deposits.
Please be advised that the information presented on TradingView is provided to Tradu (‘Company’, ‘we’) by a third-party provider (‘TFA Global Pte Ltd’). Please be reminded that you are solely responsible for the trading decisions on your account. There is a very high degree of risk involved in trading. Any information and/or content is intended entirely for research, educational and informational purposes only and does not constitute investment or consultation advice or investment strategy. The information is not tailored to the investment needs of any specific person and therefore does not involve a consideration of any of the investment objectives, financial situation or needs of any viewer that may receive it. Kindly also note that past performance is not a reliable indicator of future results. Actual results may differ materially from those anticipated in forward-looking or past performance statements. We assume no liability as to the accuracy or completeness of any of the information and/or content provided herein and the Company cannot be held responsible for any omission, mistake nor for any loss or damage including without limitation to any loss of profit which may arise from reliance on any information supplied by TFA Global Pte Ltd.
The speaker(s) is neither an employee, agent nor representative of Tradu and is therefore acting independently. The opinions given are their own, constitute general market commentary, and do not constitute the opinion or advice of Tradu or any form of personal or investment advice. Tradu neither endorses nor guarantees offerings of third-party speakers, nor is Tradu responsible for the content, veracity or opinions of third-party speakers, presenters or participants.

DOGE/USD – Testing Oversold Zone🟢 LONG above $0.2296 – target $0.2445+
Dogecoin remains under its 200 SMA ($0.2296), drifting lower toward $0.2165 support. RSI is sliding to 31, showing oversold pressure. A rebound above $0.2296 could trigger momentum toward $0.2445.
📊 Keywords: #DOGEUSD #OversoldSetup #CryptoLong #MemeCoinMove #PriceAction

The only chart you need for DOGEUSD This chart displays Dogecoin (DOGE/USDT) on a weekly timeframe, highlighting its long-term price trend within an ascending channel since 2014. Key historical breakout levels are marked (e.g., $0.00002, $0.002, $0.02, $0.20, $2, and a projected $20 target), showing the repeating exponential growth cycles. The chart is overlaid with support and resistance zones, Fibonacci-like levels, and trend channels (1.0, 1.1, 1.2, 1.5). Vertical dotted and dashed lines mark important cycle dates and potential turning points. Current price action is consolidating near $0.23, with future targets extending to $2 and potentially $20 if the channel pattern continues.
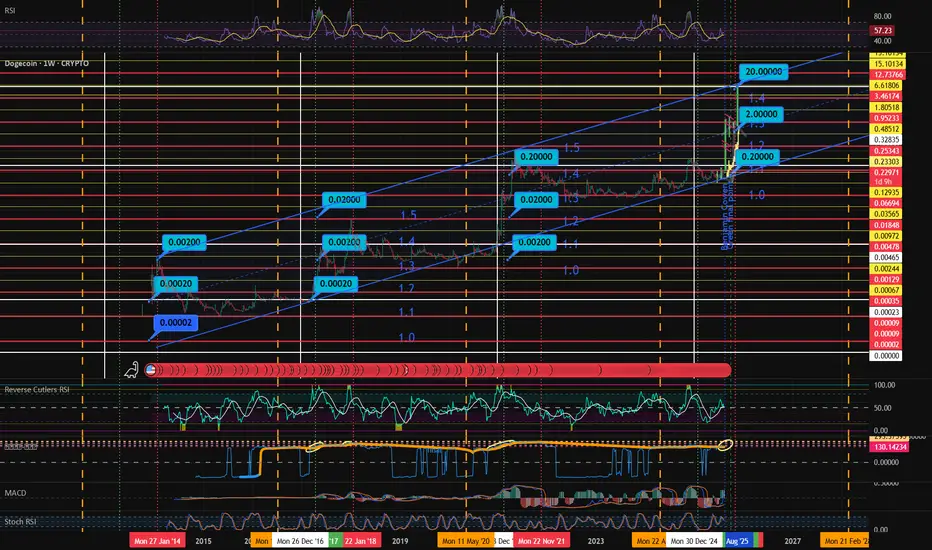
DOGE Bubble Cycle PatternBy merging both bubble charts (Yellow/Blue/Pink and Blue/Pink only), a clear fractal sequence emerges:
🔎 Step 1 – Cycle Sequences
Cycle 1 (2014–2016): Y (0.0002) → B (0.00073) → P (0.00173)
Cycle 2 (2017–2020): Y (0.0020) → B (0.0073) → P (0.0173)
Cycle 3 (2020–2022): Y (0.0200) → B (0.0730) → P (0.1730)
Cycle 4 (2025–2026, in progress): Y (2.0000) → B (7.3000) → P (17.3000 projected)
📌 Step 2 – Sequence Pattern
When overlaps are removed, each cycle follows the same strict order:
➡️ Yellow → Blue → Pink
This structure has repeated across 3 full historical cycles and is unfolding again in Cycle 4.
🧩 Step 3 – Cycle Rule
Yellow = Macro cycle anchor (start of each set).
Blue = Impulse peak within the cycle.
Pink = Correction pivot before reset.
The cycle then resets with a new Yellow and repeats.
So the long-term repeating loop is:
(Y → B → P) → (Y → B → P) → (Y → B → P) …
✅ Conclusion: DOGE’s bubble cycles are fractal, color-coded, and consistent. Currently, Cycle 4 has completed Yellow & Blue and is moving toward the Pink bubble (~17.3) before the next reset begins.