DeGRAM | DOGEUSD above the $0.24 level📊 Technical Analysis
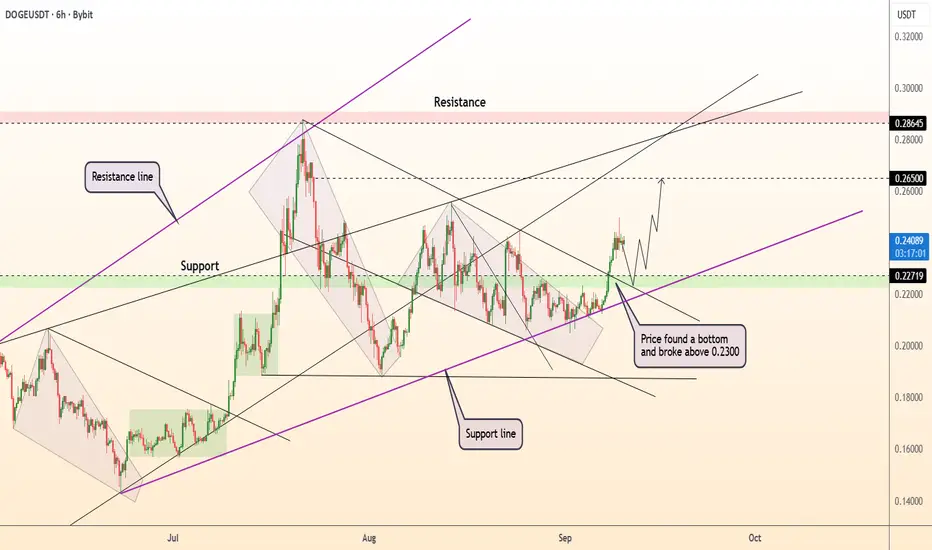
● DOGE/USD found a bottom at 0.2300, rebounding above support and confirming bullish accumulation.
● The breakout projects a move toward 0.2650, with the broader structure eyeing the 0.2865 resistance if momentum extends.
💡 Fundamental Analysis
● DOGE gains support from increased transaction volumes and renewed retail engagement, while improving sentiment across altcoins underpins the bullish outlook.
✨ Summary
Bullish above 0.2300; targets 0.2650 → 0.2865. Invalidation on a close below 0.2270.
-------------------
Share your opinion in the comments and support the idea with a like. Thanks for your support!
DOGEUSDT.3L trade ideas
DOGE: Is This the Start of the Altcoin Rally?It seems like crypto and altcoins are turning up.
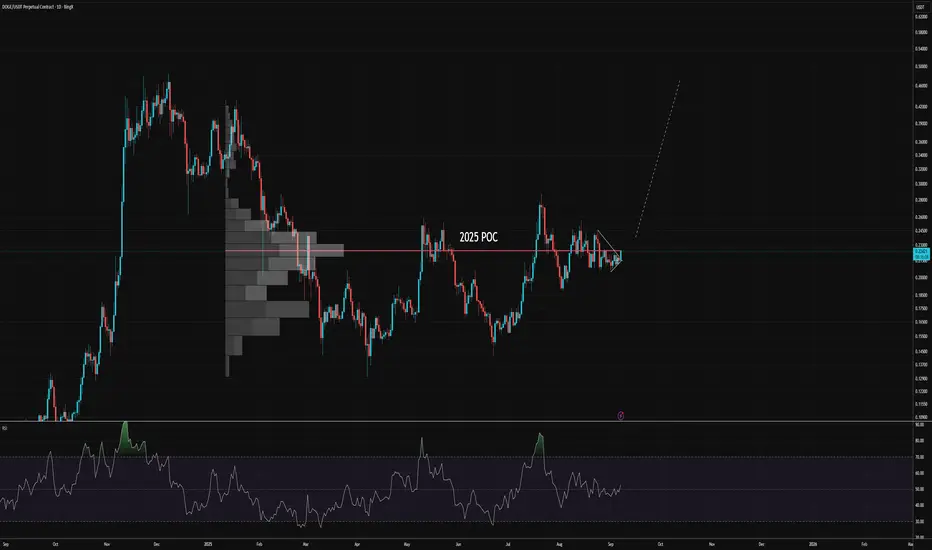
Is this the beginning of long-awaited altcoin season? DOGE appears to be breaking out of a triangle, the pinnacle of which is the 2025 Point of Control (POC). BTC also seems to be moving upwards.
DOGE Long Idea - MemecoinDOGE Swing Long Idea
📊 Market Sentiment
Market sentiment remains strongly bullish as the FED is expected to deliver a 0.25% rate cut, with speculation building for a possible 0.5% cut in September. Monetary policy shifts are being driven by both inflation trends and weakening labor market data. The latest August and September job reports were soft, signaling that the economy is cooling rapidly. This environment continues to fuel expectations for a major bullish run in the weeks ahead.
📈 Technical Analysis
Price recently broke and closed above the bearish trendline with strong bullish candles, confirming the breakout.
This is a key technical shift that aligns with my previous outlook. (I mentioned this scenario in my last DOGE analysis — check the linked idea for more context.)
📌 Game Plan
I entered the trade at $0.24841 immediately after the breakout confirmation.
📋 Trade Management
Stoploss: $0.22900
Target: $0.28779
💬 Like, follow, and comment if you find this setup valuable!
⚠️ Disclaimer: This content is for informational and educational purposes only and does not constitute financial, investment, or trading advice. Always do your own research before making any financial decisions.

Dogecoin Price Eyes $0.248 After BreakoutBINANCE:DOGEUSDT trades near $0.231 after a 6% daily bounce, breaking out of an inverse head-and-shoulders on the 4-hour chart. The target from this setup is $0.248, about 7.4% higher. Momentum is backed by EMA crossovers, with the 20 EMA already above the 200 EMA and more bullish crossovers lining up.
Dip buying adds weight to the move. The Money Flow Index trends higher, and both long-term and short-term holders have increased their positions. Still, traders must watch $0.210 as the first warning level, while a drop under $0.204 would fully cancel the bullish view.

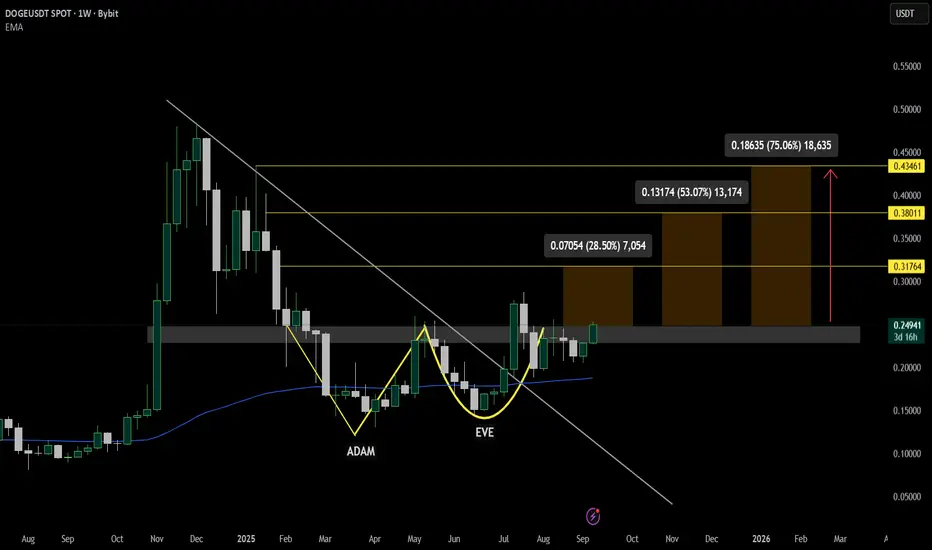
DOGEUSDT – Adam & Eve Pattern Targets $0.43CRYPTOCAP:DOGE on USDT market pair is gearing for a move upside after breaking out above the descending trendline.
With price forming an ADAM & EVE pattern, it going to provide an opportunity for bulls to obtain profits from a bullish rally with it now accumulating at pattern's neckline.
Key upside targets are marked at $0.317, $0.380, and $0.434,
As long as DOGE holds above $0.23,it remains bullish. A weekly close below this level would weaken the structure and could trigger a retest toward $0.20.
DOGE/USDT Waiting for a Sweep of the PCL DAILYSweep of latest interim lows = scalp opportunity (shorter-term reaction).
Price failed to create new FVG off previous FVG. Failing to create new displacement out of the prior FVG is the source of the weak leg. We now need a sweep of the Prior Candle Low (PCL). This clears the liquidity sitting under the most recent leg—interim liquidity inside the structure. Sweeping this might trigger a bounce.
👉 So if you want a higher-probability setup, you wait for the sweep of the first bar that caused the FVG imbalance. That clears the true liquidity pool. you can treat it as a scalp trigger if you’re looking for smaller plays.
Key points:
FVG leg = imbalance created.
PCL sweep = liquidity grab + stop run.
After the sweep, look for rejection/market structure shift on a LOWER TIME-FRAME to confirm entry.
No sweep → no trade.
🚩 Invalidation: If the supporting FVG breaks with a clear breakaway candle, this setup is void.
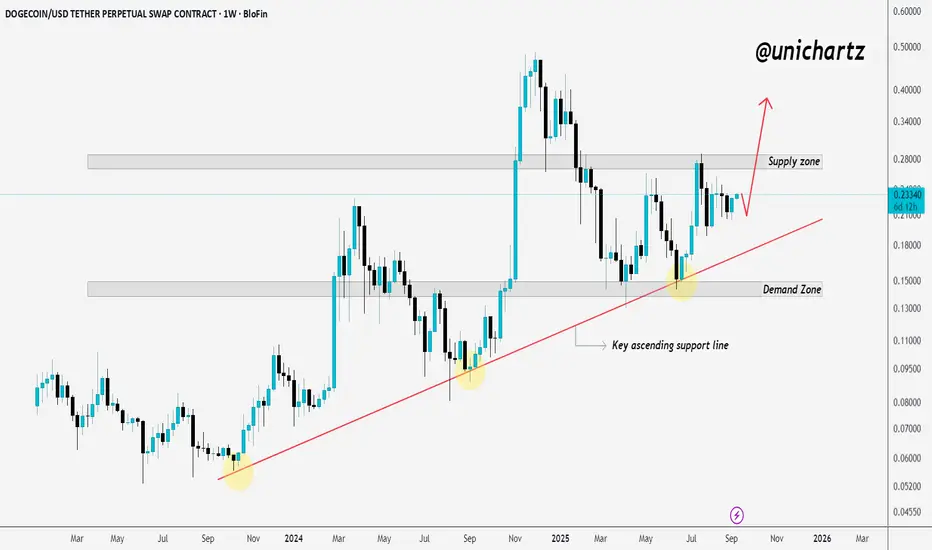
DOGE Price Heating Up! Support Tested, Big Move IncomingCRYPTOCAP:DOGE continues to respect its key ascending support line (red trendline), which has acted as a strong base since late 2023. Each retest of this level has led to a bounce, showing buyers are still defending it.
Price is trading around 0.23, moving toward the 0.27 supply zone. A breakout above could fuel another leg up, while losing support would put the 0.14–0.15 demand zone back in play, a crucial level to preserve the broader bullish structure.
In short, DOGE is at a decision point: holding support keeps the bullish case alive, but losing it could hand control back to the bears.
DYOR, NFA
DOGE - Dogecoin trading on MAJOR SUPPORT ZONE 1️⃣Hello Dogecoin watchers 📈
Dogecoin is approaching a key support zone after closing two consecutive red candles ( grey ) in the weekly timeframe, with the current also in the red - meaning the sellers are in control.
Dogecoin can easily drop 45% in 5 weeks and still inherently be "bullish" in the longer term, which may be confusing. That's why its important to identify the major bounce zones so you may know where to expect price action.
The two likely scenarios for the near term are:
1) Close ABOVE support:
2) Close BELOW support:

DOGE Fractal Repeats: History About to Rhyme ?Hello Traders 🐺
When I first opened the DOGE chart, I realized this chart is full of fractal moves — and that means big opportunities to make money! So I decided to share this idea with you guys, so our community stays profitable as always. Let me show you the hidden repetitive pattern on DOGE’s chart:
In the bigger picture, DOGE is inside a very clear symmetrical triangle, which (as you know) is a continuation pattern. But when you zoom in a bit, you can see price forming a kind of wedge formation over time, accumulating energy — and right after each breakout, DOGE exploded with massive pumps for one or two weeks straight.
Now we have the exact same pattern again! And since ETH is currently hovering around its ATH, it’s very likely that other major Alts (like DOGE) will follow the same path soon. 🚀
I hope you enjoy this idea, and as always remember:
🐺 Discipline is rarely enjoyable, but almost always profitable 🐺
🐺 KIU_COIN 🐺

Beware the $DOGE Drop: Critical Insights BINANCE:DOGEUSDT
Beware the CRYPTOCAP:DOGE Drop: Critical Insights
Entry: Marked at 0.30700 USDT, suggesting a potential buying point.
Take Profit (TP) Levels:
TP1: 0.28508 USDT
TP2: 0.26787 USDT
TP3: 0.25578 USDT
TP4: 0.20456 USDT
Stop Loss: Set at 0.33486 USDT, indicating a level to exit if the price moves against the trade.
DCA: Noted at 1.135 (0.32083) USDT, possibly a derived calculation or additional indicator.
Relative Strength Index (RSI):The RSI is currently at 89.20, which is in the overbought territory (above 70). This suggests the asset may be overvalued, potentially indicating a reversal or correction soon.
Analysis:The price is approaching the Entry level (0.30700 USDT) and is close to the Stop Loss (0.34486 USDT), which could indicate a critical decision point for traders.
The RSI being overbought (89.20) warns of a possible pullback, especially if the price fails to break past the Stop Loss level.
The Take Profit levels suggest a trading strategy aiming for incremental gains, with TP4 being the highest target at 0.20456 USDT.

Dogecoin Wave Analysis – 8 September 2025
- Dogecoin broke daily Triangle
- Likely to rise to resistance level 0.2600
Dogecoin cryptocurrency recently broke the resistance trendline of the daily Triangle from the middle of July.
The breakout of this Triangle should accelerate the active impulse wave iii of the short-term impulse wave 3 from the start of August.
Given the strongly bullish crypto sentiment seen today, Dogecoin cryptocurrency can be expected to rise toward the next resistance level 0.2600 (former monthly high from August).

DOGE 1D – Golden Cross Confirmed, Eyes on $0.287 Breakout?Dogecoin has printed a golden cross with the 50 EMA crossing above the 200 EMA — a key bullish signal. Price is holding above both moving averages and remains within the Fib retracement cluster of $0.177–0.217.
Upside targets:
$0.287 = first major resistance.
$0.416 and $0.479 = macro resistance levels above.
Downside invalidation:
A close back below the 50/200 EMAs would weaken the golden cross momentum.
Break under $0.201 exposes the 0.786 retrace near $0.177.
Stoch RSI is overbought, hinting at short-term cooling, but structure stays bullish while the golden cross holds.
📊 Key focus: Can DOGE capitalize on the golden cross to push past $0.287, or will overbought momentum trigger another Fib retest?


Institutional Flow Driving DOGE Upside Liquidity Hunt📊 Report-Based Analysis
Market Structure:
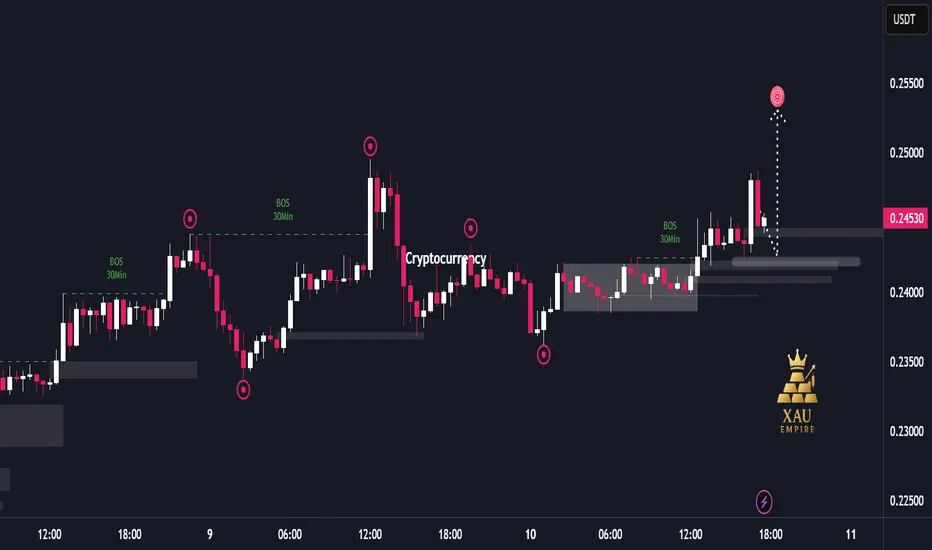
The chart shows multiple “Break of Structure (BOS)” events, indicating that institutional orders are driving the market direction. Frequent upside BOS suggests that the bullish trend is currently dominant.
Liquidity Movements:
Price has repeatedly hunted liquidity around major highs and lows (sharp wicks and sudden moves triggering stop losses) before returning to its intended direction. This behavior reflects strong institutional control over market flow.
Price Action Dynamics:
First, the market expanded upward with strong bullish momentum.
A sharp correction followed, creating volatility.
Afterwards, price entered a consolidation phase, which later broke to the upside.
Despite a recent rejection, the bullish structure remains intact.
Current Situation:
Price is trading around the 0.245 area. A large bullish candle was followed by a quick rejection, but the broader structure continues to lean bullish. Projections on the chart suggest a potential push higher as liquidity targets remain above.
Market Bias:
Short-term bias remains bullish. The consistent BOS and formation of higher lows show that the market is more likely to continue seeking upside liquidity in the near term.
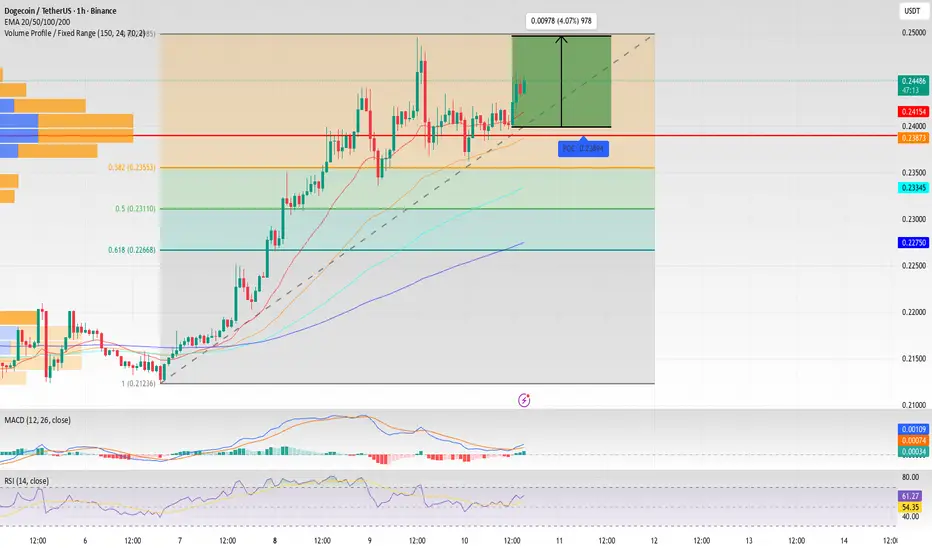
DOGE: Key Support Test.As anticipated, DOGE is pulling back to test a key support zone. This is a make-or-break moment for the bullish scenario.
The main focus is now on the $0.2370 - $0.2355 range. This area represents a strong support cluster, where the Point of Control (POC) from the volume profile converges with the 0.382 Fibonacci level—a prime zone for smart money to accumulate.
A successful hold and bounce from this level would be a strong confirmation of the uptrend's continuation. For those who missed the initial move, this could present an excellent entry point for a spot position. The target remains unchanged: a retest of the highs and a push towards the $0.250 - $0.255 zone.
A breakdown and close below $0.2350 would invalidate the current bullish setup and could trigger a deeper correction toward the $0.2300 area.
We are closely watching the price action in this zone and will act accordingly.
DOGE is about to flyI will use the next dump to buy lots of BINANCE:DOGEUSDT.P
I'm highly convinced this will pump to new ath in the near future.

DOGE/USDT LPL on 4hr chart. Trading on 1hr time-framePrice failed to create new FVG off previous FVG and instead a LOW PROBABILITY LEG (LPL) was formed ON 4HR time-frame. Price may possibly use this LPL as a new discount array to move higher from. All the best.

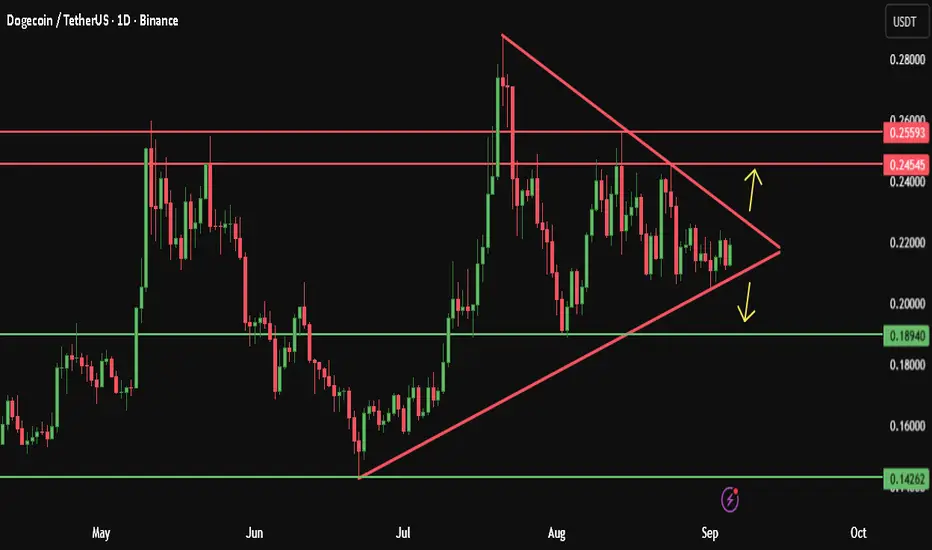
Dogecoin A potential explosive move is comingWe are currently observing the formation of a Symmetrical Triangle, suggesting the market is coiling up for a significant move.
A bullish breakout to the upside would likely target the upper resistance zone 0.2454 and 0.25593.
In the event of a bearish breakdown, we could see a decline towards the lower support at 0.18940 and 0.14262.
Let’s keep a close eye on this pattern for a confirmed direction.
please note :
this is not financial advice — it reflects only my personal opinion.
PLEASE always do your own research before trading .. Good luck with your trades.
DOGE 1D – Testing $0.277 Liquidity After Strong RallyDogecoin has surged from support blocks, reclaiming both EMAs and running directly into the $0.277 liquidity target. Momentum is strong, but the Stoch RSI is maxed at 100, showing stretched conditions.
Upside:
A breakout above $0.277 would open room toward $0.30+.
Holding above EMAs would confirm trend continuation.
Downside:
A rejection here could lead to a pullback into the $0.22–0.20 zone, with the golden pocket at $0.189 as critical support.
Losing that area exposes $0.163 and the major liquidity pool at $0.142.
📊 Key focus: Can DOGE hold above EMAs and break liquidity at $0.277, or will stretched conditions send it back into support first?

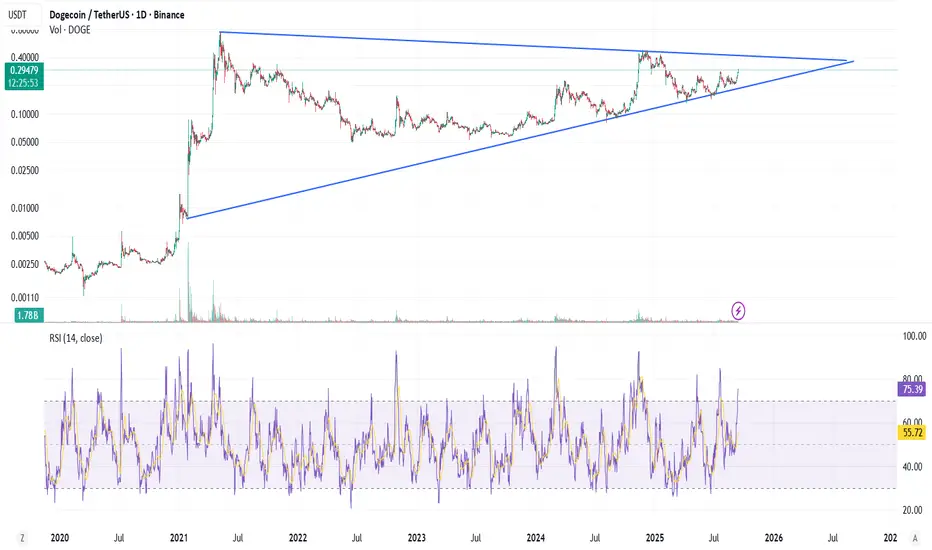
DOGE/USDT: Symmetrical Triangle Coils for a Major BreakoutThe DOGE/USDT pair is in a long-term symmetrical triangle pattern, a classic continuation pattern that suggests a significant price movement is imminent. This pattern is formed by a series of lower highs and higher lows, creating a narrowing trading range. The price is currently at a critical decision point, testing the upper resistance line of the triangle.
Key Technical Analysis:
Symmetrical Triangle Pattern: This pattern has been forming since mid-2020. The base of this triangle, from the low around $0.0011 to the high near $0.45, represents a massive price range.
Target Price Calculation: The standard way to calculate a target price for a symmetrical triangle breakout is to measure the height of the pattern's base and project it from the breakout point.
Base Height: The widest part of the triangle spans from approximately $0.0011 to $0.45, a difference of about $0.4489.
Breakout Point: A confirmed breakout would likely occur above the current resistance level, which is near $0.295.
Target Price: Projecting the base height from the breakout point ($0.295 + $0.4489) gives us a long-term target of approximately $0.7439.
Potential Scenarios & Trade Plan:
Bullish Scenario: A decisive close above the triangle's upper trend line, ideally with a significant increase in volume, would confirm a bullish breakout.
Entry: A confirmed breakout and retest of the upper trend line as support.
Target: The first major target is $0.7439. Subsequent targets would be the all-time high and potential price discovery beyond that.
Invalidation/Stop-Loss: A move back inside the triangle or a close below the lower trend line would invalidate the bullish thesis. A tight stop-loss could be placed just below the breakout level.
Bearish Scenario: A breakdown below the triangle's lower trend line, particularly on high volume, would be a strong bearish signal.

DOGE Swing Long Idea DOGE Game Plan
📊 Market Sentiment
Overall sentiment remains bullish, supported by expectations of a 0.25% rate cut in the upcoming FOMC meeting. A weakening USD and increasing global risk appetite are creating favorable conditions for further upside in crypto assets.
📈 Technical Analysis
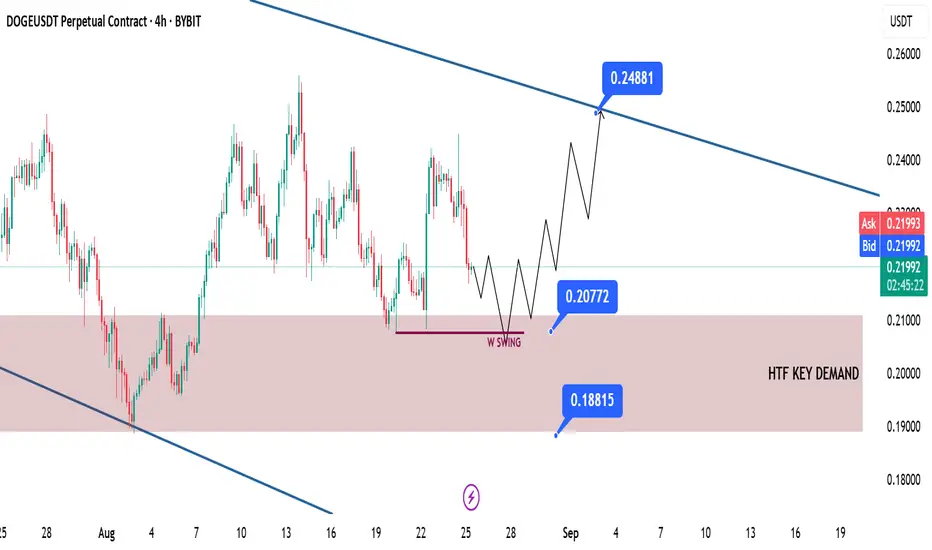
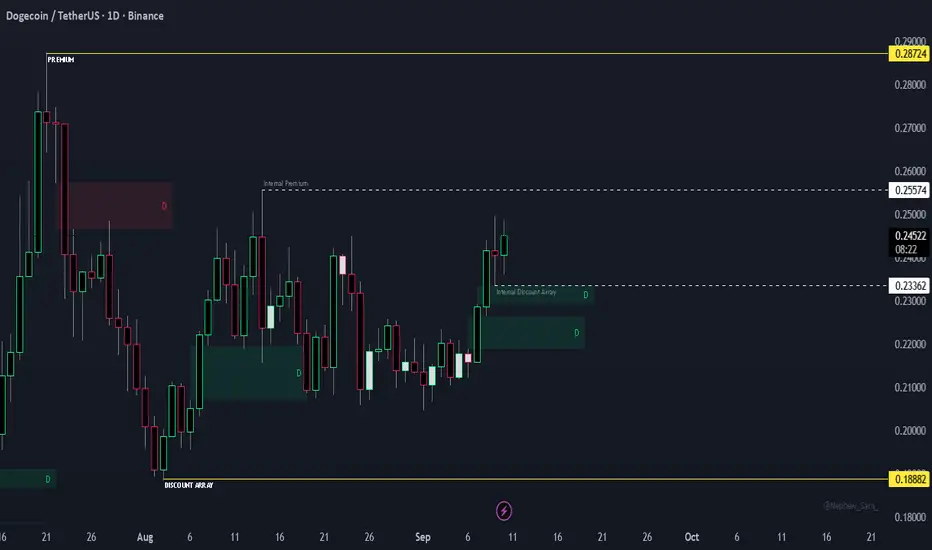
Price is retracing towards the HTF Demand zone, which I expect to act as a bounce area.
Moreover, price currently seems to be seeking liquidity to fuel its next bullish move. That liquidity could be the weekly swing low at $0.207.
📌 Game Plan
Wait for price to reach the HTF Demand zone.
Look for price to sweep liquidity and close back above the $0.207 level.
🎯 Setup Trigger
I will be waiting for a 4H market structure shift before entering the trade.
📋 Trade Management
Stoploss: Daily close below HTF support zone — $0.188
Target: $0.248
💬 Like, follow, and comment if you find this setup valuable!
⚠️ Disclaimer: This content is for informational and educational purposes only and does not constitute financial, investment, or trading advice. Always do your own research before making any financial decisions.