DOGE/USDT Daily Outlook (August 9, 2025)Structure Detected
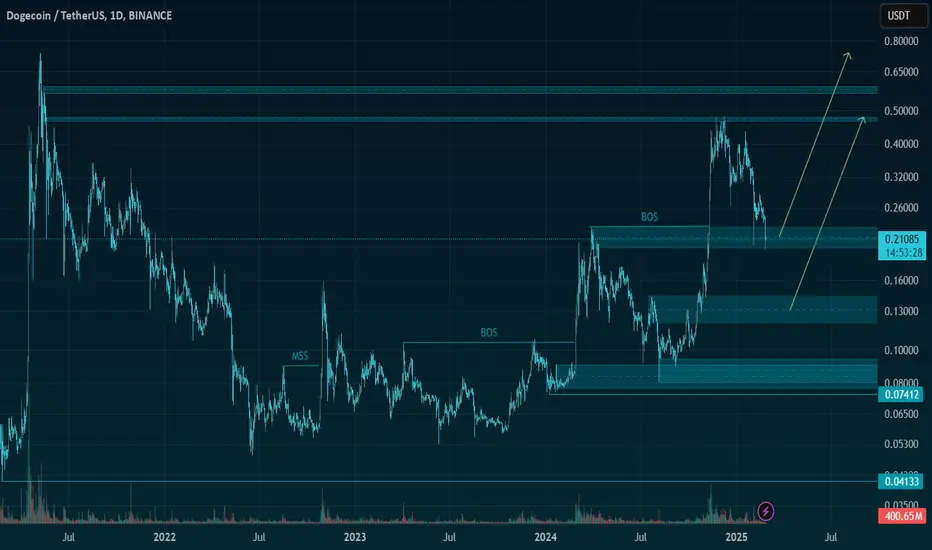
Price is moving within a broad ascending channel -- current action is around the midline resistance.
Recent candles show a bounce off the lower half of the channel, reclaiming momentum toward the midline.
Volume Profile shows highest interest between $0.20–$0.25, meaning we’re trading right inside a major liquidity zone.
Historically, moves from this mid-channel zone often test either the upper channel near $0.48 or revert to the lower channel (~$0.15).
📊 Market Bias
Short-term: Bullish tilt while above $0.22 support — strong recovery from recent local lows and consistent green Heikin Ashi candles.
Medium-term: Still neutral until price can break & close above ~$0.27 (clear channel midline breakout).
Volume cluster at $0.24 may cause some chop before resolution.
🎯 Bullish Targets
$0.27 – Break & retest of channel midline.
$0.35–$0.36 – Next high-volume node from the profile.
$0.48 – Channel top & major psychological resistance.
🔻 Bearish Levels
$0.22 – Immediate support.
$0.20 – High-volume support; losing this flips bias bearish.
$0.15 – Lower channel boundary / high interest node.
🕰️ Timeframe-Based Targets
Daily Swing Upside: $0.27 → $0.35 → $0.48
Daily Swing Downside: $0.22 → $0.20 → $0.15
📝 Summary
DOGE is in a mid-channel battle inside a key liquidity cluster around $0.24. Holding above $0.22 keeps the bias short-term bullish toward $0.27, but failure here likely sends it back to $0.20 for a retest. A clean daily close above $0.27 could set up a move toward $0.35 (+).
Trade ideas

Doge, a great profit until Christmas.Moving forward in the crypto market, Dogecoin will also have a great profit.
Don't forget to follow and boost to get amazing and profitable signals
Introduce me to your friends so we can all profit together

Doge pump to $0.24064 todayRecently open this position. Still good for decent RR.
SL: 0.23379
Tp: 0.24064
Taking advantage of overall bullish momentum for altcoins.

DOGE x7 ShortEntry $0.237 Short
SL $0.02448
Just below high close for the day
Target $0.22
Sell 100%
Just above 200EMA
Risk - 6/10

Buy Trade Strategy for DOGE: Leveraging Community and Utility Description:
This trading idea highlights DOGE (Dogecoin), a cryptocurrency that has evolved from its meme origins into a widely recognized digital asset with growing real-world use cases. Supported by one of the most active and loyal communities in the crypto space, DOGE benefits from high liquidity, mainstream awareness, and increasing adoption for microtransactions and payments. Backed by influential endorsements and a strong social media presence, DOGE continues to attract retail and institutional interest, making it a unique player in the broader cryptocurrency market.
That said, the value of DOGE remains highly sensitive to market sentiment, media coverage, and broader macroeconomic trends. Its price can experience significant volatility in short periods, meaning careful risk management is essential for anyone considering an investment.
Disclaimer:
This trading idea is for educational purposes only and should not be considered financial advice. Trading cryptocurrencies like DOGE carries substantial risks, including the possibility of losing your entire investment. Always conduct your own research, evaluate your financial position, and consult with a qualified financial advisor before making any trading or investment decisions. Past performance is not indicative of future results.
Will DOGE/USDT Be Our Next Bullish Jackpot? 🚀 DOGE/USDT – Bullish Crypto Heist Plan 🐕💰 | Thief Trader Style 🔥
💎 Asset: DOGE/USDT “DogeCoin vs Tether”
📜 Plan: Bullish Heist — Layering Strategy Entries
🎯 Target: 0.2800
🛑 Stop Loss: 0.2100
💥 Attention Money Bandits & Crypto Robbers! 💥
The vault door is open, and DOGE is sitting there wagging its tail, guarding bags of Tether 💼🐕💵. This is the perfect Thief Trader moment — we’re moving in long and stacking up our loot using multiple buy limit orders at juicy price levels.
📈 Entry Point:
Swipe in anywhere you catch the dip — but we prefer loading up in layers to trap more coins without spooking the guards (market makers). Keep your alerts armed and ready.
🛑 Stop Loss:
Our getaway car waits at 0.2100 — if the heist goes south, we vanish without a scratch. Position size and order count? That’s on you, partner.
🎯 Target Zone:
The prize vault is at 0.2800 — cash out, count your loot, and treat yourself like the legend you are.
⚡ Scalper’s Note:
Only rob this vault from the bullish side. If you’ve got deep pockets, go all-in quick. If not, swing trade it with patience — just trail your SL so no guard catches you.
📢 Thief Intel Briefing:
DOGE is riding bullish sentiment, driven by market momentum, speculative inflow, and the “meme power” effect. Fundamentals, on-chain flow, sentiment — all pointing north. 🧭🚀
⚠️ Robbery Protocol During News Events:
Avoid jumping in exactly at high-impact news time — too much chaos in the vault.
Protect your running loot with trailing SL.
Be alert for fakeouts — guards love to lure greedy robbers.
💖 If this heist plan makes you smile (and money), hit that Boost button to keep our robbery crew strong. Together, we take what’s ours — every single day. 🏴☠️💎🚀

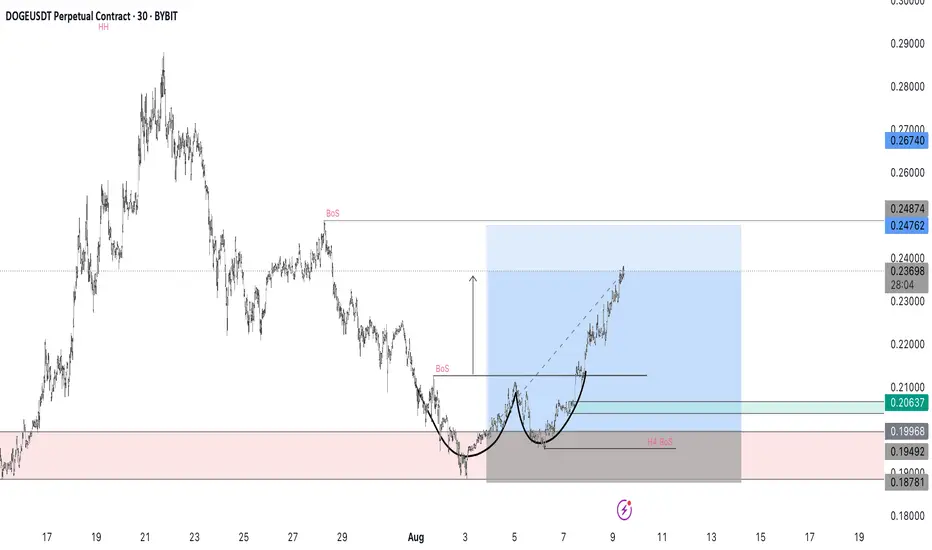
Cup and handle forming nicely I took this dodge trade and saw this beautiful cup and handle forming so I added to my position. weekly uptrend and daily uptrend also the H$.
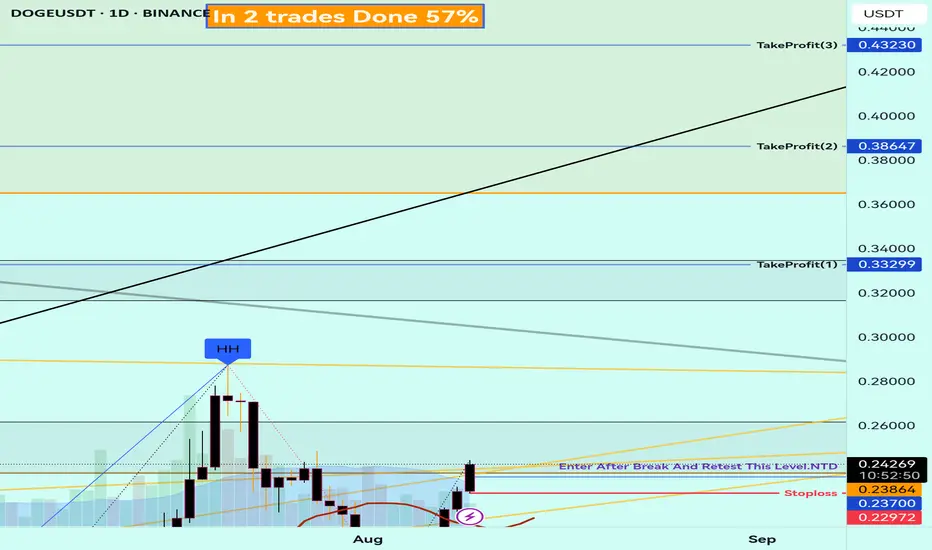
DOGE1. The moon is 99.99% full
2. July swing high next
3. An extension above July swing high that is equal in size to the correction from July swing high to the retest of broken diagonal resistance
4. Above yearly open and into its mid of the whole move, probably tests diagonal resistance of the whole move (with respect to 2021 highs), which happens to be around .4269
5. Starts closing above .4269 and teleports to highs
6. True "Bull market" starts above highs

$DOGEtime to lead the charge
.45% risk
lagging
btc pair looks lush
step on it enough HTF charts around targeting 37c for now

DOGE 8H Golden Pocket Bounce, Reclaims 0.5 Fib Level StronglyDOGE retraced into the golden pocket (0.618–0.65 Fib zone) where buyers stepped in, triggering a strong reversal. The move pushed price back above the 0.5 Fib level at $0.216, showing solid recovery momentum. This climb has retraced much of the late-July drop and brought price back to levels last seen in early August, with Stoch RSI reaching overbought during the rally.

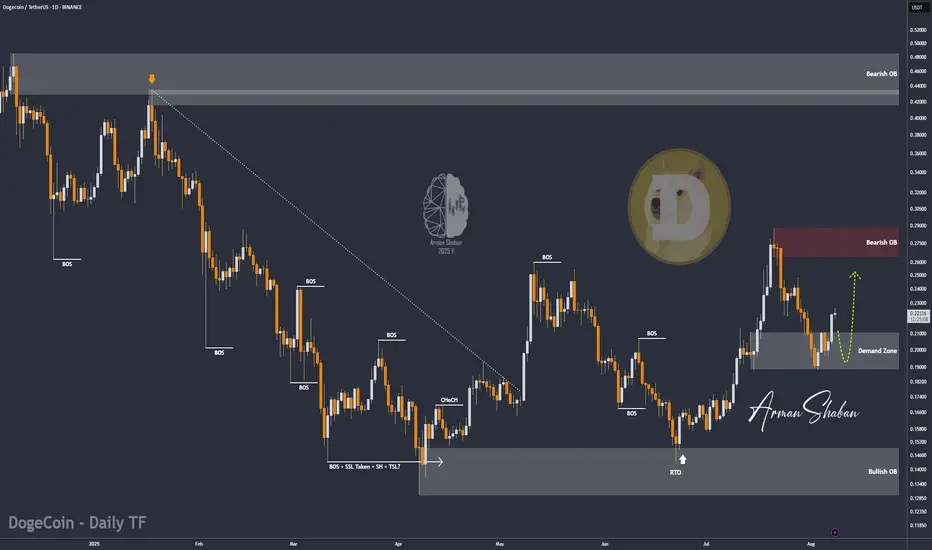
DOGE/USDT | DOGE Up 20% – Next Targets: $0.24, $0.287 & Beyond!By analyzing the Dogecoin chart on the daily timeframe, we can see that, as expected, the bullish reaction has continued, and DOGE is now trading around $0.226. This analysis has delivered over 20% returns so far. The next targets are $0.24, $0.287, $0.32, $0.41, and $0.70. Hope you’ve made the most of this move, and stay tuned for the upcoming updates!
Please support me with your likes and comments to motivate me to share more analysis with you and share your opinion about the possible trend of this chart with me !
Best Regards , Arman Shaban
DeGRAM | DOGEUSD broke out of the descending wedge📊 Technical Analysis
● DOGEUSD rebounded from 0.2004 support, breaking the corrective trendline and resuming its climb within the rising channel structure.
● Price is now targeting the 0.2615 resistance, with momentum driven by a sustained series of higher lows and a breakout retest.
💡 Fundamental Analysis
● Broader crypto market gains following BTC’s push above $64k have lifted altcoin sentiment, while DOGE’s network activity rose after an uptick in whale transactions.
✨ Summary
Long above 0.2200; target 0.2615. Setup remains valid while price holds above 0.2004.
-------------------
Share your opinion in the comments and support the idea with a like. Thanks for your support!

DOGE: Golden Cross Incoming After 33% Pullback
This is DOGE on the Daily
This chart is screaming upside potential.
The move began with two higher lows off the 0.786 Fib level at \$0.15924. From there, price blasted through both the 50MA and 200MA straight into the 0.618 Fib at \$0.28336 — an 80% rally.
What followed was a healthy 33% correction, briefly pausing at the 0.5 Fib level (\$0.22135), which sits midway between the long-term 0.786 and 0.618 levels.
The dip stopped right at the 50MA, which once again acted as a springboard — sending price back above the 200MA, the BB center, and reclaiming the 0.5 Fib, which today is holding as support.
A golden cross is now imminent. The last time DOGE saw this setup was in early November 2024, which led to a 200% move.
In my opinion, today could offer a strong long opportunity — with a stop loss below the 0.5 Fib or even the 200MA, depending on your risk profile.
Always take profits and manage risk.
Interaction is welcome.

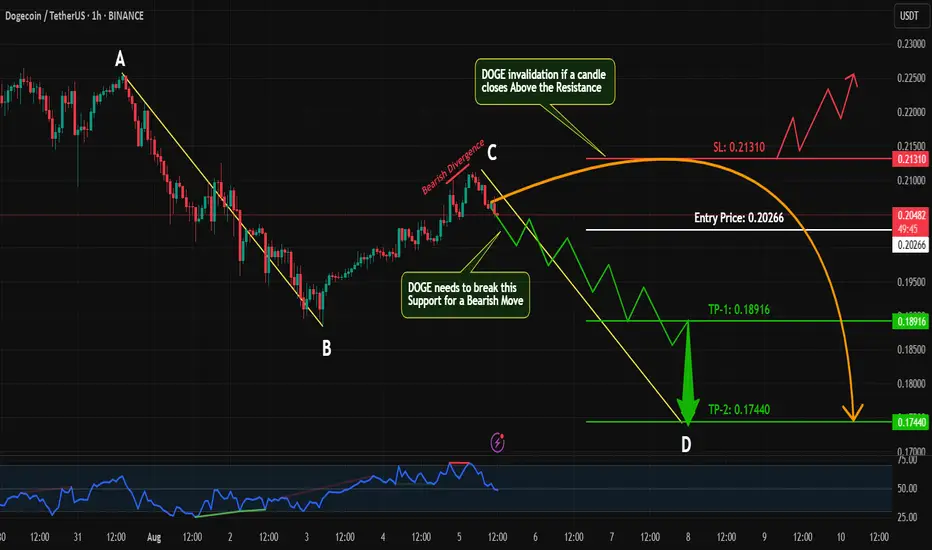
DOGE Bearish Setup in Progress |AB=CD Pattern+Bearish Divergence Hey Traders!
#DOGE/USDT is currently showing signs of a bearish continuation on the 1H timeframe 📉. Here's why I'm watching this closely:
🔹 AB=CD Harmonic Pattern:
The AB leg is already complete, and the price action is now progressing toward forming the CD leg — a classic harmonic setup suggesting further downside.
🔹 Bearish Divergence on RSI:
While the price made a higher high, RSI failed to confirm — signaling weakening momentum and potential reversal ahead.
🔹 Key Support Level in Focus:
I’m watching the previous minor support zone for confirmation. If price breaks and retests this level, it could be a great entry point for a short trade with solid risk-reward.
📌 Trade Plan:
✅ Wait for confirmation below support
✅ Look for bearish candlestick patterns or breakdown
✅ Enter short with proper risk management (SL just above local highs)
💬 What do you think about this setup? Are you already short on #DOGE or waiting for more confirmation? Drop your thoughts below 👇 and let’s discuss!
If you find this analysis helpful, don’t forget to:
👍 Like
💬 Comment
🔁 Share
📥 Follow for more high-probability setups!
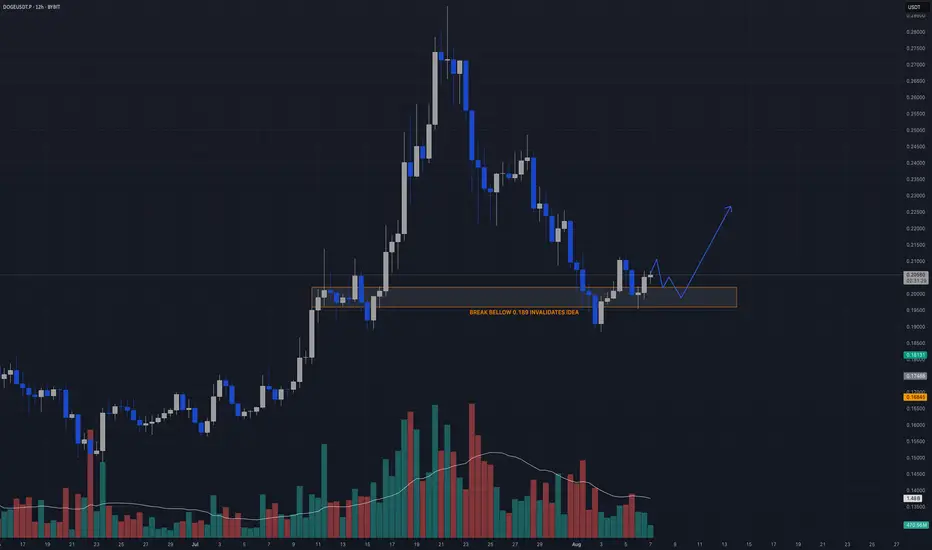
DOGE 1H – Retest Setting Up, But Can Bulls Hit 0.226?Dogecoin broke through resistance and is now eyeing a potential retest of the 0.214–0.215 zone. This level coincides with prior structure and sits just above EMA support, making it a high-interest spot for bulls to step in.
A successful hold here could drive price toward the 0.226 target, following the projected bullish path. Failure to defend the zone would invalidate the setup and may trigger a deeper pullback toward the 0.210 region.
Key watchpoints:
– Retest of 0.214–0.215 for possible long entries
– Overhead target at 0.226
– Invalidation if price closes below 0.213

DOGE/USDT: Bullish Momentum Building Up🚀 Trade Setup Details:
🕯 #DOGE/USDT 🔼 Buy | Long 🔼
⌛️ TimeFrame: 1D
--------------------
🛡 Risk Management:
🛡 If Your Account Balance: $1000
🛡 If Your Loss-Limit: 1%
🛡 Then Your Signal Margin: $15.42
--------------------
☄️ En1: 0.28242 (Amount: $1.54)
☄️ En2: 0.23477 (Amount: $5.4)
☄️ En3: 0.20084 (Amount: $6.94)
☄️ En4: 0.16692 (Amount: $1.54)
--------------------
☄️ If All Entries Are Activated, Then:
☄️ Average.En: 0.21748 ($15.42)
--------------------
☑️ TP1: 0.48434 (+122.71%) (RR:1.89)
☑️ TP2: 0.57076 (+162.44%) (RR:2.51)
☑️ TP3: 0.6806 (+212.95%) (RR:3.28)
☑️ TP4: 0.82033 (+277.2%) (RR:4.28)
☑️ TP5: 0.9746 (+348.13%) (RR:5.37)
☑️ TP6: Open 🔝
--------------------
❌ SL: 0.07646 (-64.84%) (-$10)
--------------------
💯 Maximum.Lev: 1X
⌛️ Trading Type: Position Trading
‼️ Signal Risk: 🙂 Low-Risk! 🙂
🔎 Technical Analysis Breakdown:
This technical analysis is based on Price Action, Eliot Waves, SMC (Smart Money Concepts), and ICT (Inner Circle Trader) concepts. All entry points, Target Points, and Stop Loss are calculated based on professional mathematics formulas as a result you can have an optimal trade setup based on great risk management.
📊 Sentiment & Market Context:
The DOGE/USDT pair is currently showing strong bullish signals as momentum builds up in the market. With positive sentiment around Dogecoin due to increased social media attention and its growing presence in the crypto space, this pair could see further upside. Technically, key support levels have held firm, and recent price action suggests a potential breakout towards the upside. On the fundamental side, Dogecoin's association with high-profile figures and growing use cases continue to fuel interest, making this a pair to watch closely for potential gains. Keep an eye on volume and price action for confirmation of this bullish trend.
⚠️ Disclaimer:
Trading involves significant risk, and past performance does not guarantee future results. This analysis is for informational purposes only and should not be considered financial advice. Always conduct your research and trade responsibly.
💡 Stay Updated:
Like this technical analysis? Follow me for more in-depth insights, technical setups, and market updates. Let's trade smarter together!
Long Doge 7xEntry $0.214
Entry above 200EMA
Stop $0.204
Target $0.225
Moving to B/E once trade start to work
Risk - 5/10

DOGEUSDT – Meme Coin with a Plan (Yes, Seriously)Hey Candle Fam,
While retail was barking “it’s over” on the dip, DOGE quietly tapped into HTF support, wiped out overleveraged degens, and is now showing signs of life. Woof.
🎯 LONG Setup
Entry: $0.202–$0.196
Stop Loss: $0.189
Targets: $0.218 / $0.230 / $0.250
📊 Strategy: Liquidity Grab + Volume Reclaim
– 12H sweep below $0.20 triggered sell-off → absorbed on volume
– Footprint = seller exhaustion, delta reversal
– Velo = funding flat, liquidation spike = weak hands out, smart money in
⚠️ Below $0.189 = structure broken, stand aside.
✅ Spot or low leverage play only
It may be a meme, but the setup is pure structure.
We trade signals, not dog sounds. 🐶
Candle Craft | Signal. Structure. Execution.
Do you think I'm joking ???It appears that the price is forming a cup and handle pattern, and if this occurs, it could push the price above $0.30.
Best regards CobraVanguard.💚

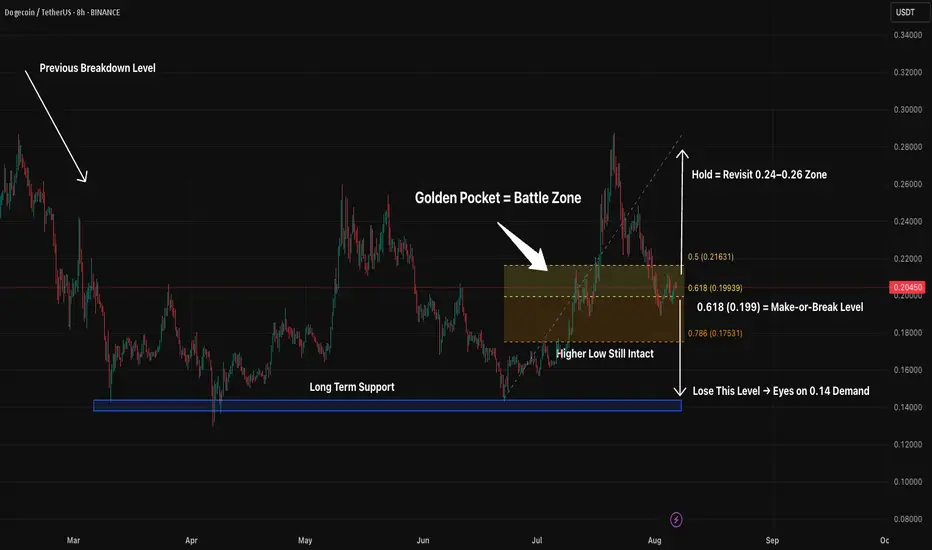
DOGE 8H – Fib Confluence Holding, But Decision Point Is HereDogecoin is at a pivotal moment.
After a sharp rally into the $0.28 zone, price retraced directly into the golden pocket (0.5–0.618 fib zone between $0.216 and $0.199). That area — historically known for decisive continuation or breakdown — has turned into a congestion zone.
Price is sitting right on top of 0.618, a level that lines up with prior structural resistance from June and swing support from July. This “support clustering” forms a critical level for the bulls to defend.
If the 0.618 Fib holds, this remains a healthy pullback in a broader bullish structure — and a push toward $0.24–$0.26 becomes likely. But lose it, and the door opens to a full retrace toward the high-demand blue zone around $0.14.
In short:
– Holding Fib = Bullish continuation bias
– Lose 0.199 = Trend invalidation and deeper pullback likely
– Still a higher low for now — but it’s hanging by a thread
Watch this level closely — this is where the next wave is born.
Dogecoin Turns Bullish · Leveraged Trade · 3320% Potential @8XThe support zone is the 0.618 - 0.786 Fib. retracement levels marked blue and purple on the chart. We can clearly see two hammers (candlestick patterns), last week and this week. We can see the higher lows but also the broader rising channel structure. We can also see the even bigger structure coming from the low in 2024. In short, a long-term bullish cycle unfolding right in front of our eyes... Dogecoin is going up.
I am approaching this pair for my people with high leverage. High leverage means high risk. At the same time, we also have a very high potential for reward. The last target goes beyond 3,000%.
You don't have to go for all the targets nor all the lev. You can use lower leverage for less risk, more stability and peace of mind. You can do 2-3X and this would be a safe trade setup. You can do 4-5X for mild risk but still a strong potential for reward. And finally, you can do 6-8X as an expert knowing that you can get liquidated in a flash. All money can be gone. But, if my timing is right, you can end up with a position so strong that regardless of what happens after the breakout, sell early or late, you will be happy with the results.
It is always tricky, but we continue to learn and improve. Here we can see what is possible. Knowing what is possible, planning, preparing and taking action in the right way, we can achieve our goals and quit our day-job.
Trading is no different to any other profession/work, it takes time, practice, patience and dedication. The only difference is that here when you get it right you are rewarded for the long haul. Once you learn how to trade, that is, learn to play the market at its own rhythm, you can collect as much money as you want. It is true, but it takes years of hard work.
Here we have Dogecoin again. Will it grow? Will it crash?
Time will tell, but my money is on prices going up.
My money, my rep, my trust.
Let's see... Let's wait and see.
Not all trades are meant to be won.
If you follow capital allocation and a good strategy, you are able to take in the losses that are inevitable and still win big at the end of the game.
Remember, it is not about winning the all; it is about winning big, it is about winning over and over; it is about creating the habit of winning and this habit will make all the time and effort we invest in this venture worth it. It is not about being right, it is about getting paid.
With the right mindset and a little bit of patience... We can do this!
Namaste.

IS DOGE Losing Steam or Gearing Up? Pro-Level Market Structure IS DOGE Losing Steam or Gearing Up? Pro-Level Market Structure
📊 Technical & Trend Analysis
Current Price & Structure:
DOGE is trading around $0.2058 and has recently fallen below both the ascending trendline since late June and the 50‑day EMA (~$0.20), signaling weakening momentum
Resistance & Support Levels:
Major Resistance: ~$0.21–$0.212 — price has repeatedly failed at this zone, forming a possible bearish flag or resistance trap
X (formerly Twitter)
+15
Mitrade
+15
Cryptonary
+15
.
Support Zones: Key levels around $0.196 and $0.18, breach of these may open path to $0.15 or lower short-term
Mitrade
.
Trading Sentiment & Derivatives:
Rising short interest and negative funding rates in futures suggest growing bearish sentiment among traders. Long-short ratio is near 0.86—indicating more shorts than longs
Binance
+1
.
🎓 Technical Setup Summary (Educational Breakdown)
Chart Pattern: Potential bearish continuation forming with flag or descending consolidation after breakdown.
Momentum Indicators: Weak RSI and MACD below zero typically align with this structure—though check live chart from platforms like TradingView or Investing.com
Investing.com
.
Trade Selection Approach:
Short Trade Setup: Wait for confirmation below $0.196 to test trend continuation toward $0.18 or $0.15. Stop-loss above $0.202–$0.205.
Long Trade Setup: If DOGE reclaims $0.21 with volume and breaks above the broken trendline + 50‑day EMA, potential rebound toward ~$0.225 or higher. Stop-loss below $0.20.
🔮 Forecast & Outlook
Short-Term: Likely consolidation or correction toward $0.18 unless bullish momentum resumes. Analysts eye potential targets around $0.199–0.215 in early August, rising maybe toward $0.232 by mid-August if sentiment snaps back
Binance
+2
Indiatimes
+2
Indiatimes
.
Medium to Long-Term:
Some speculative projections place DOGE near $1 by year-end, driven by hype cycles, meme coin revival, celebrity tweets, and ETF optimism. That being said, DOGE’s unlimited supply makes $1 an aggressive target requiring massive capital inflow
Crypto News
+5
Wikipedia
+5
Indiatimes
+5
.
✅ Key Takeaways for Traders & Learners
Concept Insight
Support/Resistance $0.196–$0.18 = bearish supports; $0.21 = strong resistance zone
Trendline & EMA Breaking below trendline/50‑day EMA signals weakening structure
Volume & Funding Increasing shorts and low funding rates hint at bearish pressure
Risk Management Use proper stop-loss zones ($0.196 for shorts, $0.20 for longs)
Catalysts to Watch Whale accumulation, meme hype, ETF news, celebrity endorsements
🚨 Risks & Important Considerations
Volatility & Pump Risks: MEME coins like DOGE are susceptible to pump-and-dump dynamics and social-media driven surges or dumps
Indiatimes
Binance
+1
.
Inflationary Drag: Without a supply cap, DOGE’s price is diluted by thousands of coins mined daily, limiting long-term upward momentum unless demand rises significantly.
Macro Events: Broader economic shocks—such as U.S. tariffs or regulation changes—can rapidly swing sentiment across crypto markets. Recent U.S. tariffs pulled DOGE down ~8% with Bitcoin and Ethereum
Wikipedia
.
🧭 Final Summary
Current Bias: Slightly bearish-to-neutral—downward pressure from technical breakdowns.
Watch Closely: $0.196 support and $0.21–$0.212 resistance; reclaiming one of these defines short-term bias.
Strategy:
Consider short plays below $0.196 toward $0.18.
Consider long plays only after strong breakout above $0.21–$0.212.
Always apply strict risk controls.
—
DOGE Market OverviewAt the moment, we can see that the price failed to break above the weekly pivot point at 0.2119 early in the week and has since entered a correction. Currently, it’s consolidating in a narrow range, and we might witness a fake breakout of the trendline before the downtrend resumes toward the 0.1747–0.1889 area.
If the price breaks above and holds above the weekly reversal level, we could expect a move toward the resistance zone at 0.2349–0.2491.
The entire market is in a state of uncertainty — wait for confirmation before making a move.
