DOGE Macro Triangle Compression → Breakout PotentialDOGEUSDT has been moving inside a massive multi-year symmetrical triangle since 2021. The current price is sitting exactly on the rising macro support line — a level that has held for several years.
🔍 Market Structure
Price is retesting the long-term rising support
Volume continues to contract → classic compression phase
DOGE is moving toward the apex of the macro triangle
Higher lows remain intact within the structure
📈 My Outlook / Scenario
Over the coming months, I expect DOGE to continue consolidating along the lower support area:
Oscillating inside the triangle
Building energy as volatility decreases
Gradually squeezing toward the apex
After this compression phase, a strong upside breakout becomes highly probable, similar to previous DOGE cycles where long accumulation phases led to sharp vertical moves.
If a breakout occurs with volume confirmation, DOGE could enter a fast impulsive rally.
Trade ideas

A Possible Move For Doge ( and Also For Other AltCoins )I think we have a possible move to 1.3$ for Doge Coin, and also and the same way for other altcoins.
Whenever bitcoin's downtrend is about to end, we can expect a new upward movement.

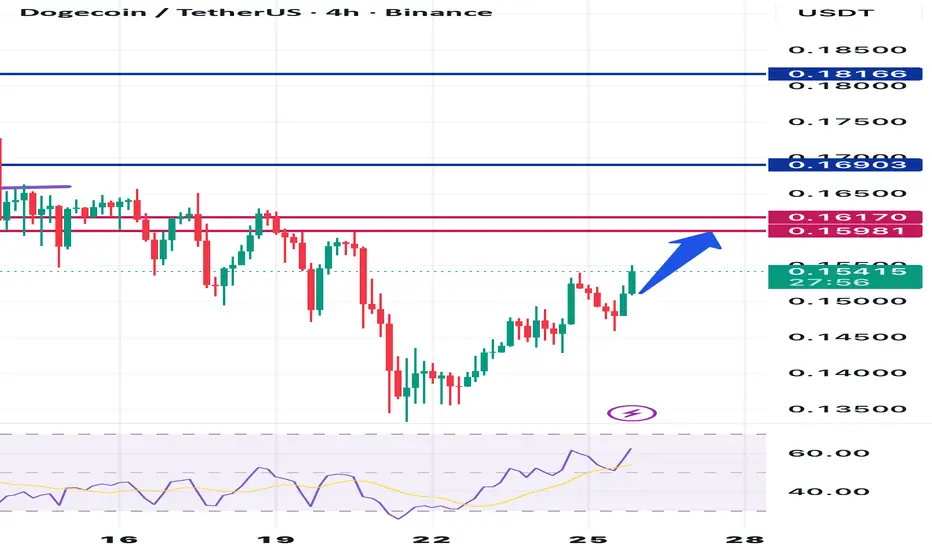
$DOGE 1H CHART UPDATE 📌If CRYPTOCAP:DOGE continues to hold this support zone below, a short-term price increase can be expected


Doge, bullish divergence on daily.Price was rejected at the daily pivot per the last report’s analysis. The downtrend is intact.
Wave (2) appears complete after the Oct 10th flash crash, just above the ‘alt-coin’ golden pocket, 0.786 Fibonacci retracement. The trend remains down, so further downside is the higher probability. Price needs to overcome the heavy resistance ahead before we can talk about being bullish long-term.
📈 Daily RSI has printed bullish divergence
👉 Continued downside has a target of the 0.618 Fibonacci retracement and High Volume Node $0.12
Safe trading

DOGE - Update: CRYPTOCAP:DOGE - Update 🟥
Charts looks terrible & resistance aren't holding! 📉
Worst case —> Deeper correction toward the 0.0950 - 0.0900$ monthly levels.
Short term:
At the moment, the current price is sitting on a daily support: 0.1300 - 0.13500$, and we could see a consolidation phase before to see the next big move! 📈👀📉
I also noticed a possible Wedge (likely a bearish accumulation structure - under resistances).
Prices could follow this pattern before the next dump? 📉👀
Long term:
Bulls must push above 0.1800$ & red resistances area!
I personally have a long position on NASDAQ:STRK wich looks much better than such bearish outlook!
#NFA 🐕 #DOGE

DOGEUSDT Time And Price AnaysisAt least until the date specified in the chart, it will be negative.
The price will definitely reach the range of 0.24752-0.25606 and the price will see this range.

LongAccording to the analysis of the waves and the help of the Gann method, it can be expected that the price will return to the green zone again.
This is my personal opinion. Please don't use it as your trading criteria. Good luck

DOGE: Final Support Before Breakdown?DOGE is retesting a major demand zone that has held since July — the same level that launched the last multi-week rally. But this time, price action looks weaker.
Here’s what stands out:
1️⃣ Price is compressing into a descending trendline
Sellers have controlled every lower high for months. Until DOGE reclaims this trendline, momentum stays bearish.
2️⃣ Blue demand zone = last structure support
This zone has been tapped repeatedly with diminishing bounces. If it fails, liquidity sits much lower and a deeper retracement becomes likely.
3️⃣ Stoch RSI is overbought while price is flat
That’s a classic bearish divergence signal — momentum is cooling while price can’t push upward.
4️⃣ Fibonacci supply zone capped the last rally
The 0.5 → 0.786 retracement zone above has acted as clean rejection structure, confirming sellers are still active on every rally.
📌 Bias:
DOGE needs a strong reaction from this demand zone to avoid a breakdown.
A clean reclaim of the descending trendline would shift momentum bullish.
A close below support opens the door to a much sharper move down.
This is a make-or-break moment for DOGE.

Dogecoin (DOGE): Back in the Lows Zone | Bullish SetupDOGE is back in the lows again, repeating the same behaviour we’ve seen many times before. Price pushed up, failed, came back to sweep the lows, and now we’re sitting in that same zone once again.
The idea is simple — if buyers step in and we get a clean market structure break from here, the upside potential opens nicely. As long as we stay above this lower zone, DOGE still has room for a strong reversal.
Swallow Academy

Dogeusdt BullishDogecoin bullish outloock, we can identify strong bullish entry at 0.3180 level. If price breaks this zone than bears target will be 0.24 zone but hope this doesn't happen.

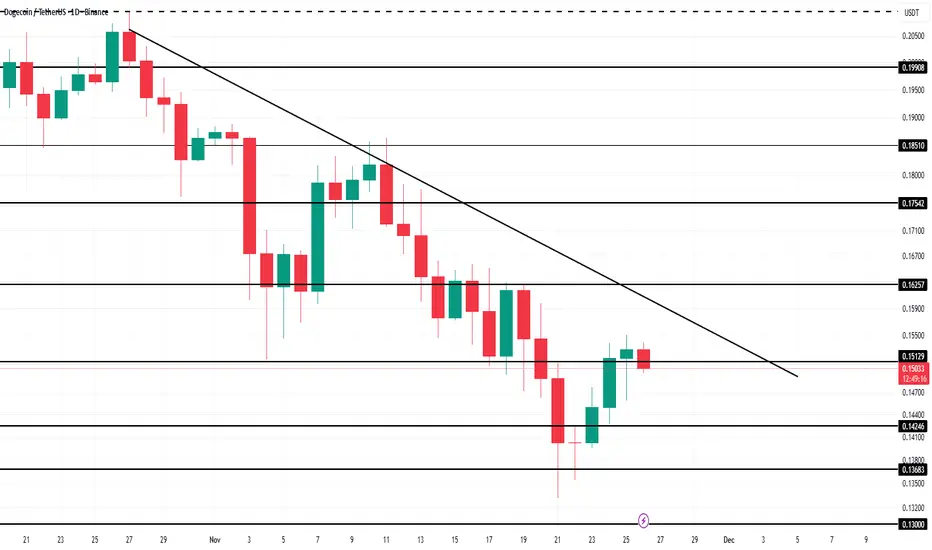
Did Dogecoin ETF Fail At Launch? Where Is Price Headed?Dogecoin is trading at $0.149, sitting just below the $0.151 resistance. The meme coin remains trapped under a persistent downtrend that has lasted nearly a month, with little evidence of a breakout forming.
Given the weak ETF inflows and bearish on-chain signals, breaking above this downtrend could be difficult. DOGE may continue oscillating under the trendline and could fall toward $0.142 if selling pressure increases.
If Dogecoin manages to attract fresh demand, however, the picture changes. A decisive breach of the downtrend could push the price above $0.162 and potentially toward $0.175. This would invalidating the bearish thesis and setting the stage for renewed momentum.
DOGE 4H – MACD Liquidity Tracker Trend SetupThis DOGE 4H chart showcases how the MACD Liquidity Tracker Strategy performs when aligned with the dominant trend, using the exact settings backtested inside Quant Trading Pro.
Backtested Settings (via QTP):
Fast MA: 25
Slow MA: 60
Signal MA: 220
System Type: Normal
Trend MA: EMA 50 (VIDYA Volatility Length 9)
With this configuration, the Trend MA (grey line) acts as the primary directional filter. Every short generated by the MACD Liquidity Tracker occurred directly beneath the Trend MA and the descending resistance, producing clean, trend-aligned setups.
Momentum confirmation through the MACD histogram and signal line allowed each position to scale efficiently into TP1 and TP2, with several moves extending deep into liquidity sweeps. This highlights the core advantage of the system: pairing a trend filter with momentum shifts dramatically increases trade accuracy.
Although DOGE is bouncing off recent lows, price remains below both the Trend MA and the descending resistance line. Until those levels break, any rally into this zone may simply set up the next continuation short using the same QTP-backed settings.
A breakout above the Trend MA would signal the first potential shift in trend strength — but as long as price stays under it, bearish setups remain favored.

DOGE/USDT - Momentum Shifts Toward the 0.105–0.093 Demand Zone?DOGE has entered one of its most decisive phases in recent months.
The chart shows the market has just lost one of its strongest technical pillars:
the primary ascending trendline that supported the entire multi-month rally.
Once that trendline broke, structure shifted from accumulation → distribution, and the momentum immediately favored the sellers.
DOGE attempted a recovery, but the retest into 0.183–0.208 was rejected aggressively, forming a classic failed bullish continuation pattern. This typically signals that market makers have chosen the lower liquidity zones as the next destination.
Price is now sitting around 0.151, caught between:
A freshly-confirmed resistance zone above, and
The major demand block at 0.105–0.093, one of the strongest historical accumulation zones on the chart.
This demand block is not random.
It is where high-volume positioning and historical liquidity clusters have repeatedly formed.
If DOGE drifts lower, this is where the next major battle will take place.
---
Key Pattern Highlights
1. Trendline Breakdown + Failed Retest
A textbook sign of a trend transition from bullish to bearish.
A failed retest often leads to a continuation selloff.
2. Consistent Lower Highs
A clear representation of seller dominance and weakening bullish momentum.
3. Deep Liquidity Wick
The long downward wick signals liquidity hunting — often occurring before price seeks a major support level.
4. Compression Toward Demand
Price structure is tightening downward, a typical sign of distribution.
---
Bullish Scenario
The bullish path is countertrend and requires strong confirmation.
Bullish structure only returns if:
1. DOGE closes above 0.183,
2. Reclaims 0.208 as support,
3. Retests the zone successfully without losing it again.
If these conditions are met, higher targets open:
0.260
0.290
0.395 (macro resistance zone)
Until then, every bounce remains a relief bounce, not a reversal.
---
Bearish Scenario
This remains the structurally dominant scenario:
1. Rejection around 0.160–0.170,
2. Breakdown below 0.148–0.140,
Opens the door toward the main target:
🎯 0.105 – 0.093 (major demand zone)
If this zone fails, DOGE may hunt liquidity as low as:
🔻 0.072 — a macro support level visible on the chart.
Because the gap between these zones is wide, downward continuation can accelerate quickly if sell volume increases.
---
> DOGE is trading below a trendline that once shaped its entire bullish structure.
The failed retest tells us the market still favors the downside.
Unless price reclaims 0.183–0.208, the primary scenario remains a continuation move toward the 0.105–0.093 demand zone — the key area that will determine whether DOGE prepares for a major rebound or extends its correction further.
---
#DOGE #Dogecoin #Crypto #TechnicalAnalysis
#PriceAction #CryptoCharts
#DemandZone #TrendlineBreak #AltcoinAnalysis
#SwingTrading #CryptoMarket

Droppin LogsGreetings, earthlings.
Nice little logarithmic action with the dizzoge. What you thinking?

$DOGE Dips to Defend – Meme Magic or Moonshot Fade?BINANCE:DOGEUSDT CRYPTOCAP:DOGE Dips to Defend – Meme Magic or Moonshot Fade?
Altcoin Pioneers! 🐕 DOGE/USDT 1H is barking at that blue descending triangle's lower edge, price clawing back from support ~0.154 after a savage rejection at resistance 0.180. Elon whispers aside, volume's thinning on the downside – classic meme coin volatility brewing.
Hold support? Woof yeah, if RSI snaps from oversold 25 with a green engulfing; could trap shorts. Breakout above resistance? Pump city on tweet fuel, targeting 0.185. Deeper dip risk? Mucho – crack it and 0.148 (Fib 0.618) howls, dragging sentiment.
Target: Quick bark to 0.162 if holds, whimper to 0.152 on break. Eyes on: Bollinger squeeze for vol burst, OBV for accumulation, and DOGE/BTC for BTC leash. To the moon or bust? 🚀📉
#DOGE #MemeCoins #TradingView
Dogecoin Forming a Macro Cup & HandleHi!
Dogecoin is developing a clear macro Cup & Handle structure, formed over several years. After the strong pole & flag rally that initiated the 2021 bull market, price spent multiple years rounding out a large cup, signaling long-term accumulation.
Price is now moving inside a descending handle, which is typical before a major breakout. A clean move above the handle’s upper trendline would confirm a continuation of the macro bullish structure.
If the handle breakout is validated, DOGE could potentially enter a multi-year expansion phase aiming toward this upper target.
The target of these patterns is around $2.80–$4.00, based on the full cup-and-handle measured move and the strength of the previous pole.


$DOGE Bouncing Off Key Support – Breakout or Breakdown?BINANCE:DOGEUSDT CRYPTOCAP:DOGE Bouncing Off Key Support – Breakout or Breakdown?
DOGE is testing the crucial 0.154 support on the 1H chart after a sharp dip, showing early signs of a bounce with increasing volume.
Bullish if it holds here—eyes on a potential breakout above 0.186 resistance targeting 0.20.
But watch for a deeper dip to 0.14 if it cracks; risk is real in this choppy market.
Key indicators: RSI rebounding from oversold (35), MACD histogram flipping positive, and rising buy volume.
Stay vigilant! 📈🐕
#Dogecoin #CryptoAnalysis #TradingView
$DOGE Channel Compression – Meme Rebound Loading?BINANCE:DOGEUSDT CRYPTOCAP:DOGE Channel Compression – Meme Rebound Loading?
Current trend: DOGE's squeezing in a tight descending channel post-pump, testing 0.15 support after topping 0.19 resistance—meme volatility on pause, but wicks show buyers lurking 🐕.
Hold support? Bullish yes; prior bounces and volume clusters at 0.15 could flip sellers if holds firm.
Breakout above resistance? Primed for 0.19 close—unleashing 8-12% hype-fueled rip 🚀.
Dip risk? Low to 0.145 on BTC drag, cushioned by oversold.
Target: Upside 0.20 on escape; downside 0.14 buffer.
Indicators tracking: RSI (35, oversold pop), Channel squeeze, and MACD crossover 📊.
#DOGETrading #MemeCoinChannel #AltcoinPioneers

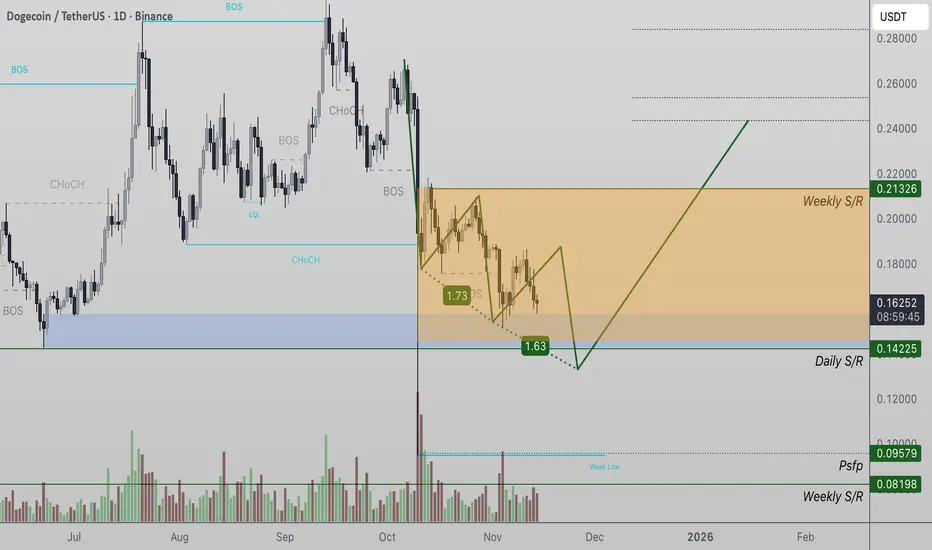
Dogecoin (DOGE/USDT) — 3 Drives Pattern Near CompletionDogecoin price action is currently trading within a developing 3 Drives pattern, signaling that the market is nearing a potential exhaustion phase. This structure opens the probability of a $0.14 retest in the immediate short term before a possible reversal.
Key Technical Points:
- Support: $0.14 (potential completion of 3 Drives pattern)
- Resistance: $0.21 key breakout level
- Bias: Bullish reversal if $0.14 holds
As long as price continues to respect the $0.14 region, the pattern remains valid and structurally intact. A third and final drive into this zone would confirm the 3 Drives formation, completing the corrective leg before a potential rotation higher.
If a reversal reaction occurs from this area with a strong reclaim candle, it would likely initiate a new impulsive wave targeting $0.21 and beyond. However, failure to defend $0.14 would invalidate the pattern and risk extending the decline.
From a technical perspective, Dogecoin is approaching a key inflection zone — maintaining the $0.14 base could mark the beginning of a broader bullish rotation as the 3 Drives setup completes.
DOGE — Double Top Forming, Possible Continuation Down?DOGE shows signs of weakness as the overall crypto market remains in a short-term downtrend. After a sharp drop earlier today, price action suggests a potential continuation move lower.
From a pattern perspective, a clear double top formed yesterday with some liquidity grabs above the highs, indicating possible exhaustion from buyers. If momentum holds, DOGE could revisit lower support levels later today or tomorrow.
No major macro or crypto-specific catalysts are on the calendar today, so price movement may remain technically driven. Watch for confirmation through volume and structure before entering.
