$DOGE Long Setup – Bulls Returning
CRYPTOCAP:DOGE is rebounding from 0.151$ , forming a bullish structure on the 1h chart. Buyers are stepping in after a healthy pullback, signaling momentum building for a move higher.
🟢 Entry: 0.1670$ – 0.1655$
🎯 Targets: 0.174$ / 0.181$ / 0.190$ / 0.2$+
🔴 Stop Loss: 0.15$
💡 Holding above 0.166$ could confirm bullish strength and pave the way for an extended push toward 0.18$ - 0.2$ Keep an eye on volume for confirmation. ✅
Trade ideas

$DOGE M45 SELL / lack of divergencePrice has been appreciating , with lack of divergence and a swing point for quite some time, leaving Traders in open long positions vulnerable
DOGEUSDT.P - November 6, 2025A breakout and close above resistance could confirm bullish momentum toward higher levels, while a rejection or drop below the ascending trendline and support may indicate a bearish reversal—trade based on how price reacts at these critical zones.

$DOGE (6-HOUR): SHORT printing, TRADE summary so farCRYPTOCAP:DOGE short doing well.
I couldn't remember if I published TP levels or not, so I asked #Grok to summarize my latest trade on #DOGE and it did an incredible job of it, actually.
Here is the summary it generated:
Latest CRYPTOCAP:DOGE Trade SummaryTrade Type: Short (Bearish position)
Open Date: November 1, 2025
Entry Price: $0.187
Rationale: CRYPTOCAP:DOGE entered bear market territory after losing key supports (200 MA + horizontal), bearish retest in a downtrend, impending death cross (50 MA below 200 MA on daily), and multiple hidden bearish RSI divergences across timeframes. Relative weakness confirmed vs. CRYPTOCAP:BTC (three bearish RSI divergences on DOGE/BTC daily). Low-leverage entry in risk-off market climate. Stop Loss Tactic: Manual, multi-part exit to manage risk:
Close 25% position on each 4-hour candle close above the 200 MA (~$0.209 at entry).
Full exit sooner if solid bullish divergences appear on charts.
Invalidated if $0.21 flips into support (potential liquidation).
Take Profit Levels: Yes, explicitly mentioned:
Level 1: $0.143
Level 2: $0.130
Level 3: $0.092
(Targets subject to adjustment based on new technical developments; bearish bias holds until $0.21 reclaimed or risk-off ends.)
Overall Bias: Bear market coin below 200 MA daily—prefer shorts below, longs above. Position active as of November 2 update; monitoring for updates.
Wow. Let me know if you want summaries of this kind more, on top of my ramblings or instead of them, lol.
👽💙

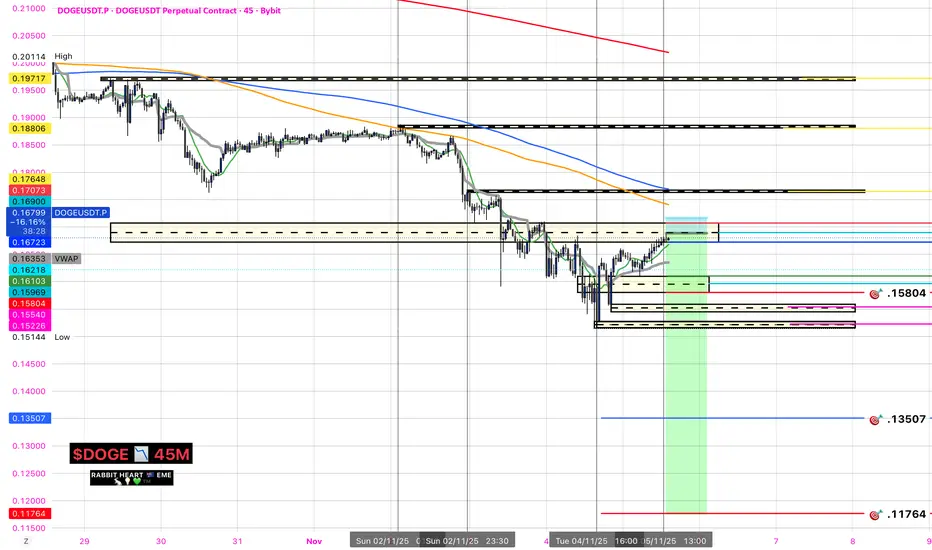
DOGEUSDT.P - November 4, 2025DOGEUSDT.P is maintaining a mixed-to-bearish market structure, with price currently consolidating near the $0.1665 region after forming a sequence of lower highs and lower lows. The projected structure suggests a potential push higher toward the $0.1709–$0.1737 resistance zone before a possible reversal lower. A rejection from this zone could accelerate a move back toward the $0.1594 support area, aligning with the broader bearish bias. However, a sustained breakout above $0.1737 would invalidate this outlook and signal a shift toward short-term bullish momentum.

Dogecoin Tests Swing Low: Reversal Needed to Avoid CorrectionDogecoin price action is currently testing a key swing low, a level previously identified as a weak low during prior consolidation. The market is once again probing this region, where a new low may be established — making it a critical area for potential reversal or further downside continuation.
A quick reclaim of this region is essential for any bullish reversal to develop. Failure to do so would likely open the probability for a deeper corrective move, as liquidity resting below this level could be taken out before a broader recovery attempt.
Key Points:
- Swing Low Test: Price is revisiting a previous weak low, marking an inflection zone.
- Reversal or Breakdown: A reclaim here is needed to signal strength; failure increases downside risk.
- Liquidity Risk: Sub-low liquidity could attract further sell pressure if support fails.
From a technical perspective, Dogecoin sits at a key trade location — one that will likely determine the next major directional move.
What to Expect:
A successful reclaim of the current swing low could trigger a reversal back upward, while continued weakness below this zone would expose lower liquidity targets and confirm a bearish continuation for Dogecoin.

DOGECOIN. USDTDogecoin could gradually decline to 12-13 cents.
However, if the market turns bearish, it will fall back to 10 cents.
In any case, a drop of 3-4 cents is guaranteed.
Considering that Ethereum could potentially fall to $3,400, and Bitcoin to $102,000/$101,000/$100,000/$99,000, therefore, a drop in Dogecoin between 10 and 14 cents seems inevitable.
So, every decline is a buying opportunity, and every green candle is just bait for emotional buyers.

Elon Musk's favorite coin DOGEElon Musk's favorite coin CRYPTOCAP:DOGE #DOGE 🪙 also has a pretty good long setup.
The trade is 1 to 2.
Entry: $0.18684
Take Profit: $0.20940
Stop Loss: $0.17540
Based on the liquidation map, the trade is justified. A lot of liquidity has piled up above.

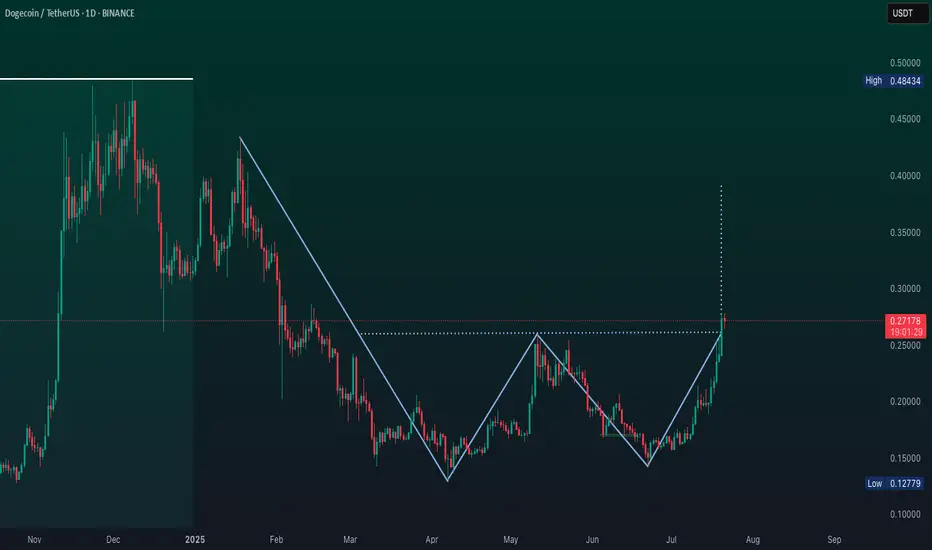
DOGECOINAfter a strong rally at the beginning of 2025, Dogecoin is in a downtrend within a broader consolidation phase.
The past 5–6 weeks have shown lower highs and lower lows, confirming a bearish phase within the wider range.
It is currently testing the critical support at 0.174, which marks the boundary between consolidation and a potential continuation of the decline.

Long setup is neutral biased now.Price is reacting inside a corrective pullback after impulsive downside.
Trade idea is based on multi timeframe Bias Matrix alignment.
Deep TF and DD TF are still negative so long exposure must be reduced.
Only NOW TF is showing early micro reversal potential.
Risk is defined below the last micro swing low.
Target zone is placed at the next structural liquidity cluster above.
Idea text (în engleză formal, profesional, eficient):
Trade Idea: DOGEUSDT Long Attempt – Neutral Probability Setup
The market is currently in a corrective pullback phase after a strong downward impulse. The multi timeframe Bias Matrix shows a neutral overall result: the higher timeframes remain bearish, but the NOW timeframe is showing a potential micro rotation. This entry is speculative and requires strict risk control.
Setup: Long attempt inside retracement zone
Reasoning: Local reversal signal on NOW TF while price is still in the lower liquidity band
Risk Control: Stop below the recent swing low
Target: Next liquidity cluster above current price
Notes: This is not a high confidence setup. Bias becomes more valid if the DD timeframe flips positive.
Conclusion: This is a controlled risk attempt to capture a short term bounce while macro bias remains bearish.

$DOGE (6-HOUR): ANOTHER WYCKOFF distribution variant, SHORTAnother chart and another variant of a WYCKOFF DISTRIBUTION schematic — this time on the medium-term CRYPTOCAP:DOGE charts.
Crypto is absolutely riddled with distribution patterns these days. Across all timeframes: I’ve shown you the clear 5-year CRYPTOCAP:DOT distribution, the current-cycle $RENDER distribution schematic, and the short-term $EVAA distribution setup.
Serious capital has been leaving crypto. You’ve seen rallies in metals, big stocks, and the Nasdaq — but not in crypto.
Cryptoville is Distribution-ville right now. Just my two cents.
As for the #DOGE mid-term charts (4H/6H), HIDDEN BEARISH divergences keep popping up on the 4-hour. The next leg should be DOWN, with the next SUPPORT at 17.5c.
Lose that, and my SHORT is going to start PRINTING.
💙👽

Woof Woof — Bulls on the Roof?I’m expecting Dogecoin to rise from the current levels toward 0.20400 🎯
❌The invalidation zone for this plan is set at 0.18375
Let’s see if the bulls can push it higher from here 🐶🚀

Dogecoin Bounces from Value Area Low, higher next?Dogecoin price is showing a local bounce after successfully testing the Value Area Low (VAL) of its current trading range. This reaction indicates that short-term buyers are defending the lower boundary, but the next move will depend heavily on how price behaves around the Point of Control (POC) — a major resistance that must be reclaimed on a closing basis for continuation to the upside.
If Dogecoin fails to close above the POC, the likelihood of a rotation back toward $0.16 increases. Such a move would likely take out weak lows and absorb resting liquidity below the range before any meaningful reversal attempt occurs.
Key Points:
- Support Reaction: Local bounce confirmed at the Value Area Low of the range.
- Major Resistance: The Point of Control must be reclaimed for bullish structure to resume.
- Downside Risk: Failure to reclaim POC could lead to a liquidity sweep toward $0.16.
From a structural perspective, the market remains neutral-to-bullish as long as the VAL holds.
What to Expect:
Watch for a decisive close above the POC to confirm bullish momentum. Otherwise, expect range-bound movement or a liquidity grab near $0.16 before a potential rotation back upward.

$DOGE (DAILY): lost the 200 MA + horizontal SUPPORT: SHORT 18.7cCRYPTOCAP:DOGE is now a BEAR MARKET coin and I'm shorting it at $0.187.
Similar story to CRYPTOCAP:XRP after both have lost their confluence of supports (200 MA + horizontal) and bearishly retested, in DOWNTRENDS, DEATH CROSSES (50 MA to cross below 200 MA) on the DAILY chart, HIDDEN BEARISH RSI divergences on many timeframes, a lot of stuff and nearly all of it — bearish.
Low-leverage #short with a manual STOP LOSS: I will close in 4 parts, 25% on each 4-HOUR candle close above the 200 MA ($0.209 atm), or sooner if any solid BULL divergences occur.
There is no intent on the chart; buyers never stepped in in OCTOBER and are unlikely to do so anytime soon.
Risk-off climate across all markets, not surprised that the KING #memecoin has been entering its BEAR MARKET territory. And many other coins look very similar.
Anything below the 200 MA on a DAILY chart, I would rather not LONG as long set-ups tend to fail too often. Longs above 200 MA, shorts below 200 MA — this is the approach.
💙👽

Shorty the pimpOnce again, throwing ideas out there. Hate that there is a possible downswing with doge. I like the coin. Don't take my info as gold...total rook...dyor
Good luck boyzzzz

It's disappointing !!!Do you think this will happen, or do you see DOGE below $0.14 in the future?
Best regards CobraVanguard.💚

DOGE daily timeframe updateOn-Demand Analysis: ❤️Like this post for more analysis!:
CRYPTOCAP:DOGE ’s surge combines a technical breakout, institutional validation, and sector rotation. While overbought signals suggest potential consolidation, the $0.25-$0.27 zone now acts as solid support
Support Zone: A strong base is at 0.2500-0.2700, where buyers might step in.
Resistance Level: The next big test is at 0.48434—break that, and it could climb higher!
Falling Wedge: This pattern, with its narrowing lines, often signals a bullish move if it breaks above 0.48434.
Momentum: The uptrend has steady volume, boosted by market activity.
Timeframe:Watch the next few days for the wedge to break out.
Possibilities:
Bullish Move: A jump above 0.48434 with good volume could push it to 0.5000 or more!
Bearish Drop: A fall below 0.2500 might take it back to 0.19621—stay careful!
Safety Tip: Set a stop-loss below 0.2500 to stay safe.
Dogecoin Witnesses Death Cross After 3 Months As Price Falls BelAt the time of writing, Dogecoin’s price sits at $0.185, holding just above its immediate support level. However, the bearish signals from both EMAs and whale behavior suggest a continued slide may be ahead.
If momentum weakens further, Dogecoin’s price could drop to $0.175 or even $0.165. This decline may trigger panic selling among retail traders, intensifying market losses and delaying any potential recovery.
Alternatively, a swift rebound could see Dogecoin reclaim $0.199 and potentially breach $0.209. Such a move would invalidate the bearish thesis and restore some investor confidence, signaling renewed market participation and short-term stability.
winter is comingIll keep this simple, after this wick of today the close of tomorrow should be a entry for long, I think that price will be at least mid range and we should be looking forward to day 14th november, we topping close to that but we need to keep an eye on the markets. Remember yourself to sell because unrealized profits arent yours and market doesnt need to have them back. If it feels like its too much press "close position"
Also the RSI is between 6 points of the MA so it historically means a good entry

DOGECOIN H1 SELLAfter a sharp decline and a slow correction, I expect the price to fall to the specified target.

DOGE/USDT Short Set-upDOGE/USDT Short
— A triangle has formed, a technical accumulation pattern entered after a drop, which typically plays out as a trend continuation. There’s also support from divergences on the 1-hour timeframe, plus a major short signal from the market index hasn’t been realized yet.
— Entry: $0.20 (market sell)
— Stop: $0.215 — 7% is the price movement from entry to stop, NOT the loss percentage.
— Target: $0.172
Risk per trade: 0.5% of total balance — this is the loss percentage.
Position size: 8% of total balance, leverage 10x
RR 1:2

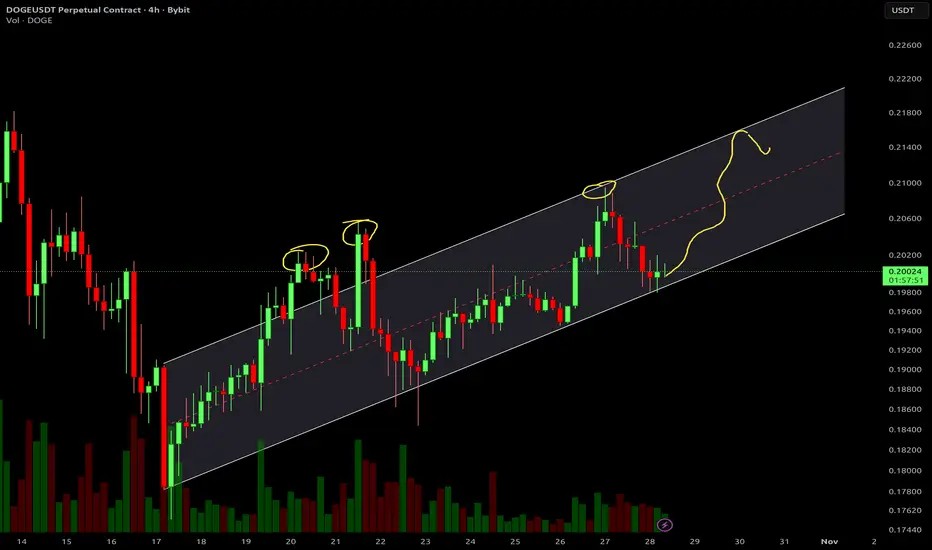
DOGE Channel BreakoutDOGE is in the bottom of an upward channel. It looks ready to re-enter the top of the channel
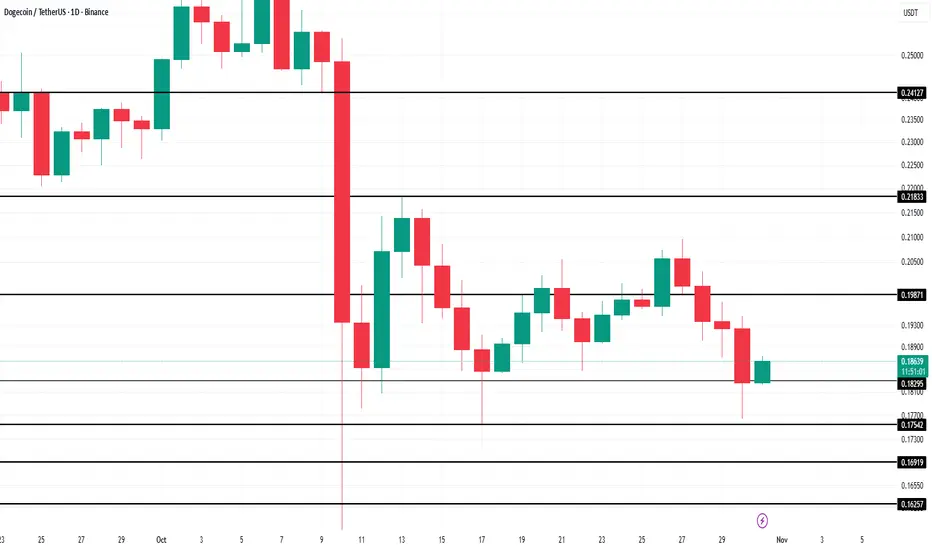
DOGEUSDT.P - October 28, 2025Price consolidating within a range, with bullish potential if price breaks above the $0.218 resistance, targeting the $0.28–$0.30 zone. Conversely, a rejection here and breakdown below $0.175 could trigger a deeper retracement toward $0.09 support.
