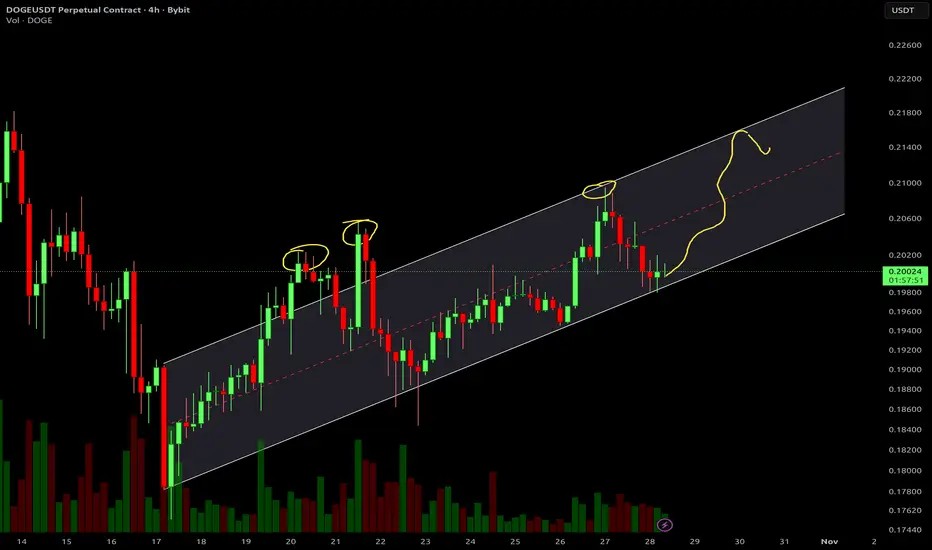
DOGE Channel BreakoutDOGE is in the bottom of an upward channel. It looks ready to re-enter the top of the channel
Trade ideas
DOGEUSDT.P - October 28, 2025Price consolidating within a range, with bullish potential if price breaks above the $0.218 resistance, targeting the $0.28–$0.30 zone. Conversely, a rejection here and breakdown below $0.175 could trigger a deeper retracement toward $0.09 support.

Lingrid | DOGEUSDT Swap Zone Resistance Shorting OpportunityBINANCE:DOGEUSDT rebounded off the support band and is now pressing into the 0.2100 swap-resistance inside a broader downtrend. Price action is carving a rising pullback channel toward the descending trendline and the upper boundary of the downward channel. If 0.2100–0.2120 caps price and the trendline holds, a fade toward 0.1750 (buying area/channel base) is likely Bearish momentum persists with lower highs intact; the down-channel bias remains until a decisive daily close above 0.2100 flips the outlook.
⚠️ Risks:
Breakout and hold above 0.2100–0.2120 could trigger a squeeze toward 0.225–0.230.
Broad crypto risk-on (e.g., strong CRYPTOCAP:BTC leg) can invalidate a fade setup.
Thin-liquidity spikes around month-end/rebalancing may cause overshoots of levels.
If this idea resonates with you or you have your own opinion, traders, hit the comments. I’m excited to read your thoughts!

dogeThis issue stems from a very specific issue in TradingView: When you make the chart "view-only" (i.e., viewable via a share link), the chart data can stream live, but the indicators' runtime engine is disabled.
I'll explain in detail below why this happens and how to fix it.

+++This issue stems from a very specific issue in TradingView: When you make the chart "view-only" (i.e., viewable via a share link), the chart data can stream live, but the indicators' runtime engine is disabled.
I'll explain in detail below why this happens and how to fix it.

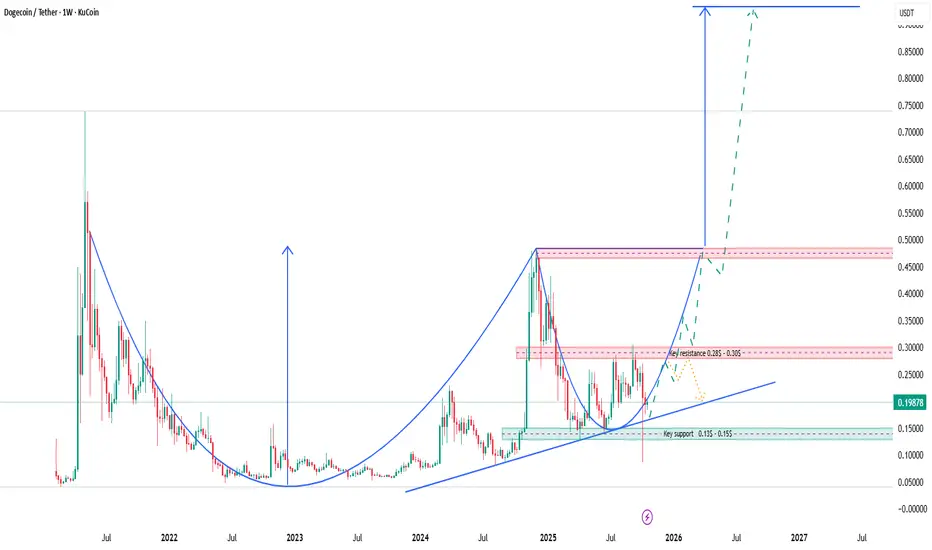
Dogecoin (DOGE/USDT) Technical Overview (Weekly Trend)Dogecoin remains in a long-term accumulation phase between $0.13–$0.30. The current price around $0.20 shows stabilization after a major correction.
Key support: $0.13–$0.15 (strong historical zone)
Key resistance: $0.28–$0.30 — a breakout above could open the way to $0.45
Price is sitting near the 50-week MA, which may act as dynamic support.
Daily Trend:
DOGE is consolidating around $0.19–$0.20, forming a descending wedge, often a bullish reversal pattern.
RSI shows reduced selling pressure — momentum is building.
A breakout above $0.22 could trigger a move toward $0.27 → $0.30.
Losing $0.18 may lead to a retest of $0.15.
Scenarios:
Scenario Description Targets
🟢 Bullish Break above $0.22 $0.27 → $0.30 → $0.45
🔴 Bearish Drop below $0.18 $0.15 → $0.13
⚪ Neutral Range between $0.18–$0.22 Sideways until late November
Summary Quote :
“Dogecoin is charging up for its next move. A breakout above $0.22 could mark the start of a fresh rally toward $0.3 and beyond.”
DOGE - PERFECT SETUP? My #DOGE setup is playing well for now! 📈
Clean Trend breakout ✅ - It's Time to let the magic happen? 🚀
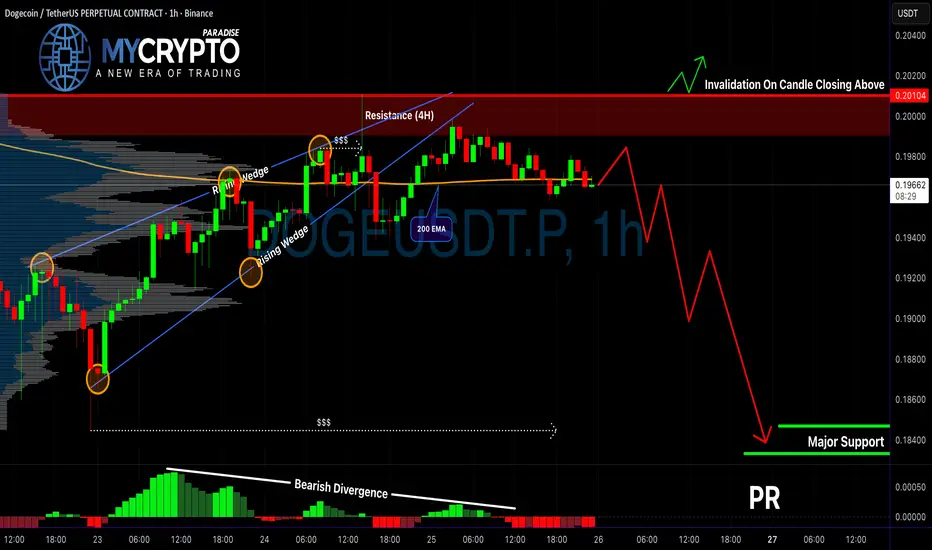
DOGE Is Setting Up for a Trap?Yello Paradisers, are you thinking of shorting DOGE right now? Be careful—this setup might look obvious, but it could also be the start of a classic trap. Let’s dig into what the charts are really telling us.
💎DOGEUSDT is currently reacting from a strong 4H resistance zone, which already gives us an early warning of potential rejection. Zooming into the 1H timeframe, price has broken down Rising wedge with bearish divergence. This isn’t just a random move; it's supported by confluence, especially with the 200 EMA acting as dynamic resistance on the 1H. That kind of layered rejection significantly increases the probability of a further bearish continuation.
💎For aggressive traders, there’s a potential to enter at the current price, but that comes with higher risk. For those who prefer a safer approach, the better play is to wait for a proper pullback and retest of the resistance zone. If the price returns to that level and forms a bearish candlestick pattern, it could provide a much cleaner and higher-probability short setup—along with a bigger reward-to-risk ratio.
💎However, if DOGE breaks out and closes a candle above the resistance zone, this would invalidate the entire bearish scenario. In that case, we’ll need to stay patient and wait for more reliable price action before making any decisions.
🎖Strive for consistency, not quick profits. Treat the market as a businessman, not as a gambler.
MyCryptoParadise
iFeel the success🌴
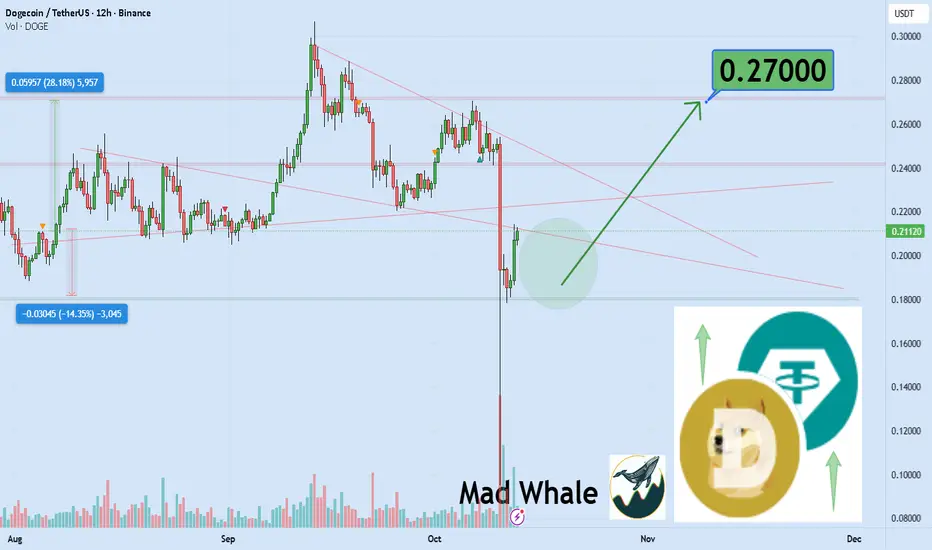
0.27$ is next target for Doge hi
the support and resistances on the chart are based on the previous data and weekly candlesticks if COINBASE:DOGEUSDT holds this last support the potential of 28% gain is logical toward 0.27$
DOGE - BULLISH BREAKOUT AWAITEDCRYPTOCAP:DOGE - price analysis:
Similar vibes as yesterday:
Neutral PA, and price remain stuck under many big resistances.
I see a potential daily uptrend channel .
Hence, Bulls may be in control above the 0.1800$ - 0.17500$ suppor (daily basis).
Above this level, I can expect to see a bull breakout to visit upper resistances:📈
🎯0.2280
🎯0.23500
🎯0.25500
🎯0.26400 (to fill the previous gap)
Sum up:
My bias: bullish inside the uptrend channel daily 📈
In case of bearish candle close daily under 0.17500$, would love control ==> Lower key demand zone: 0.1650 - 0.1400$
Medium term outlook & possible setup in my chart.
. Timing is important. #DYOR

DOGECRYPTOCAP:DOGE is setting up for a major move, likely breaking out within the next 150 days. The first key target is the 42-cent resistance level, and how it reacts there will be crucial. If momentum continues, the next major target sits at $1, classic DOGE cycle setup.

Dogecoin Holds Above 16¢ Value Area High — Accumulation HintsDogecoin price action is showing early signs of recovery, now trading above the value area high at $0.16, a critical level that must hold to sustain bullish continuation following the recent capitulation move. Multiple consecutive candle closes above this region confirm that buyers are defending it, hinting toward ongoing accumulation.
The reclaim of this zone marks a significant structural shift, as it aligns with the value area low from the prior range — forming strong technical confluence. This suggests that the market may be transitioning from distribution into a re-accumulation phase.
Key Points:
- Value Area High Support: $0.16 holds as key continuation support after the reclaim.
- Technical Confluence: Alignment between VAH and VAL reinforces structural strength.
- Next Resistance: The Point of Control (POC) is the next target before potential expansion.
If DOGE can reclaim the POC, it could trigger an accelerated move toward $0.26, the upper boundary of the broader trading range. Until then, price action may continue oscillating within this consolidation band.
What to Expect:
As long as $0.16 holds, expect DOGE to maintain a rotational range between $0.16 and $0.26, with upside momentum strengthening on a decisive POC breakout.

Time to buy or time to panic on crypto!?Is this the moment to run away, or the one to stay calm?
Isn’t the collective fear itself the signal we’ve seen before every comeback?
In a market ruled by emotions, sometimes you just need to take one step away from fear.
Hello✌️
Spend 2 minutes ⏰ reading this educational material.
🎯 Analytical Insight on Dogecoin:
BINANCE:DOGEUSDT has breached all key Fibonacci supports and now rests on a critical daily support level. If this holds, a potential 30% upside toward 0.25 becomes likely. 📊🛡️
Now , let's dive into the educational section,
💭 The psychology of fear in the market
When charts turn red, traders’ minds fill with panic. But markets are places where some people’s fear becomes others’ opportunity. Emotions are the biggest enemy of logic. Every downtrend is a redistribution of emotions, not necessarily the end of a trend.
📈 The cycle of greed and fear
The market constantly swings between greed and fear. When greed rises, prices grow beyond value; when fear dominates, assets fall below it. These extremes are where smart money buys, while newcomers sell.
🔍 Signs of a possible reversal
Rising volume near support zones, reversal candles on higher timeframes, and positive RSI divergence are key indicators of potential trend change. When prices stop falling but sentiment remains negative, that’s often when smart capital quietly starts moving in.
🧠 The mindset of a successful trader
A strong trader looks for opportunity when fear dominates. They enter with a plan, not emotion. The market rewards the patient, not the impulsive. They always have a scenario, rely on data over rumors, and let logic guide their trades.
⚙️ Entry and risk control strategy
During any bearish phase, the first step is to identify confirmed support levels. Then use staged entries to reduce exposure to volatility. Set your stop loss below recent structure and keep targets realistic. You can’t control the market, but you can always control your risk.
💡 Why now looks like a buying zone
Sentiment is dark, yet technicals reveal weakness in sellers’ momentum. The ratio of selling to buying volume is shrinking, and reversal candles are forming on key levels. The market is quietly building a new base. When everyone talks about collapse, smart money prepares for the next leg up.
🧭 TradingView tools that help confirm the move
The TradingView platform offers multiple indicators that give traders a practical edge.
• RSI (Relative Strength Index): Helps identify oversold and overbought zones clearly.
• Volume Profile: Reveals where the most trades occurred, highlighting real buyer–seller strength.
• Moving Average Cross: A simple but powerful signal for trend reversals.
• Fear and Greed Gauge: Tracks overall market sentiment in real time and shows when emotions are overreacting.
Using these tools together provides a complete perspective. Traders who analyze them in combination often spot reversals earlier than the crowd.
🔔conclusion
The crypto market is deep in a fear phase, and that’s usually where the best setups form. Fear creates the base for opportunity always has, always will.
💬 Three golden pieces of advice
1. Enter the market with a plan, never with emotion; every unplanned trade is a costly one.
2. Master patience the market always rewards those who wait for clarity.
3. Ignore collective fear; trust your data, your structure, and your logic.
✨ Need a little love!
We pour love into every post your support keeps us inspired! 💛 Don’t be shy, we’d love to hear from you on comments. Big thanks, Mad Whale 🐋
📜Please make sure to do your own research before investing, and review the disclaimer provided at the end of each post.

DOGEUSDT the heavy pump soon again will start Price action has conclusively broken below the key descending trendline (marked in red). Following a standard retest of this breached level as new resistance—a classic technical phenomenon—the asset experienced a significant downward impulse. This sell-off appears to have concluded, having likely exhausted the underlying selling pressure.
We are now monitoring for a potential shift in market structure. Soon again if price mange to get back above that trendline(above 0.21$) then market is again bullish and massive pump ahead.
Should this occur, it would constitute a robust bullish signal, indicating that buyers have regained control. Such a breakout would invalidate the prior bearish breakdown and likely trigger a short squeeze, fueling a strong upward momentum. The initial measured move target from such a breakout structure projects a rally toward the $0.40 resistance zone, which represents the next significant technical objective on the higher timeframe.
DISCLAIMER: ((trade based on your own decision))
<<press like👍 if you enjoy💚

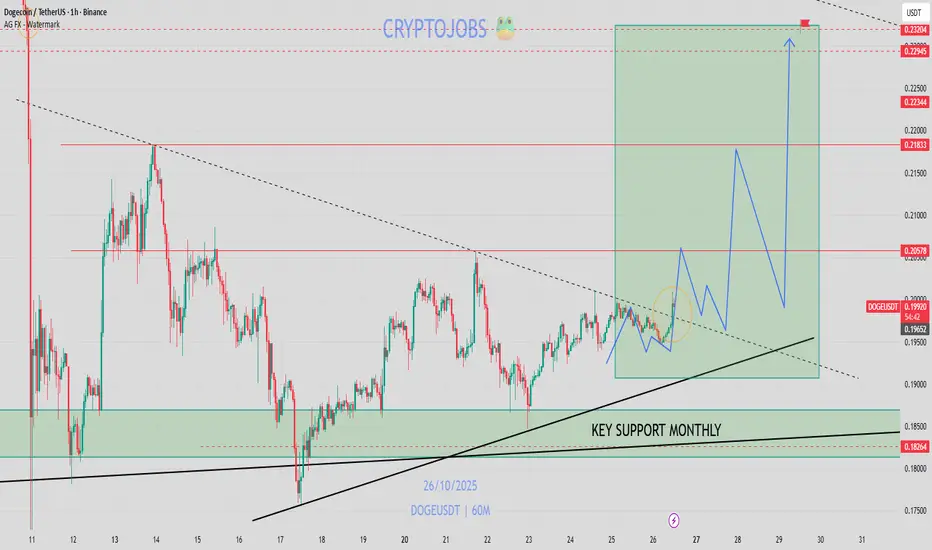
DOGE analysis:#DOGE
Price is currently moving sideways and forming a range. A candle closing above the $0.2150 level is considered bullish, and we will enter a long position after confirmation. This is a no-trade zone, so it’s better to wait for some time before making new trades.

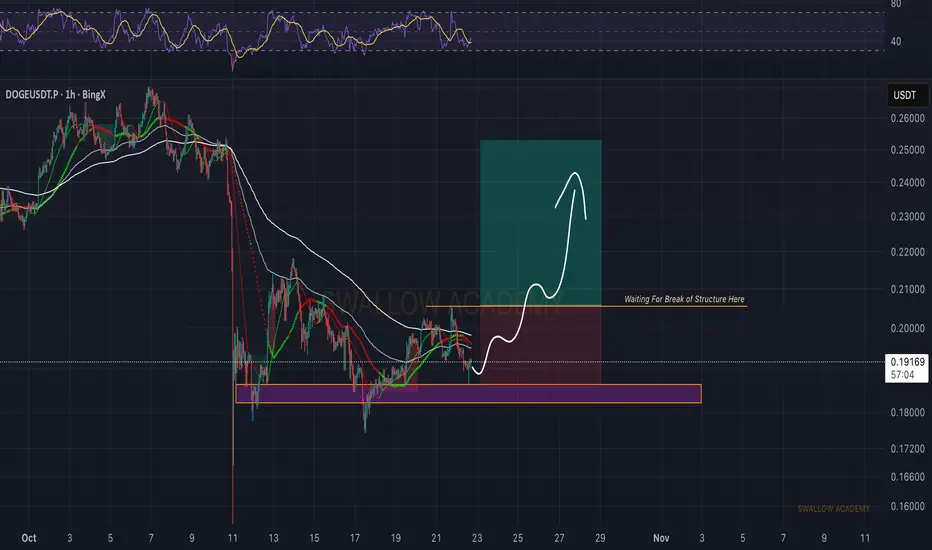
Dogecoin (DOGE): Waiting is Key | Expecting Bullish MovementDOGE continues to bounce from the local support zone, where buyers are holding it well for now. What we’re waiting for is a proper BOS — that would confirm buyers taking control and securing the EMAs at the same time.
Once that happens, we’ll expect a decent push to follow. Until then, patience, as the setup is still developing.
Swallow Academy
Altcoin season is going to be crazy. I noticed the hard drop was similar to the BTC/USD around the 2020 bullrun.
If this is not it then i am wrong. I am full GREEN. Load up your alts.

DOGE/USDT Long setupDOGE/USDT Long – Countertrend Setup
— Technical signs of a potential bottom and level retest: wedge pattern, hourly timeframe divergences, similar formations across many altcoins.
— Entry: $0.188 (market buy)
— Stop: $0.176 (-6%)
— Target: $0.215
Risk per trade: 0.5% of total balance
Position size: 8% of total balance, 10x leverage
RR: 1:2.5

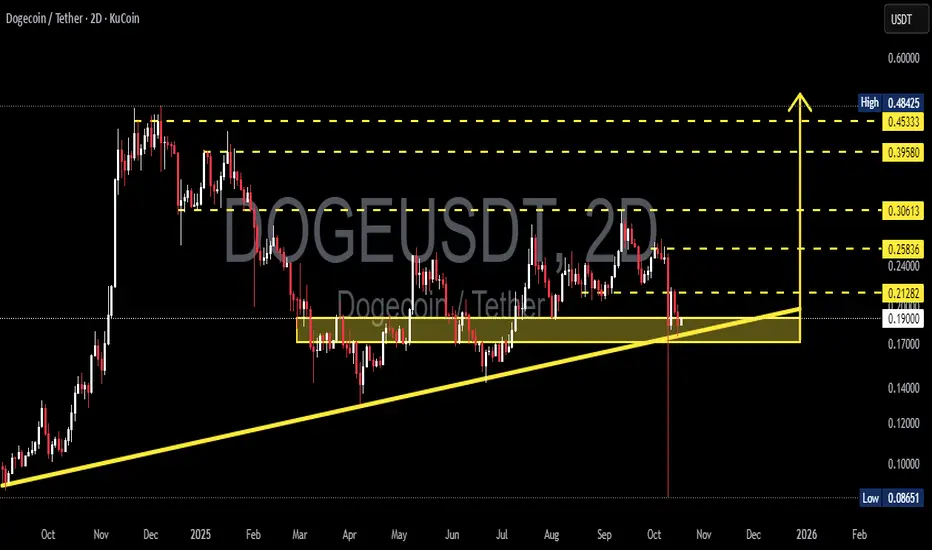
DOGE/USDT — On the Edge of a Major Reversal or a Deep Breakdown?DOGE is currently standing at the most critical zone of 2025. The price is testing the key confluence support area (0.171 – 0.190), reinforced by a mid-term ascending trendline.
This isn’t just a line — it’s the last stronghold for the bulls since early this year.
Each time DOGE has touched this yellow zone, buyers have stepped in aggressively. But this time feels different — selling pressure is intensifying, and the latest 2D candle shows a weak reaction at support.
The market is waiting for a major decision: reversal or deeper collapse.
---
🔹 Structure & Pattern
The chart shows a clear ascending accumulation base that has been forming for nearly a year.
The ascending trendline has acted as the backbone of accumulation since October 2024.
The horizontal range between 0.171–0.190 forms a macro demand zone that has repeatedly absorbed selling pressure.
However, the failure to break above the 0.258–0.306 resistance range reveals weakening bullish momentum.
At this point, price action is “dancing on the edge” — where just one decisive candle close could determine DOGE’s direction for the next few months.
---
🟢 Bullish Scenario: “The Bounce from the Abyss”
If the 0.171–0.190 zone holds and triggers a strong rejection, DOGE could launch a sharp reversal move.
Bullish confirmation:
Strong rejection from the yellow zone + 2D candle close above 0.2128.
Rising buy volume indicating re-entry by mid-term buyers.
Upside targets:
1. 0.2128 (initial confirmation)
2. 0.2583 (mid-range supply)
3. 0.3061 (key resistance)
4. 0.3958 – 0.45 (mid-term euphoria zone)
A breakout above 0.306 would likely trigger a trend continuation phase, targeting 0.45–0.48 as a mid-term expansion zone.
---
🔴 Bearish Scenario: “Crack in the Foundation”
If the price fails to hold above 0.171 and closes below the ascending trendline, this could signal the start of a large-scale distribution phase.
Bearish confirmation:
2D close below ~0.165 with strong sell volume.
Failed retest attempt back into the 0.171–0.190 zone.
Downside targets:
0.14 (minor support)
0.12 (final demand zone)
<0.10 (macro structural low at 0.0865)
If this scenario unfolds, DOGE may enter a long-term re-accumulation phase, awaiting fresh participation from institutional or “smart money” buyers.
---
⚖️ Technical Summary
DOGE is now at a macro trend decision point.
The yellow area (0.171–0.190) represents the last defensive wall for the bulls.
A breakdown below this zone = red alert for deeper correction.
But a strong rejection from this level could ignite a multi-week reversal rally toward 0.30+.
For swing traders, this is a golden zone to wait for confirmation.
For scalpers, this is a high-volatility range to capture short-term bounces.
---
#DOGE #DOGEUSDT #Dogecoin #CryptoAnalysis #TechnicalAnalysis #CryptoTrading #PriceAction #SupportResistance #Breakout #BullishScenario #BearishScenario #AltcoinAnalysis #TrendReversal #CryptoChart #SwingTrade
DOGEUSDT soon again above 0.25$I am looking for some gain and rise again here because market is still healthy and the reason of that is the dump we had because so many leverage players get kicked too.
Major support now is 0.14$ and if that hold then huge gain will lead here like green arrows but below that support market would be bearish and dead for a while.
DISCLAIMER: ((trade based on your own decision))
<<press like👍 if you enjoy💚

DOGE - BEARISH MOMENTUM. #DOGE - price analysis:
Main trend remain bearish & the current price is stuck under the H4 downtrend📉
H4 DOJI. .
Upper big resistances:
0.19500 - 0.200 - 0.2100$
Local support (double bottom D1): 0.1750 - 0.17600$
As long as bulls remain stuck under 0.200$ on the daily basis, we may see another could see another dump to visit the 0.1500$ support area! 📉
To sum up:
Indecision phase with big volatility, but momentum is bearish.

DOGE market snapshotDOGE is showing signs of a potential pause — possibly a wedge and forming convergences. There’s a chance for a long setup.
The short signal on BTC is putting pressure, of course. If we manage to reclaim 108K now, the chances of BTC making a new high will increase. If the daily close is weak, the drop will likely accelerate. The next few days are critical.

DOGE/USDT Long Set-upDOGE/USDT
— Testing key support at $0.20, this is the third major test. Trendline support. Showing relative strength compared to other altcoins. No technical short signals. Open interest imbalance in favor of shorts.
— Entry: $0.204 (market buy)
— Stop: $0.18 (-11%)
— Target: $0.265
Risk per trade: 0.3% of total equity
Position size: 3% of total equity, 10x leverage
RR 1:2.9
