DOGE Approaching Support – Potential Spot Long SetupDogecoin is currently trading around $0.1935, hovering near a key support zone ($0.18 – $0.20) that has historically held well. This area may offer an opportunity for a spot long entry, but the broader market remains fragile following last week's sharp sell-off. No clear higher-timeframe trend has emerged yet, so caution is warranted, and risk management must be prioritized.
💡 Trade Idea
Entry (Ladder In): $0.18 – $0.20
Take Profit Zones: $0.24 – $0.29 and $0.37 – $0.44
Stop Loss: Tight, just below $0.17
Trade ideas

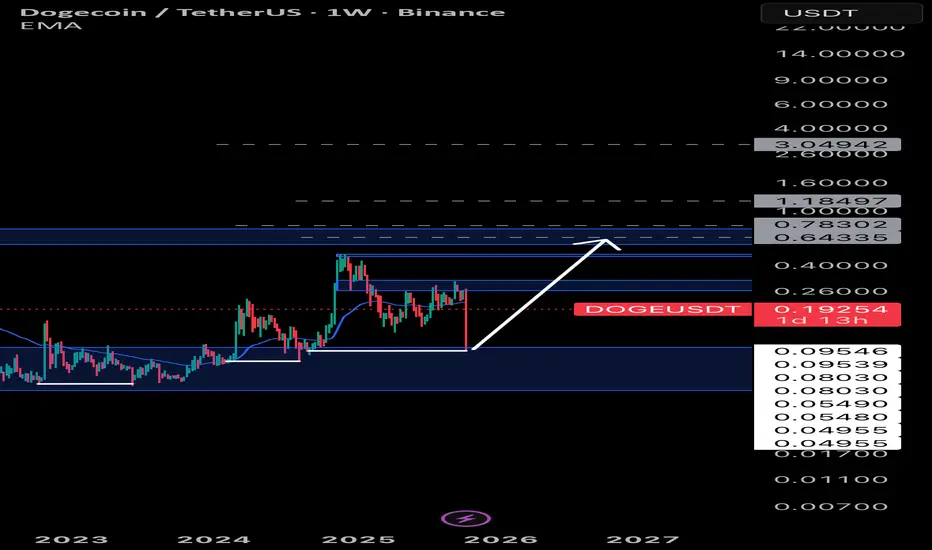
DOGEThat wick down on CRYPTOCAP:DOGE just under $0.10 would’ve been a dream entry if it filled. The measured move from the breakout targets around $0.60, which I expect to play out within the next 3 months if momentum continues.

DOGE market snapshotDOGE held the $0.20 level surprisingly well. If BTC makes another push toward new highs, there’s a solid chance for a bounce.
Targets: $0.30 — and if it breaks out, $0.50.
Strong potential setup. 🚀

DOGEUSDT 0.4$ is now easy target after stop loss hunting Boom daily major supports and weekly supports get touch previous day but only for a few minutes and now market is ready for 0.4$ because all leverage traders are out now.
Notice: my personal view about that red reject candle in market the news did dump price but now one expect dump like that and i think this was market manipulation before something big which is coming and was cooking and this liquidation was needed to hunt and kick all traders with leverage even those smart one with low leverage on alts.
DISCLAIMER: ((trade based on your own decision))
<<press like👍 if you enjoy💚


Lingrid | DOGEUSDT Range Bound Market AnticipatedThe price perfectly fulfilled my previous idea . OKX:DOGEUSDT dropped sharply after forming a lower high near the resistance trendline, confirming a clean breakdown from its triangle formation. The market is now consolidating near the support zone. A sustained hold above 0.180 could initiate a rebound toward 0.231 as momentum stabilizes. Recent volatility seems corrective in nature, implying that price may attempt a recovery once consolidation completes.
⚠️ Risks:
Broader market weakness could extend the correction phase.
Failure to hold 0.182 support may trigger deeper retracement.
Any negative crypto sentiment or BTC pullback could delay recovery.
If this idea resonates with you or you have your own opinion, traders, hit the comments. I’m excited to read your thoughts!

Taking a trade on DOGE/USDT’m a new trader and just started sharing my experience here. This is not financial advice, so take your own risk
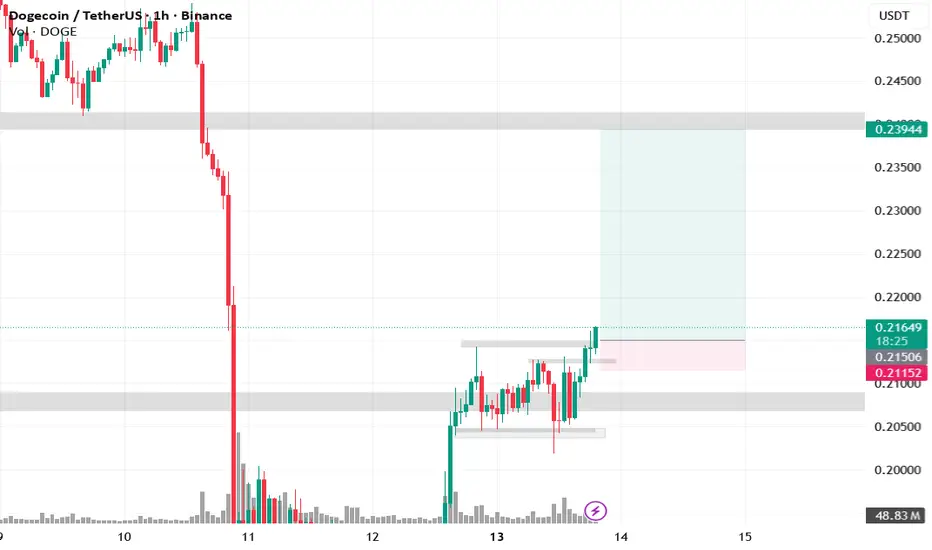
Taking a trade on DOGE/USDTI’m a new trader and just started sharing my experience here. This is not financial advice, so take your own risk

Taking a trade on DOGE/USDTI’m a new trader and just started sharing my experience here. This is not financial advice, so take your own risk

Dogecoin BullishThis one’s for the crypto enthusiasts 👇
Dogecoin recently reacted strongly at a key weekly market structure level, showing multiple signs of a bullish shift in momentum.
As we move into December, the broader sentiment appears to favor continued upside potential.
I’ll also be sharing my thoughts on Bitcoin, given the strong historical correlation between the two assets — worth keeping an eye on both.
What are your thoughts — do you see further continuation or a short-term retracement first?
#Pipmultiplier #Dogecoin #Crypto #Bitcoin #TradingView

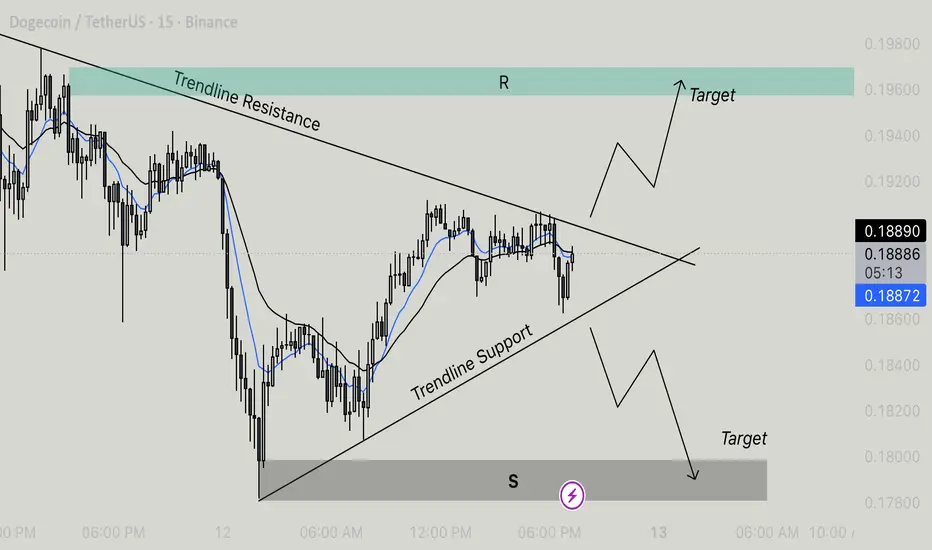
Doge Getting Ready For A Big MoveThe chart shows Dogecoin currently consolidating within a symmetrical triangle pattern — characterized by converging trendlines of resistance and support. This pattern typically signals an impending breakout, but the direction (upward or downward) depends on which boundary the price breaches first.
⸻
Key Levels
• Resistance Zone (R): Around 0.19600, marked by the upper trendline.
• Support Zone (S): Around 0.17800, marked by the lower trendline.
• Current Price: Approximately 0.1888 USDT.
⸻
Technical Outlook
• Trendline Resistance: Price has tested the upper boundary multiple times but has yet to break above it. A successful breakout above this line could trigger bullish momentum toward the 0.19600 target area.
• Trendline Support: The lower boundary is holding as dynamic support. A breakdown below this level would indicate bearish continuation, with a potential move toward the 0.17800 target zone.
• Moving Averages: The blue (short-term) moving average is closely tracking the black (medium-term) average, showing consolidation and indecision in the market. A crossover above or below could confirm breakout direction.
⸻
Scenarios
• Bullish Scenario:
If DOGE breaks above the resistance trendline, expect upside continuation toward 0.195–0.196 USDT. This would confirm a bullish breakout from the symmetrical triangle pattern.
• Bearish Scenario:
A decisive close below the trendline support could signal downward momentum, with a target near 0.178 USDT.
⸻
Summary
Dogecoin is at a critical decision point within a symmetrical triangle. Traders should watch for a confirmed breakout above resistance or breakdown below support for potential trade entries. Volume confirmation will strengthen the reliability of either breakout direction.
Dogecoin Consolidates Above Value Area Low, Eyes 20¢ Resistance Dogecoin price action has shown early signs of recovery after holding firmly above the weekly $0.10 region. The recent bullish reaction and multiple candle closes above the value area low suggest buyers are gradually stepping back into control. From a structural perspective, this establishes a short-term floor that could fuel a rotation higher.
The next key technical zone lies around the $0.20 resistance level — a high-timeframe barrier where price previously faced strong selling pressure. As momentum builds, traders should monitor how DOGE behaves once it approaches this area, as rejection could trigger a deeper rotation.
Key Points:
- Support Zone: DOGE is holding above the weekly $0.10 support, showing early strength.
-Resistance Target: The $0.20 mark acts as a high-timeframe resistance and potential rejection zone.
- Range Formation: Price action may oscillate between $0.15 and $0.20, forming a clear short-term trading range.
If bullish momentum continues, DOGE could retest $0.20 before facing possible rejection. However, failure to sustain above $0.15 could reopen the path toward lower liquidity zones and revalidate the broader range.


DOGE /;Hello friends
After a long time of suffering, Dogecoin finally made a move and collected good liquidity that can make it prone to good growth and the safest way, as I always tell you, is to buy in stages and with the observance of capital and risk management.
The goals are also specified.
*Trade safely with us*

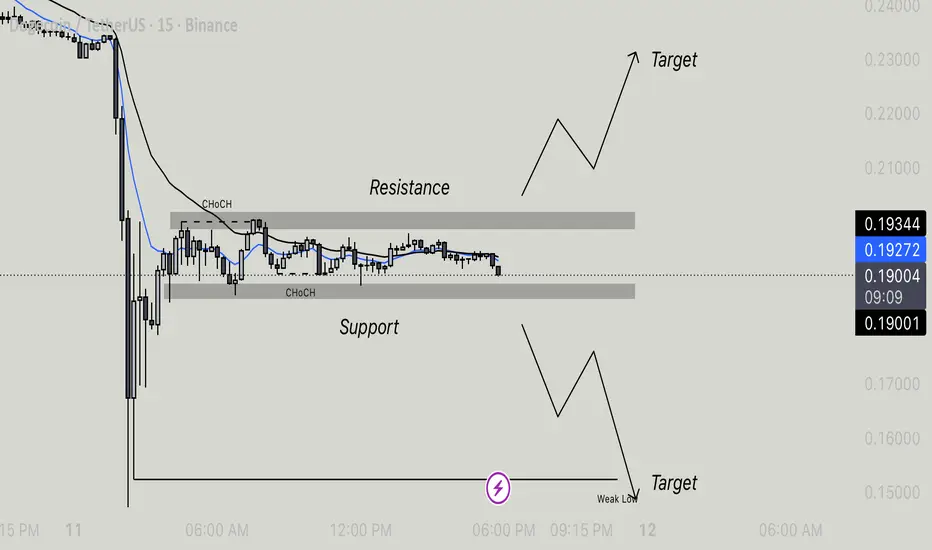
Doge/Usdt - Squeezing Between Support and Resistance Price is currently consolidating between a well-defined resistance zone (~0.193–0.195) and support zone (~0.187–0.189). A Change of Character (ChoCH) has been observed, indicating potential shift in short-term momentum.
Scenario 1 – Bullish Breakout:
If price breaks and closes above the resistance zone, expect bullish continuation towards the upper target area (~0.210–0.220). Look for retests of the breakout level for confirmation before entering long positions.
Scenario 2 – Bearish Breakdown:
If price rejects resistance and breaks below support, it may retest the weak low before moving towards the lower target zone (~0.150–0.160). Confirmation with volume and candle structure is recommended.
Market Sentiment:
Currently neutral to slightly bearish as price trades below resistance and shows reduced momentum. Traders should wait for a clear breakout or breakdown before taking positions.
Key Levels to Watch:
• Resistance: 0.193–0.195
• Support: 0.187–0.189
• Bullish Target: 0.210–0.220
• Bearish Target: 0.150–0.160
Does history repeat itself?Dogecoin has almost always returned to the origin of its move after each pump, and after touching that zone, it has started the next upward move.
This time, it might be doing the same thing, given the candlestick pattern it’s forming.
DOGE Looks Bearish (1D)We tried to show the waves from a larger perspective so you can have a better understanding of the path.
It seems that wave "B" of the higher-degree correction has been completed (wave B was a bullish phase), and now we are entering wave "C", which is bearish at a higher degree.
With the price pulling back toward the red zone, we can look for sell/short positions.
On the chart, there is a liquidity pool marked with "$$$", and the first target of this bearish move is to sweep that liquidity pool.
A daily candle closing above the invalidation level will invalidate this analysis.
For risk management, please don't forget stop loss and capital management
When we reach the first target, save some profit and then change the stop to entry
Comment if you have any questions
Thank You

Taking a risk trade on DOGE/USDTI’m a new trader and just started sharing my experience here. This is not financial advice, so take your own risk

DOGE near term TARGET $0,34Dogecoin is likely on it's way to more bullish prices.
Since around 22 June, there's been a near "up-only" trend on DOGE, where the price is continuously making higher highs and the corrections are all still higher lows.
In terms of technical indicators, we see strong bullish indication in the weekly timeframe as the price trade above all moving averages:
The daily timeframe's price is trading above the moving averages as well. A good place to watch for SHORT term corrections is the first and second band of the moving averages here:
OKX:DOGEUSDT BINANCE:DOGEUSDT

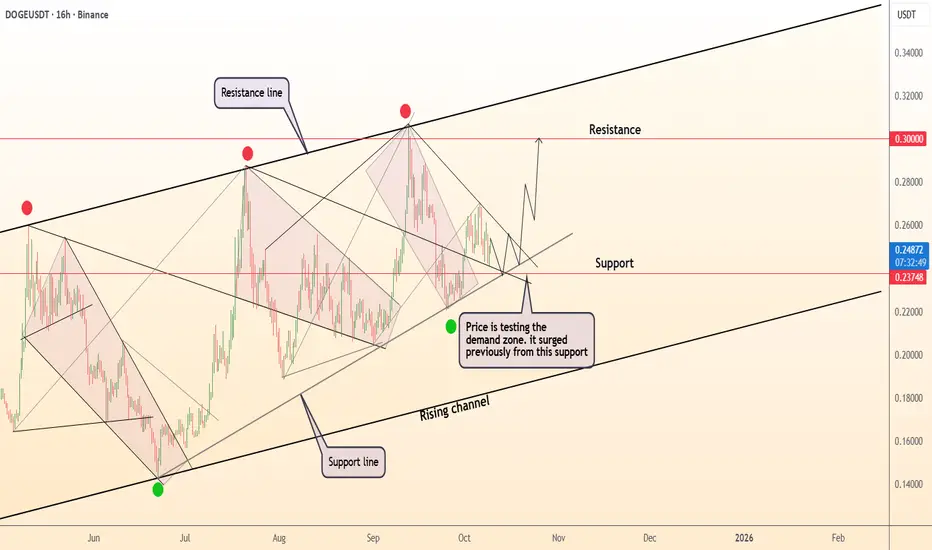
DeGRAM | DOGEUSD is testing the demand zone📊 Technical Analysis
● DOGE/USD is testing the rising channel’s lower boundary near 0.237, a level that previously triggered a strong rebound toward 0.30 resistance.
● Price structure shows accumulation within a demand zone, and bullish momentum could build once buyers confirm a close above 0.248.
💡 Fundamental Analysis
● Dogecoin benefits from renewed social media attention and growing integration in payment networks, supporting medium-term optimism.
✨ Summary
● Long bias above 0.237; targets 0.30. Support holds firm as bullish momentum rebuilds amid improving sentiment.
-------------------
Share your opinion in the comments and support the idea with a like. Thanks for your support!

MaybeThe one thing you always know, is that you never know.
I hope it only goes up. Been on doge for a while and big fan. But rising wedge looks sketchy.
I’m a complete novice, so don’t take my info as gold. Don’t take anyone’s. Crypto can change directions quickly. For me, it’s a hold. Always.
Good luck, boyzzzz

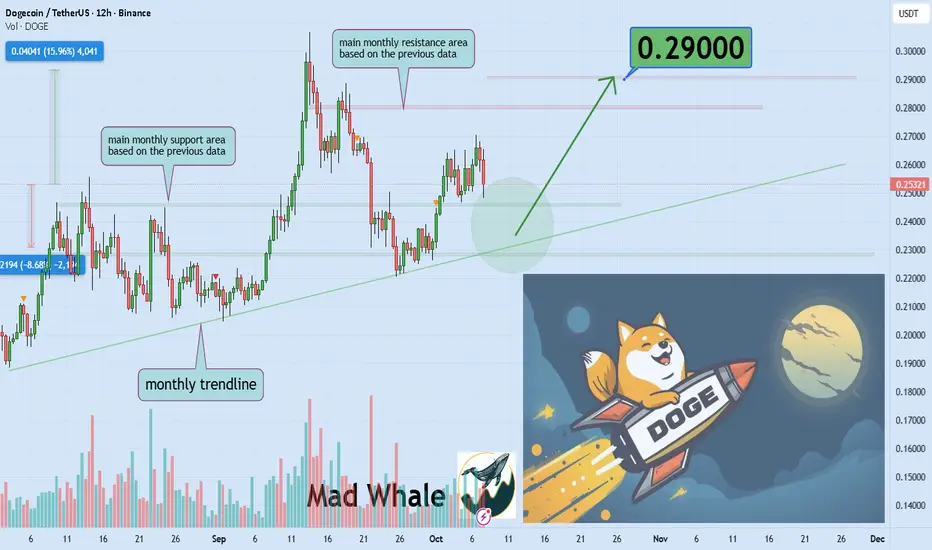
Dogecoin Approaching Key Support, 16% Gain Possible To 0.29$Hello✌️
Let’s analyze Dogecoin’s price action both technically and fundamentally 📈.
🔍Fundamental analysis:
Dogecoin (DOGE) has seen major accumulation by CleanCore Solutions, reducing supply and boosting potential demand. Pending ETF approvals could bring more legitimacy, but SEC caution on meme coins remains. 🐶📈
📊Technical analysis:
BINANCE:DOGEUSDT is trading inside its ascending channel, approaching a strong monthly trendline.
If this support level holds, the price could see a 16% rally.
Potential target for this move is around 0.29. 🚀📈
📈Using My Analysis to Open Your Position:
You can use my fundamental and technical insights along with the chart. The red and green arrows on the left help you set entry, take-profit, and stop-loss levels, serving as clear signals for your trades.⚡️ Also, please review the TradingView disclaimer carefully.🛡
✨We put love into every post!
Your support inspires us 💛 Drop a comment we’d love to hear from you! Thanks, Mad Whale