Taking a trade on DOGE/USDTI’m a new trader and just started sharing my experience here. This is not financial advice, so take your own risk
Trade ideas

DOGE Hidden Bullish Divergence Faces $0.22 RiskBINANCE:DOGEUSDT ’ price may be cooling off after a volatile week. On the 4-hour chart, DOGE is holding an ascending support line within a rising wedge. Between September 30 and October 7, price made a higher low while RSI made a lower low — a hidden bullish divergence that often signals weakening seller strength and a possible rebound.
As long as the $0.246 support holds, DOGE could aim for $0.257, $0.270, and $0.278. A close below the trendline, though, would shift bias back to bearish, exposing $0.234 and $0.226. The structure still leans cautious, with any small negative catalyst able to trigger another dip.
On-chain data supports mixed sentiment. Whales added about 130 million DOGE since October 2, showing quiet buying, but exchange balances climbed to 17.7% — a level that’s historically marked major corrections. DOGE’s short-term setup favors a rebound attempt, but $0.22 remains the key risk zone if buyers fail to hold the trendline.

DogeusdtAgain same construction double bottom on the air
It will kiss the cloud . Just wait this year will be crazy .
Targets on the 📈📈📈📉📉📉📉
#btc #altseason #meme

DOGEDOGE bid resumed around h4200ema after meaningfully sweeping, deviating, reclaiming, Monday's lows. Starting to close above weekly open now.
IF acceptance above weekly open, and ESPECIALLY if BTC can also reclaim its weekly open above 123K then Monday's .27 high gets taken.

Taking a trade on DOGE/USDTI’m a new trader and just started sharing my experience here. This is not financial advice, so take your own risk

Taking a trade on DOGE/USDTI’m a new trader and just started sharing my experience here. This is not financial advice, so take your own risk

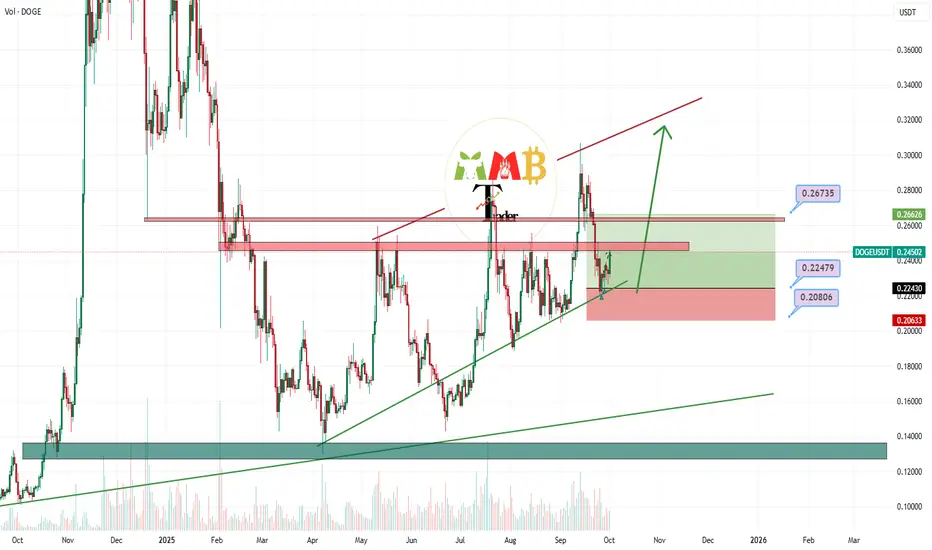
DOGE soon channel support will pump it to 0.33$0.22$ and 0.24$ are now major support zones and soon we can expect heavy pump to the channel resistance which is 0.33$ and even we can expect a breakout there and new High like 0.4$ and 0.5$.
DISCLAIMER: ((trade based on your own decision))
<<press like👍 if you enjoy💚

DOGE soon target of Buy will hit and 0.26$ is just beginning 0.26$ is just beginning of new phase pump if the price hold strong we can expect red trendline touch and if that resistance break to the upside boom 0.40$ is ahead and is easy to hit.
DISCLAIMER: ((trade based on your own decision))
<<press like👍 if you enjoy💚
#DOGE Uptrend, Where to Go Long 📊#DOGE Uptrend, Where to Go Long 💬
🧠From a structural perspective, the bullish structure remains intact, and bullish targets are still possible. Therefore, we should continue to look for long positions after the pullback. On the 4h chart, we can find support near the yellow line and the green buy zone.
➡️Stronger support is near the weekly neckline and the uptrend support line.
⚠️Note: If it falls below the L line, it means the bullish structure will deteriorate, and I may not have high hopes for the bulls at that point!
🤜If you like my analysis, please like 💖 and share 💬
BITGET:DOGEUSDT.P

Taking a trade on DOGE/USDTI’m a new trader and just started sharing my experience here. This is not financial advice, so take your own risk

DOGE’s Rally Faces Risk as Bearish Divergence EmergesDespite DOGE’s double-digit gains over the past two weeks, its Chaikin Money Flow (CMF) indicator has slipped into negative territory, signaling weakening capital inflows. This forms a bearish divergence, where price continues to rise while money flow declines — a classic sign of fading momentum.
If buying activity doesn’t pick up soon, this divergence could precede a short-term pullback, suggesting that DOGE’s current uptrend may be losing strength.

DOGECRYPTOCAP:DOGE has completed a clean cup-and-handle formation which is a bullish continuation pattern. The technical target sits around $0.91, but given its historical momentum and retail driven strength, I wouldn’t be surprised to see it extend toward $5 at the height of altseason

Taking a trade on DOGE/USDTI’m a new trader and just started sharing my experience here. This is not financial advice, so take your own risk

DOGE (TO THE MOON)IF full moon (today) pushes CRYPTOCAP:DOGE through .3, .618 of the range from 2024 high to 2025 low soon thereafter

Dogecoin Price Breakout Setup Hints at 20% RallyThe BINANCE:DOGEUSDT price trades near $0.25, holding strong inside an ascending channel that has guided its recovery for the past month. The structure shows clear higher lows, a key bullish signal.
The upper trendline near $0.28 is now the main resistance. A breakout above that level could unlock a move toward $0.32–$0.34, implying a 20% upside from current prices.
If momentum builds before that breakout, the BINANCE:DOGEUSDT price could even test $0.30 within days as the upper trendline keeps rising. The slope of the channel itself is a sign that buyers remain active and every dip gets absorbed quickly.
Immediate support sits at $0.24, where buying pressure has repeatedly stepped in since mid-September. A drop below $0.22 (the 0.382 Fibonacci retracement) would weaken the bullish setup, but the broader trend remains positive as long as the channel holds.
If BINANCE:DOGEUSDT price clears $0.28 with strong volume, the next Fibonacci targets appear near $0.32, followed by $0.34. A stretch move could reach $0.38, aligning with the 1.618 Fib extension from the August swing low.
The RSI is steady around mid-levels, showing room for another leg up without being overbought. Meanwhile, MACD momentum lines are flattening near zero — often a pre-breakout signal when trend strength is recharging.
Holder behavior reinforces the technical story. The Spent Coin Age Band — which tracks how many old coins are being sold — dropped 88% since mid-September. That means fewer coins are leaving wallets while the Dogecoin price keeps climbing.
At the same time, HODL Waves data show both new and long-term investors are increasing their holdings. Wallets holding DOGE between 1 week and 1 month grew from 3.16% to 5.65%, while 1–2 year holders rose from 23.1% to 24.0%.
Together, these on-chain signals suggest a strong belief among holders. Coins aren’t moving, buying continues, and supply on exchanges is tightening — all supportive signs for a potential breakout.

DOGE 1H – Testing the Lines of Defense
DOGE on the 1H looks similar to LINK and ETH: price is hovering around the 50MA, with the 200MA sitting just below as the next line of defense.
If DOGE manages to hold this cluster of support, a rebound toward the previous highs is on the table.
This structure shows tightening momentum, and the next few candles could define the next week`s direction.
Key notes:
DOGE testing 50MA on 1H
200MA close below as backup support
0.618 Fib as confluence zone
Setup mirrors LINK and ETH
Bias:
Neutral-bullish — structure intact while 50MA holds. Losing it could open a deeper retrace.
Always take profits and manage risk.

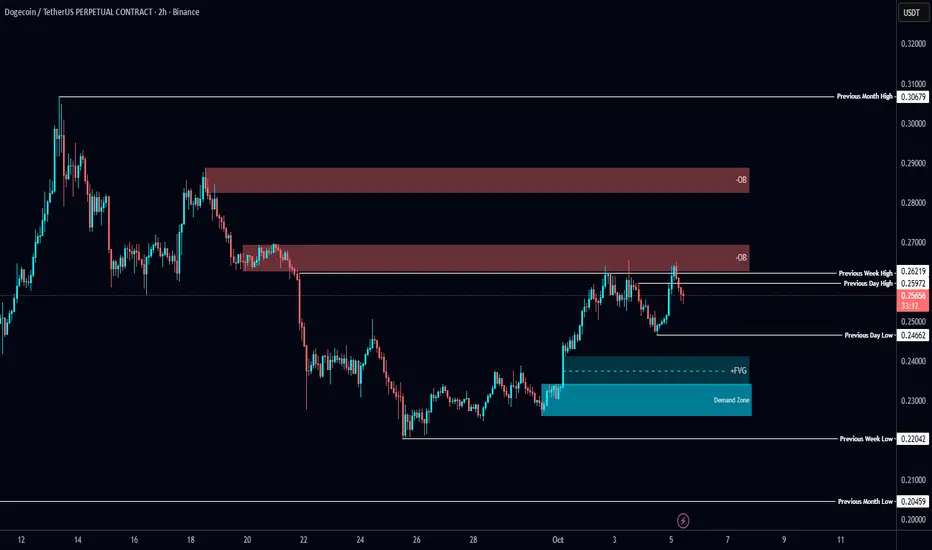
$DOGE Analysis 🚨 CRYPTOCAP:DOGE Analysis 🚨
DOGE is rejecting from the bearish Order Block 📉
No interest in longs here for now.
✅ Ideal long: demand zone tap with the 4H FVG sitting right above it
🔍 Waiting for that POI to get tagged before looking for a fresh long setup
DOGE Swing Long Idea - TRKZ ModelDOGE Swing Long Idea w TRKZ Model
📊 Market Sentiment
FED has resumed its rate-cutting cycle, starting with a 0.25% cut in September, with two more 0.25% cuts expected in the coming months. Additionally, institutional liquidity inflows have accelerated as the U.S. officially adopts crypto as part of its reserves. While inflation remains elevated, the weakening labor market is forcing the FED to ease, driving more capital into risk-on assets.
📈 Technical Analysis
Price broke the bearish trendline that had been responsible for the bearish trend since December 2024 and closed above, indicating that price will seek higher levels.
Price also broke the HTF Key Level aggressively and closed above. I expect this level to hold and push us higher.
📘 Model to be used – Broken Trendline Retest supported by HTF Key Zone Retest (TRKZ)
In this model, we need to see a HTF trendline broken aggressively with a close above on HTF. Then, we check for a broken HTF Key Zone (Supply–Demand–Support–Resistance) aligned with the trendline break. Finally, we look to enter after the retest of both the broken trendline and the broken Key Zone.
📌 Game Plan
Carry the position toward the December 2024 high at 0.48$ as a mid–long term swing position. Trail the stoploss after taking first TP, move entry to breakeven, and manage forward.
🎯 Setup Trigger
Setup is valid after retesting the broken trendline and HTF Key Level.
📋 Trade Management
Stoploss: 0.18254$
Targets: TP1: 0.308$ | TP2: 0.4344$ | TP3: 0.4842$
Once TP1 is hit, stoploss will be moved to breakeven to secure profits.
💬 Like, follow, and comment if this breakdown supports your trading! More setups and market insights coming soon — stay connected!
⚠️ Disclaimer: This content is for informational and educational purposes only and does not constitute financial, investment, or trading advice. Always DYOR before making any financial decisions.

DOGEUSDT 1D#DOGE is trading within a symmetrical triangle on the daily chart. Consider buying here and near the support zone ($0.22046 ~ $0.20927), which aligns with the daily SMA200. If a breakout occurs above the triangle resistance, the potential targets are:
🎯 $0.29810
🎯 $0.33781
🎯 $0.39434
🎯 $0.46635
⚠️ Always remember to use a tight stop-loss and maintain proper risk management.

dogeusdtIts time to pump again.
maybe some range on 0.265 to 0.24 to fill gap then raise again to target.
I think its not last chance for buy but its ending.
wish lucky for all of us :)

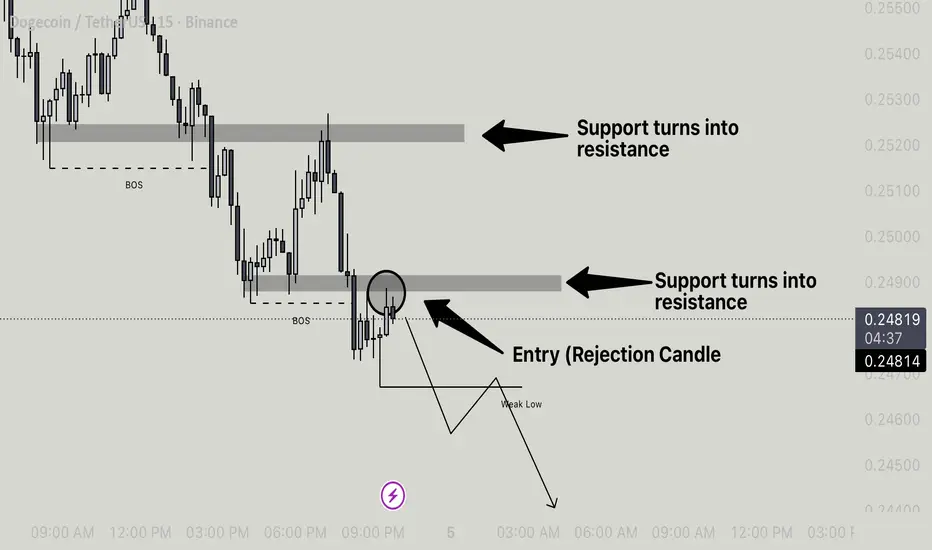
Doge/Usdt - Support Turned Resistance With BOS Bearish Setup 1. Support Turned Resistance (STR)
• The price initially had a support zone that later got broken.
• After the breakdown, that same zone is now acting as resistance (highlighted grey zones).
• This confirms a bearish shift in structure.
2. BOS (Break of Structure)
• The BOS mark shows that a previous low was broken, indicating bearish market intent.
• This is often used by traders to confirm continuation in the downward direction.
3. Rejection Candle (Entry Point)
• After the BOS, the price retraced back into the resistance zone (previous support).
• A rejection candle formed inside that zone, signaling sellers are defending it.
• This is the entry trigger for a short trade.
4. Weak Low & Target
• The chart suggests that the recent low is weak and likely to be taken out.
• The target is placed below that weak low, expecting continuation to the downside.
Trade Idea Summary
• Bias: Bearish
• Entry: On rejection candle at support-turned-resistance.
• Confirmation: BOS already occurred, validating bearish structure.
• Target: Below weak low (marked).
• Stop Loss: Should be placed slightly above the resistance zone (not shown but recommended).
This setup is a classic support-turned-resistance with BOS confirmation—a strong bearish continuation pattern.
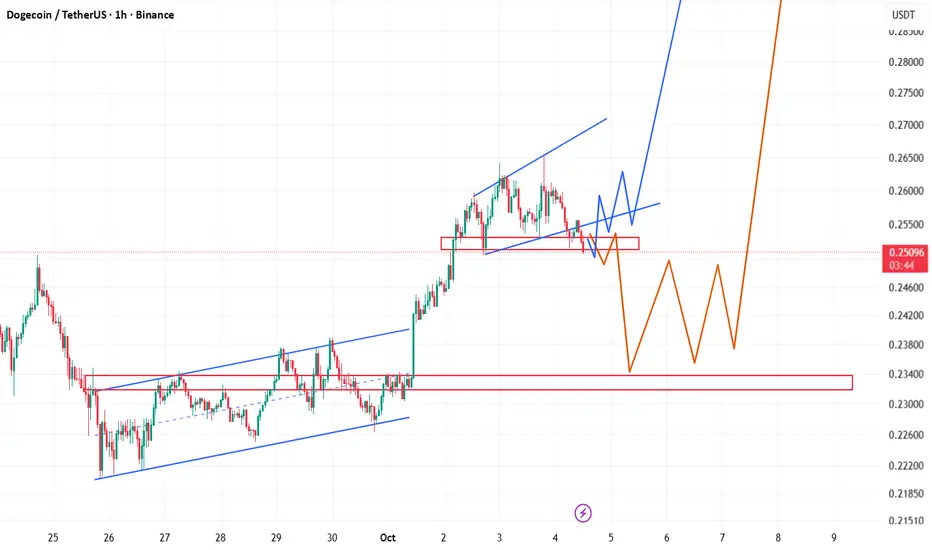
DOGE Breakdown Could Trigger a Major Dump Yello, Paradisers! Have you noticed what just happened with DOGE? The recent price action is sending a clear warning that downside risk is increasing — and fast. Several technical signals are aligning, and ignoring them here could be costly.
💎DOGEUSDT has broken down from its ascending channel structure — a clear shift in trend. More importantly, we’re seeing bearish divergence on both MACD and RSI, confirming that momentum is weakening despite recent price attempts to push higher. When these signals appear together, it often precedes a sharp reversal.
💎Adding to the bearish bias, the price has just formed a double top pattern — and not just anywhere, but exactly at a previous support level that has now turned into resistance. This type of confluence makes the setup even more reliable for a potential move to the downside.
💎From the current levels, the risk-to-reward ratio is already attractive for short positions. However, considering the broader bullish tone of the overall crypto market, it may be wise to size positions conservatively here. Traders who prefer more confirmation might wait for a clean retest of the resistance zone, where a bearish candlestick pattern would provide a higher-conviction entry point.
💎If, however, price breaks back above the resistance zone and closes firmly above the invalidation level, the bearish setup becomes invalid. In that case, it's best to step aside and wait for fresh signals or clearer market structure before acting again.
🎖But it never is, and never will be a free ride. Make sure you play it smart, Paradisers; the next 6–9 months will be juicy for some and painful for others. Discipline, patience, robust strategies, and trading tactics are the only ways you can make it long-term in this market.
MyCryptoParadise
iFeel the success🌴

doge is bullish in high timeframesi think this is a low timeframe analyze that can show us how doge can move in the chart.
what do u think about it?