#DOGE Update #2 – July 27, 2025#DOGE Update #2 – July 27, 2025
I previously made two purchases in Doge, and closed one of them with approximately a 10% profit. You can see this in earlier posts as well. After that profit-taking, I opened another position in Doge. However, this time Doge chose to make a correction.
I’m still holding the position and haven’t averaged down yet. My entry level is currently around the $0.262 zone. Unless I see a sharp drop or a clear breakout signal, I find it more reasonable to hold onto the cash in my account rather than averaging down.
At the moment, along with XRP, I’m experiencing around a 10% drawdown from the current level. However, I will continue to wait. I don't think it's reasonable to make a new purchase from this level.
If I decide to average down, I plan to do it near the $0.18 zone. There's also a slight chance I may add at the $0.21 level, but I'm not certain yet. From its current position, I expect approximately a 14% profit. I will continue holding this position.
DOGEUSDT.5L trade ideas

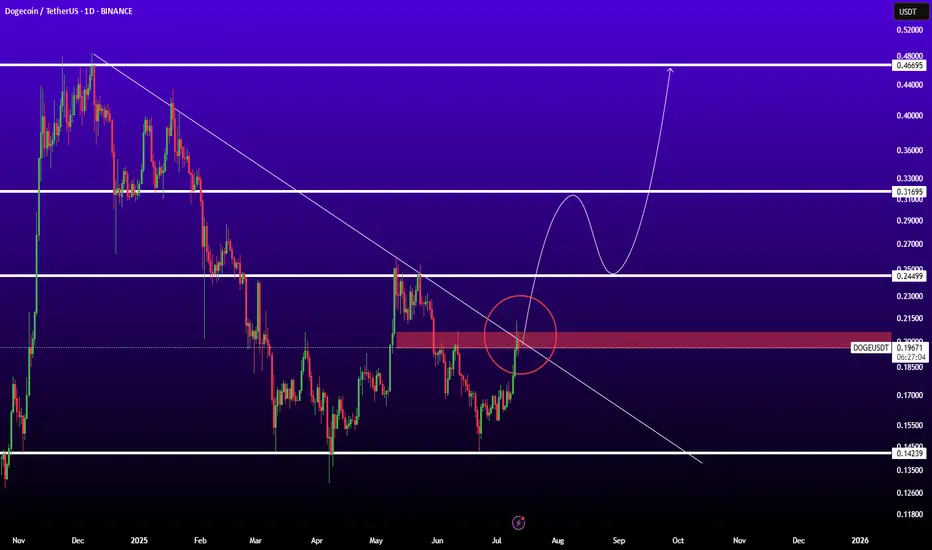
DOGEUSDTBINANCE:DOGEUSDT is in good level for pump because if breaked trendline and resistance 0.200$ ready for sharp movement to next levels.
Resistances: 0.25 - 0.32 - 0.45
Support: 0.15
DOGEUSDT is BullishPrice went down for a small retracement on hourly timeframe, however the double bottom formation coupled with bullish divergence and breaking of descending trendline hints that bulls are assuming control of the price action. This sentiment would be validated with the break of previous lower high, according to Dow theory. Targets are mentioned on the chart.

DOGEUSDT Analysis : Bullish Breakout, Reversal Zones + Target📊 Full Technical Analysis:
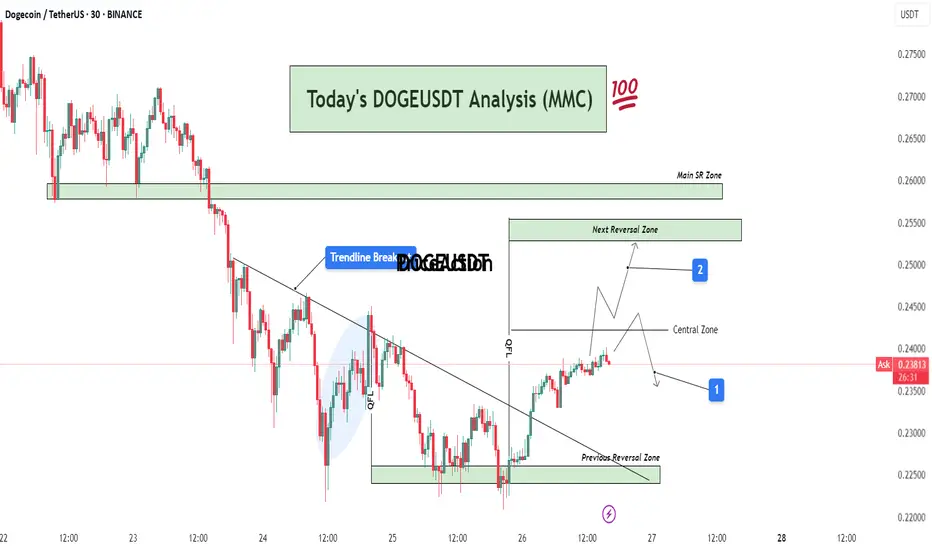
This chart presents a structured and precise MMC-based analysis of DOGE/USDT on the 30-minute timeframe, integrating key price action zones, trendline structure, and potential market scenarios.
🧩 1. Downtrend Phase and Trendline Formation
DOGE was in a continuous downtrend, creating lower highs and lower lows. A bearish trendline had been acting as dynamic resistance for multiple sessions. Price consistently respected this trendline, indicating strong seller dominance.
However, after repeated taps on the trendline and rejection from lower support, price finally broke above the trendline — marking a potential trend reversal or corrective phase.
🔄 2. Previous Reversal Zone – Demand Zone (0.225–0.228)
This zone acted as the major turning point where buyers aggressively stepped in. The demand was previously tested and respected, indicating strong accumulation here.
From this zone, a bullish reversal was initiated, leading to the current price rally.
This area can now be considered a structural support base – ideal for watching future re-tests or consolidation.
🔁 3. Central Zone – Decision Area (0.238–0.240)
This is a critical intraday resistance zone acting as a central decision-making area for traders.
Two Key Scenarios Could Play Out from Here:
Scenario 1 (Marked by Blue Box 1):
Price could face rejection from this zone and fall back slightly toward minor support levels for a retest or liquidity grab. If bullish pressure sustains, a higher low may form before continuation upward.
Scenario 2 (Marked by Blue Box 2):
If price breaks above the central zone with strong volume, momentum can push it toward the Next Reversal Zone between 0.250–0.255.
In either case, watching price behavior and candle structure near the central zone is critical for confirmation of the next move.
🔼 4. Next Reversal Zone – Supply/Resistance (0.250–0.255)
This zone marks a historical resistance area where DOGE faced heavy selling pressure before.
If price reaches this zone, expect:
Either profit-taking and short-term selling from intraday traders.
Or a possible breakout continuation if broader market sentiment remains bullish.
This zone will act as a key test of DOGE's strength and market conviction.
📌 5. Main SR Zone – Strong Structure (0.258–0.260)
Beyond the Next Reversal Zone lies the Main SR (Support-Resistance) Zone, where price has reacted strongly in the past.
If DOGE manages to break and hold above the 0.255 range, this zone will likely become the next upside target and strong resistance zone.
🔍 Additional Market Context:
Breakout Volume: The trendline breakout was accompanied by rising volume, which suggests stronger conviction behind the move.
QFL Zone: Price structure also aligned with a QFL (Quick Flip Level) bounce within the shaded region before breakout, further validating the bullish pressure.
Psychological Levels: 0.240 and 0.250 are psychological levels, which often act as magnet points and temporary resistance/support.
🧠 Mirror Market Concepts (MMC) Insight:
This analysis is rooted in Mirror Market Concepts, where the market tends to reflect past behavioral zones. Each marked zone (Demand, Central, Reversal, SR) is based on previous reaction points that guide current sentiment.
The market is now in a mirror reaction phase, moving from the previous demand zone toward historical supply zones. If the symmetry continues, the pattern supports a gradual bullish continuation with measured pullbacks.
✅ Trading Plan (Educational Purpose Only – Not Financial Advice):
Entry Zone 1: Breakout traders may have entered after the trendline breakout near 0.233–0.235.
Entry Zone 2: Conservative traders can look for retest confirmation in the Central Zone.
Target Zone: Next Reversal Zone (0.250–0.255) and possibly Main SR (0.260).
Stop Loss: Below the Previous Reversal Zone (~0.224) for swing setups.
Risk-to-Reward: RR setup of 1:2 or higher possible depending on entry strategy.
Dogecoin Wave Analysis – 25 July 2025
- Dogecoin reversed from resistance zone
- Likely to fall to support level 0.2000
Dogecoin cryptocurrency recently reversed down from the resistance zone between the key resistance level 0.2630 (former monthly low from December, acting as the resistance now), standing near the upper daily Bollinger Band.
This resistance zone wad further strengthened by the 38.2% Fibonacci correction of the previous sharp downward impulse from December.
Given the clear daily downtrend, Dogecoin cryptocurrency can be expected to fall to the next round support level 0.2000 (target price for the completion of the active correction ii).

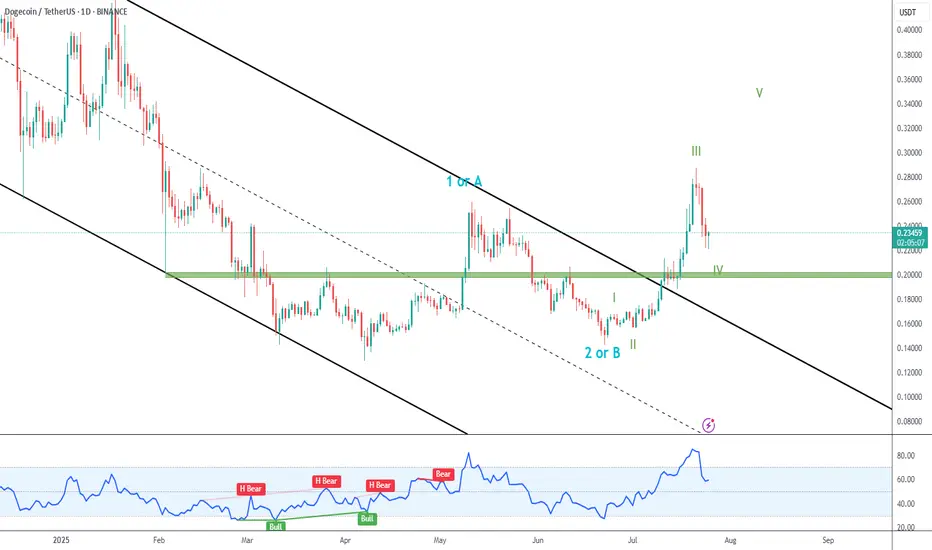
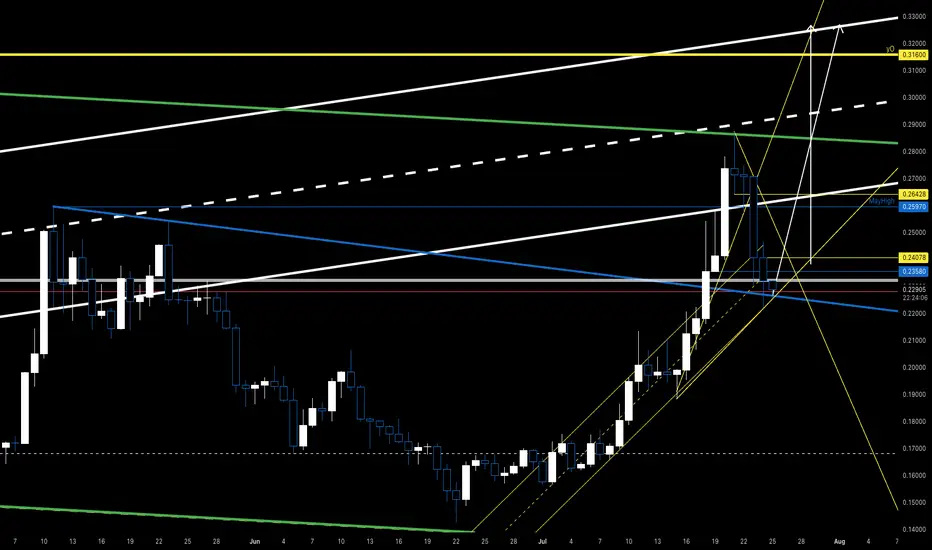
DOGE Breakout
➡️ Dogecoin blasted away from the black descending channel and past green resistance (now support).
➡️ In my primary count, we are currently in green IV correction, and expect new higher highs.
➡️ A retest of green support would be nice, but it is probable that price won´t go that far.
next levels for Dogecoin id very promising honest and well-made TA for doge next levels , with explanations and know how notes full of evedinces with solid knowledg of TA and Volume prifiles with calsics too. btc also , startes is wave D formation upwords, after that a good correction is comming to the market for late entries who did not see our TA's before and now . your support join and share some of a littile bit of your profit will make you make more and safe in this very hard market. peace and stay safe

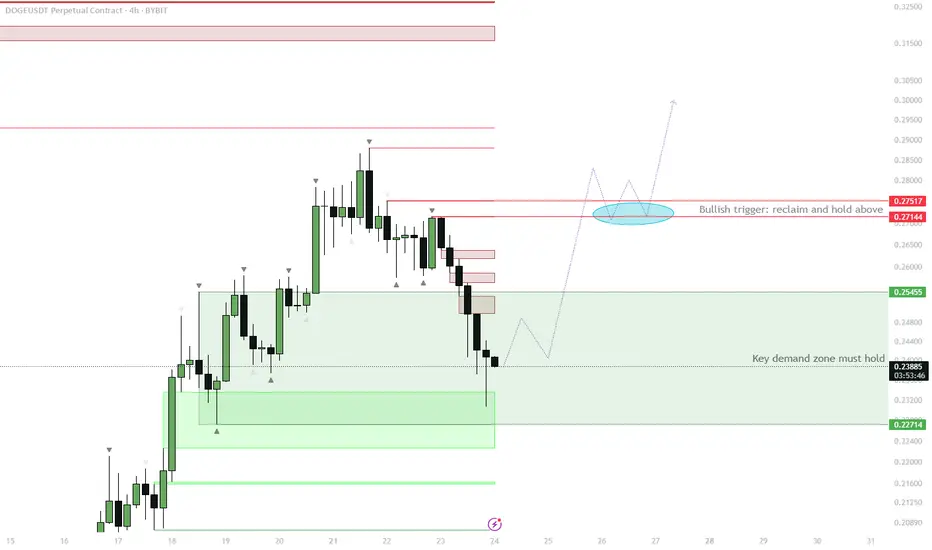
DOGE H4 – Demand Zone Reclaim as Bullish Trigger
Price is currently testing the H4 demand zone (~0.227–0.254).
Watch for price to reclaim the demand zone and close back above 0.254.
If confirmed, expect a move up toward the red resistance cluster at 0.271–0.275.
Consolidation above this area (highlighted in blue) would be a strong signal for continuation.
Invalidation: clean breakdown and acceptance below 0.227 signals failure of demand and deeper retrace.
This setup aims to capitalize on a classic liquidity sweep and demand reclaim. Typically, after taking out the flat open and collecting late shorts/stop losses, strong buying often steps in if demand is genuine. A successful reclaim and consolidation above the previous resistance will set the stage for bullish continuation. If this zone fails to hold, the move is invalidated and lower targets come into play. Waiting for confirmation reduces the risk of a failed bounce.
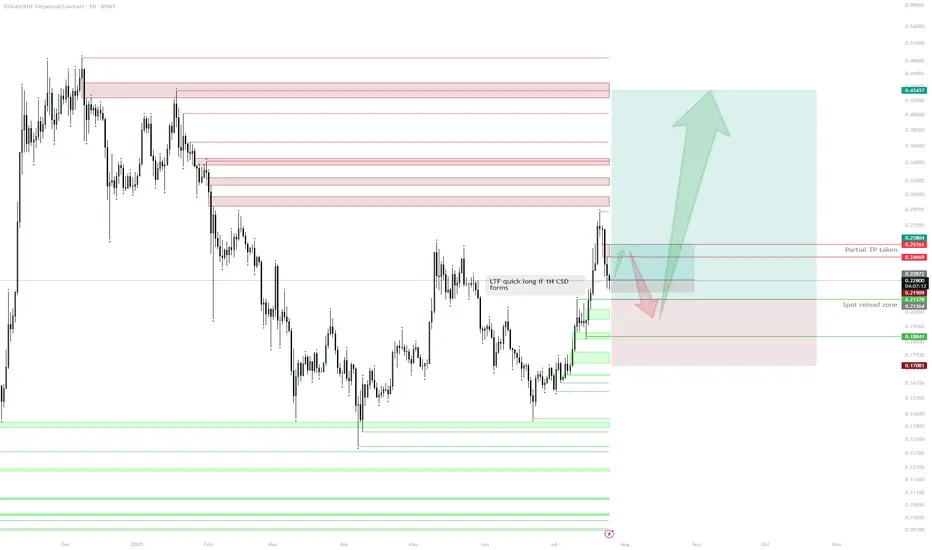
DOGE – HTF Plan & Spot Reload ZoneSpot Position & Realized Profit:
Spot position held from the $0.19 sweep.
Previous long from demand taken and partially realized at $0.26, de-risking the core position.
Current Structure:
After reaching resistance ($0.26–$0.27 zone), price is retracing.
Daily demand/support sits around $0.20–$0.21, with multiple confluences for spot re-accumulation.
Immediate Plan:
Waiting for price to revisit daily demand ($0.20–$0.21) to reload spot and/or open fresh longs.
Watching for a possible lower timeframe (1H) bullish confirmation (e.g., 1H change of structure/1H CSD) as a trigger for a tactical long before daily demand is tagged.
LTF Play:
If price prints a 1H CSD, a quick long up to daily imbalance ($0.24–$0.25) can be considered.
Invalidation:
Loss of daily demand ($0.188) would invalidate the bullish scenario and require re-evaluation.
Upside Target:
If demand holds, looking for moves back into daily supply/imbalance, with ultimate HTF targets at $0.26, $0.32, and higher.
Reasoning:
The core plan is to build spot exposure at strong demand after de-risking on the first move up. The context is that DOGE has shown willingness to bounce at major demand, and with realized profits in the pocket, risk can be managed comfortably on new entries. Short-term, LTF confirmation (such as a 1H CSD) can offer a tactical long back into daily imbalance before the main reloading zone is tagged. Patience and precise triggers are key—no need to rush until price action confirms.
Dogecoin (DOGE): Breakout Happened | Another 200% Incoming!Dogecoin has had a really good rally so far, but that's not all; we might see another 200% movement from the current market price!
More in-depth info is in the video—enjoy!
Swallow Academy

#DOGE/USDT falling wedge#DOGE
The price is moving within a descending channel on the 1-hour frame and is expected to break and continue upward.
We have a trend to stabilize above the 100 Moving Average once again.
We have a bearish trend on the RSI indicator, supporting the upward break.
We have a support area at the lower boundary of the channel at 0.22270, acting as strong support from which the price can rebound.
We have a major support area in green that pushed the price upward at 0.21777.
Entry price: 0.2320
First target: 0.24210
Second target: 0.25380
Third target: 0.26920
To manage risk, don't forget stop loss and capital management.
When you reach the first target, save some profits and then change the stop order to an entry order.
For inquiries, please comment.
Thank you.

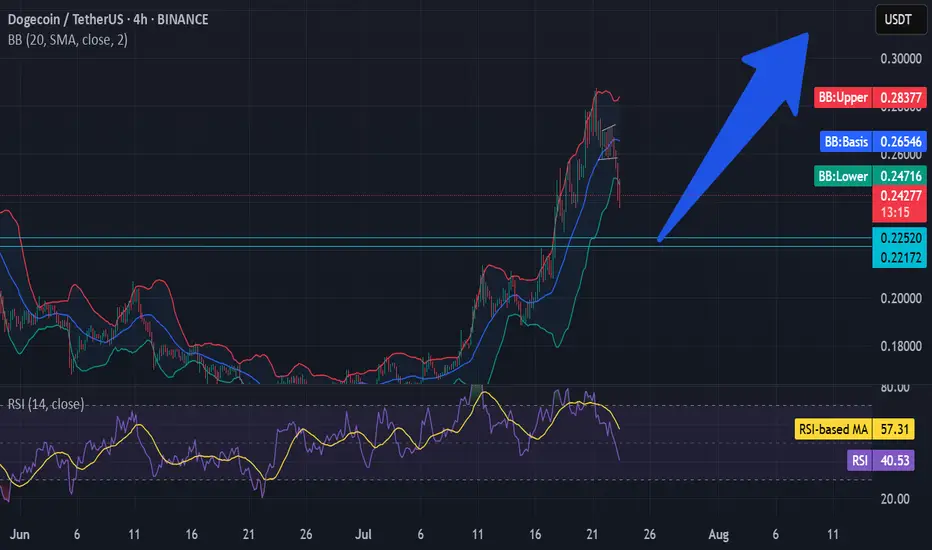
DOGE : Idea.Hello, good ? Good.
Enter in doge here is not a bad idea in SPOT.
• Above the last important resistance.
• Retest on 50 Weekly MA.
• Above 50 rsi weekly.
• Bollinger bands in consolidation.
Need to confirm rejection in weekly like always.
If rejectyion here : x2 incoming.
Good luck guys, take care of you.

The Pullback Panic? Your Whole Plan Dies?!!!!!One red candle is all it takes to destroy your entire plan.
Why do we panic so fast? Why do we exit too early before a rally?
And worse: why do we FOMO back in at the worst possible time?
Hello✌️
Spend 3 minutes ⏰ reading this educational material.
🎯 Analytical Insight on Dogecoin:
BINANCE:DOGEUSDT is approaching the key psychological level of 0.20, which also aligns with a strong daily support and the final Fibonacci retracement zone 🧭. Despite recent volatility, it continues to hold its mid-range Fib level, suggesting potential accumulation. If this support holds, a rebound toward the 0.30 resistance — a move of around 27% remains on the table 🎯.
Now , let's dive into the educational section,
🧠 The Victim Mindset in Crypto Markets
Here’s the uncomfortable truth.
Most traders believe they’re making rational decisions but in reality, they’re reacting emotionally to past pain.
One bad experience during a correction makes us fear all pullbacks.
Missing one big rally creates constant FOMO.
We can’t handle drawdowns but we accept buying tops again and again.
It’s not just you. This is how most retail traders operate and whales know it.
🐳 How Whales Profit From Our Fear
Whales never buy during hype. They buy during fear.
Mini pullbacks, shakeouts and false breakdowns are designed for one thing.
To make you exit so they can enter.
A red candle, a small wick, maybe a fake support break.
We sell out of fear, they buy the dip.
We FOMO back in too late.
Pullbacks are not just price moves. They are psychological traps.
📈 How to Break This Cycle
You don’t need to predict the future. You need to understand yourself.
Ask if this correction is technical or emotional.
Use confirmation from volume, OI and divergence.
Enter after traps, not inside them.
Question your feelings before every move.
You are not trading the chart. You’re trading your mind reacting to the chart.
📊 TradingView Tools to Escape the Fear Greed Cycle
TradingView gives you access to several practical indicators that can help protect your capital from emotional decision-making.
🔹 Fear and Greed Index (Crypto)
Simple but powerful. When the index drops below 30, most traders are in panic mode. That is exactly where whales accumulate, while we run away.
🔹 Open Interest Heatmaps
When open interest rises but price stays flat, it often signals an upcoming shakeout. One scary-looking red candle and the weak hands are gone.
🔹 Volume Profile and VPVR
Perfect for distinguishing between healthy corrections and manipulative dumps. If price pulls back but buying volume remains strong, it's not a real sell-off. It’s a trap.
🔹 Divergence Indicators like MACD or RSI
If RSI rises during a pullback, there’s a hidden bullish divergence. Exiting may be the worst thing to do.
🔹 Liquidity Maps
These show where stop losses and liquidation clusters are located. Often before any major move up, the market takes a detour to liquidate these levels.
Use these tools to stop reacting emotionally and start trading rationally.
📍 Final Thoughts
Small corrections are not the enemy.
Your emotional reaction to them is the real threat.
Before you panic-exit, ask yourself if this fear is justified or just mental conditioning.
The market always gives second chances but we rarely wait for them.
✨ Need a little love!
We pour love into every post your support keeps us inspired! 💛 Don’t be shy, we’d love to hear from you on comments. Big thanks , Mad Whale 🐋
📜Please make sure to do your own research before investing, and review the disclaimer provided at the end of each post.

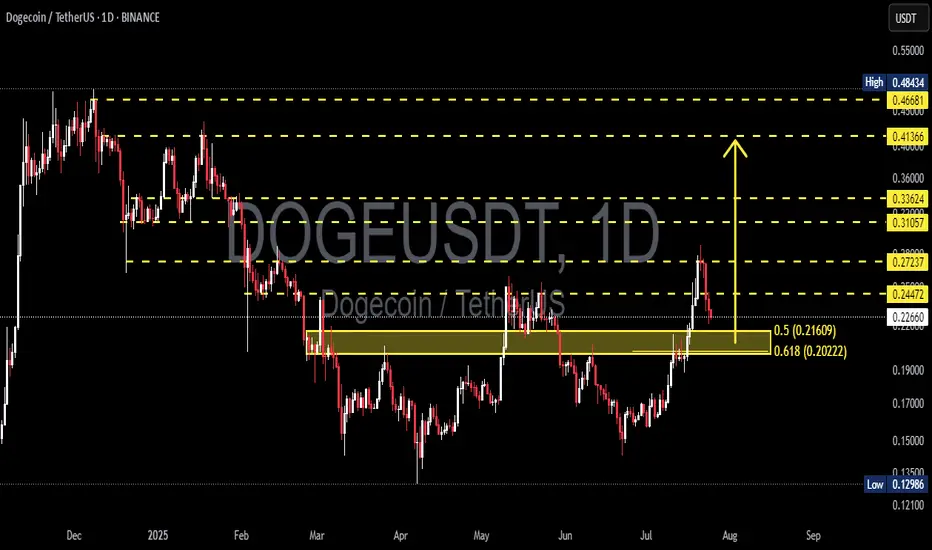
DOGEUSDT at a Make-or-Break Level: Bounce or a Breakdown?📉 Overview:
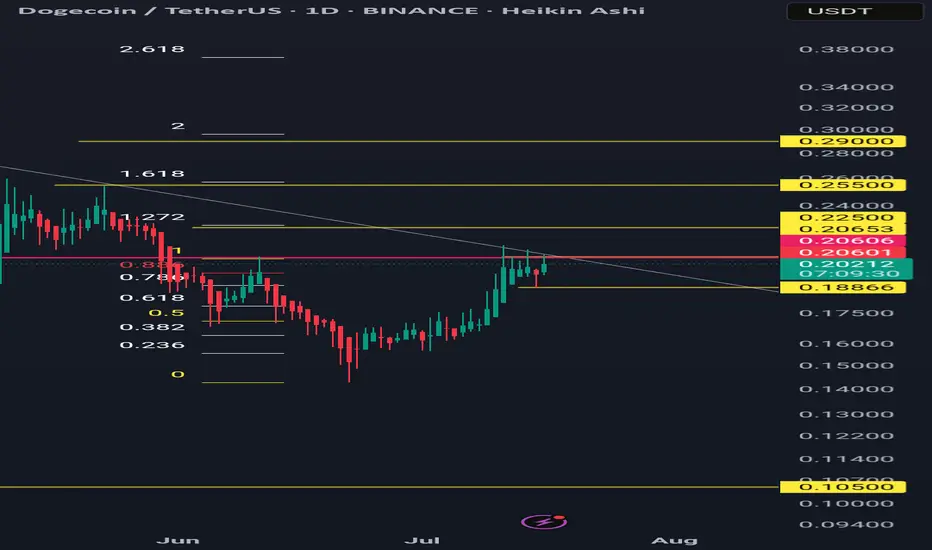
After a strong rally from the $0.13 zone to a recent local high of $0.272, DOGE is now undergoing a healthy correction. The price has retraced to a critical Fibonacci Golden Pocket zone (0.5–0.618) between $0.21609 and $0.20222 — historically one of the most powerful zones for market reactions.
This area also aligns with a previous resistance zone that is now being retested as support — a classic SR Flip (Support/Resistance Flip).
---
📌 Key Technical Structure:
🔸 Support & Demand Zone (Golden Pocket):
$0.21609 (Fib 0.5) and $0.20222 (Fib 0.618) – key retracement levels of the recent bullish swing.
Acts as a confluence zone with horizontal support from prior consolidation.
🔸 Major Resistance Levels:
$0.24472 – immediate resistance to reclaim.
$0.27237 – recent high and a major supply zone.
$0.31057, $0.33624 – historical distribution zones.
$0.41366 – breakout confirmation zone for a full trend reversal.
---
🧠 Market Psychology & Patterns:
Breakout & Retest: DOGE recently broke out from a long-term range and is now retesting the breakout zone.
Potential Bull Flag or Descending Channel: Current pullback resembles a flag or bull pennant — both continuation patterns if confirmed with volume.
---
✅ Bullish Scenario (Bounce):
If DOGE holds the Golden Pocket ($0.216–$0.202) and prints a strong bullish reversal candle:
A bounce may push price back to $0.244, and if reclaimed, back to $0.272.
A confirmed breakout above $0.272 with volume could lead to:
Mid-term targets: $0.310 → $0.336 → $0.413 → $0.466.
📈 Confirmation: Daily candle close above $0.244 with rising volume.
---
❌ Bearish Scenario (Breakdown):
If price fails to hold above $0.202 and breaks below with daily close:
It signals invalidation of the bullish structure and possible reversal.
Downside targets:
$0.186 – short-term support.
$0.150 – psychological support.
$0.129 – Year-to-date low (YTD Low).
This would also form a Lower High – Lower Low structure indicating a shift to a bearish trend.
---
🔍 Volume & Momentum Clues:
Watch for volume spikes near $0.202–$0.216.
Strong green candle + volume = likely reversal.
Weak reaction or breakdown on low volume = potential continuation downward.
---
🎯 Trader Playbook:
Signal Action Target
Bounce from $0.216–$0.202 Long Entry $0.244 – $0.272
Daily close below $0.202 Short / Avoid Longs $0.186 → $0.150
Breakout above $0.272 w/ volume Breakout Entry $0.31 → $0.336 → $0.41+
---
🏁 Conclusion:
DOGE is currently at a critical inflection point. The Golden Pocket zone will likely determine whether bulls are accumulating for another leg up or bears are about to reclaim control.
💡 This is a time for strategy, not prediction. Wait for confirmation before committing to either direction. The market is speaking — all we have to do is listen.
---
📊 Chart Summary:
Timeframe: Daily (1D)
Pattern: Breakout Retest + Fibonacci Retracement + Bull Flag
Structure: Higher High – looking for Higher Low confirmation
#DOGEUSDT #Dogecoin #CryptoTA #GoldenPocket #AltcoinAnalysis #FibonacciTrading #BreakoutSetup #BullishContinuation #BearishReversal
Doge is ready to complete double bottom!I'm closely monitoring DOGE as it approaches a critical technical zone. Based on recent price action and volume behavior, there’s a strong possibility to pump!


DOGE Swing Trade – Key Support in PlayDOGE is currently holding a major support zone, offering a strong risk-reward opportunity for a long swing position. With bullish sentiment and meme coin narratives returning, this level is worth watching for upside continuation.
📌 Trade Setup:
• Entry Zone: $0.23 – $0.24
• Take Profit Targets:
o 🥇 $0.27 – $0.28
o 🥈 $0.37 – $0.44
• Stop Loss: Just below $0.215

Dogeusdt bullish iH&S/cup&handle pattern in daily tfForming a bullish pattern and a close above 0.206 in daily time frame may activate the pattern.
Targets are 0.225, 0.255 and 0.29
Invalidation below 0.1886
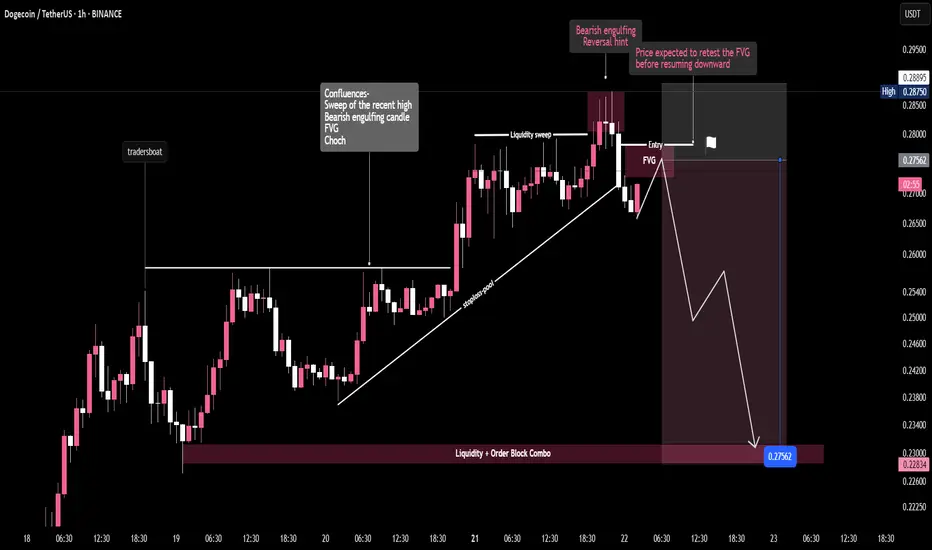
DOGE/USDT -1H "Dogecoin Fakeout? 🚨 Liquidity sweep followed by a bearish break – Smart money eyes the FVG for re-entry. Targeting the demand zone below. Patience is profit. 💰📉"
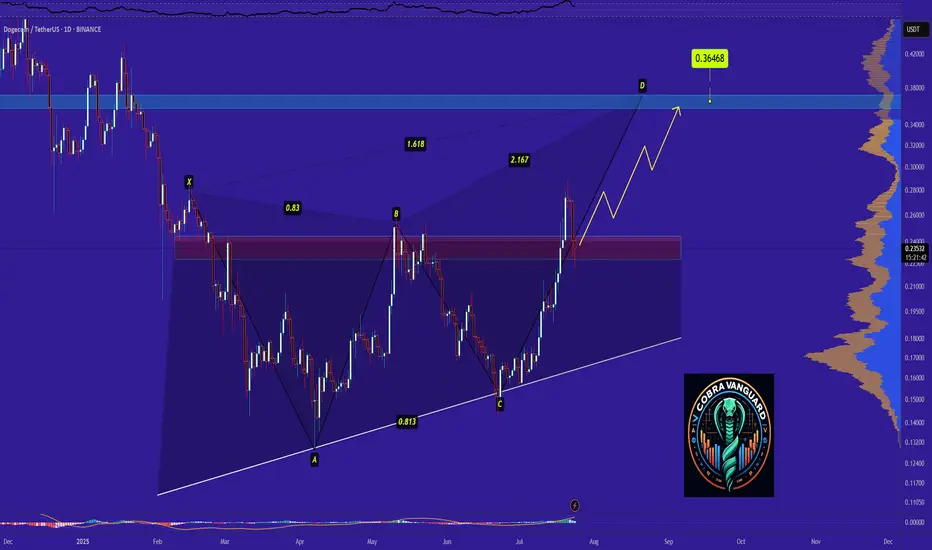
Dogecoin Ready for PUMP or what ?Dogecoin has completed and broken the ascending triangle in the daily timeframe, The price is currently supported well, which can increase the price. I expect the price to rise to around 0.36 .
Stay Awesome , CobraVanguard
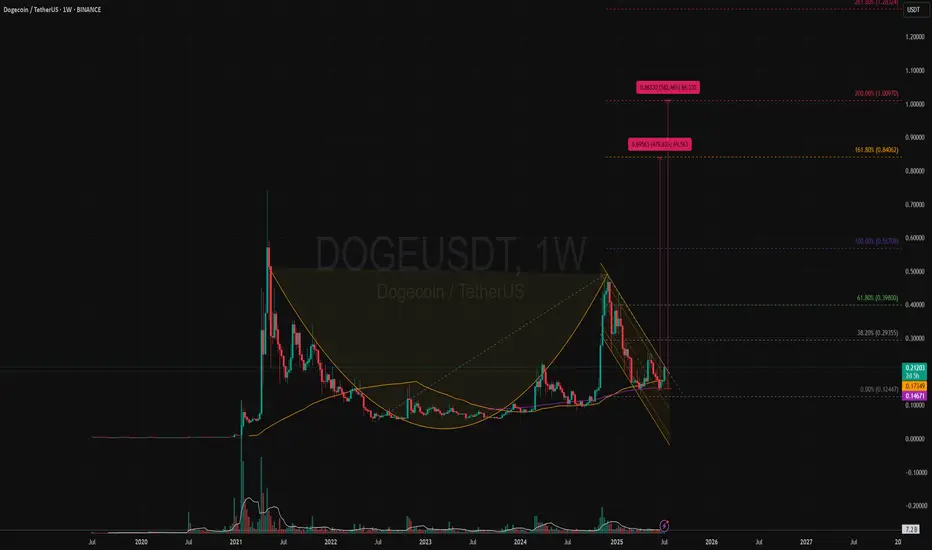
DOGEUSDT | Bullish Cup & Handle Revisiting Target +500% (1 USD)?Price Action and Chart Pattern Analysis:
DOGE cup bottom happened around $0.05 with the rim around $0.48. That gives a depth of roughly $0.42. If the breakout occurs near the rim, the measured move target would be $0.90 zone.
This aligns with several analyst projections suggesting DOGE could reach $0.90 to $1.00 if the breakout confirms.
Another way to project this cup & handle is the fibonacci-based target. These levels suggest that if DOGE breaks above the handle and sustains momentum, $0.85–$1.00 is a realistic zone for profit-taking at 161.8% and 200% extension as 1-2-3 wave pattern.
Reliability of the Cup and Handle Pattern for DOGE
The cup and handle is a classic bullish continuation pattern, but when applied to Dogecoin, its reliability depends on several dynamic factors:
Strengths of the Pattern in DOGE’s Context
Historical Accuracy: DOGE has previously respected technical patterns like rounded bottoms or (THE CUP) and breakout channels (THE HANDLE), especially during alt coin rallies.
Current Setup: a well-formed cup and handle on DOGE’s weekly chart, with price rebounding from $0.14 and testing resistance at $0.2 zone which also the key resistance SMA50W and the downtrend channel (the handle)
WATCH OUT: still a possible throw-under pattern or a final bear trap liquidity below previous low!
Key Action: If breakout confirmed with volume > Follow BUY | if not, wait for retraced SMA20 or breakout support.
Always trade with affordable risk and respect your stop...