DOGE — Watching for a Relief Bounce from SupportDogecoin has pulled back into a key support zone at $0.21–$0.22, a level that has historically acted as both resistance and support. With the broader market showing signs of consolidation, this area could offer a short-term bounce opportunity.
That said, this is likely a relief rally within a broader downtrend, so managing risk is critical. A failure to hold this support could lead to a deeper correction later this month.
🔹 Trade Plan:
• Entry Zone: $0.21–$0.22
• Targets: $0.27–$0.28, $0.37–$0.44
• Stop Loss: Below $0.20
This is a spot-only setup with an asymmetric risk-reward profile if the bounce materializes. Avoid overleveraging and stick to your plan.
DOGEUSDT.5L trade ideas
Doge futurei have removed old lines and have extended my bottom green lines of support, dark being super buys, and light greens being good buys. i have also shifted my white random line to be more along the neck and shoulder that has formed over the time. i am no finacial person, just a random guy that is just having fun, dont take this as concret and nothing is in stone. however, i will say that "if" there is a crash, i will be hoping in on the buy side to ride it back up. as the only way it fails is if the world its self says no more market, but humans are greed filled flesh bags, hahahahahaah

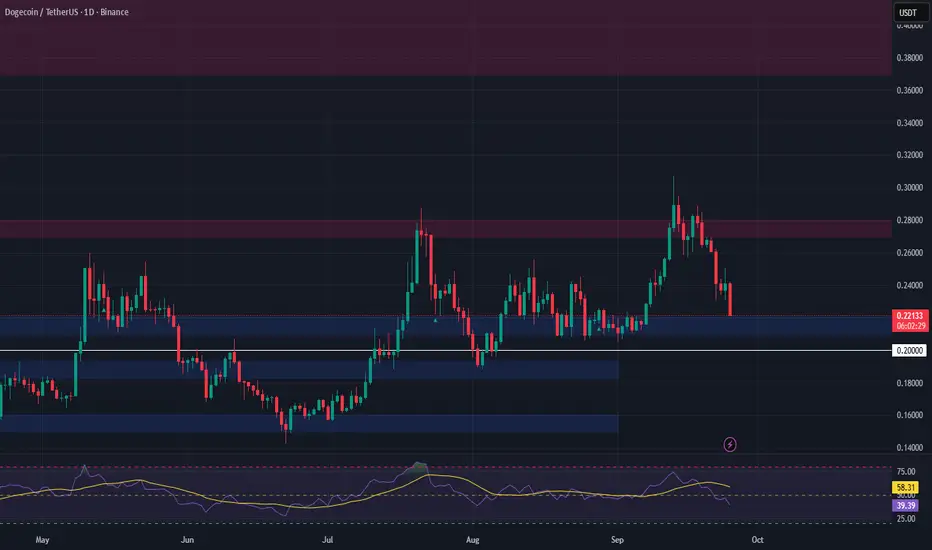
DOGE 1D Analysis – Key Triggers Ahead💀 Hey , how's it going ? Come over here — Satoshi got something for you !
⏰ We’re analyzing DOGE on the 1-Day timeframe timeframe.
👀 In the daily timeframe of Dogecoin, DOGE is within a 170-day box with a ceiling at $0.27 and a floor at $0.15. With a breakout of this box, Dogecoin can experience a parabolic move. DOGE is currently in a triangle-like compression, and with an exit from this compression, DOGE can start its upward movement.
💰 In the daily timeframe of DOGEBTC , We observe that the volume has significantly decreased, and much less Bitcoin is being converted into DOGE! This is quite interesting. The reason DOGE has a box-like behavior against Tether is due to its pairing with Bitcoin. Bitcoin has gained more value against Dogecoin, and DOGE has entered an accumulation phase. Breaking out of this box can help DOGE experience a price jump.
⚙️ Two key RSI zones have been considered: 60 and 38. Exceeding these levels can help DOGE break out of the compression. The 60 level coincides with the break of the $0.22 area and the top of the compression.
🕯 There is a micro buyer zone around $0.15, where every time the price reaches this area, a reversal occurs, accompanied by an increase in the size and volume of green candles. Currently, during the holidays, we are in a compression with lower volume. As the new week begins, we need to see what happens next.
🔔 The alarm zone for Dogecoin is $0.22, which can present some risky trading opportunities, and the next zone is $0.27, which is a strong price action level. Breaking this ceiling can allow DOGE to reach higher recovery levels against Bitcoin.
❤️ Disclaimer : This analysis is purely based on my personal opinion and I only trade if the stated triggers are activated .
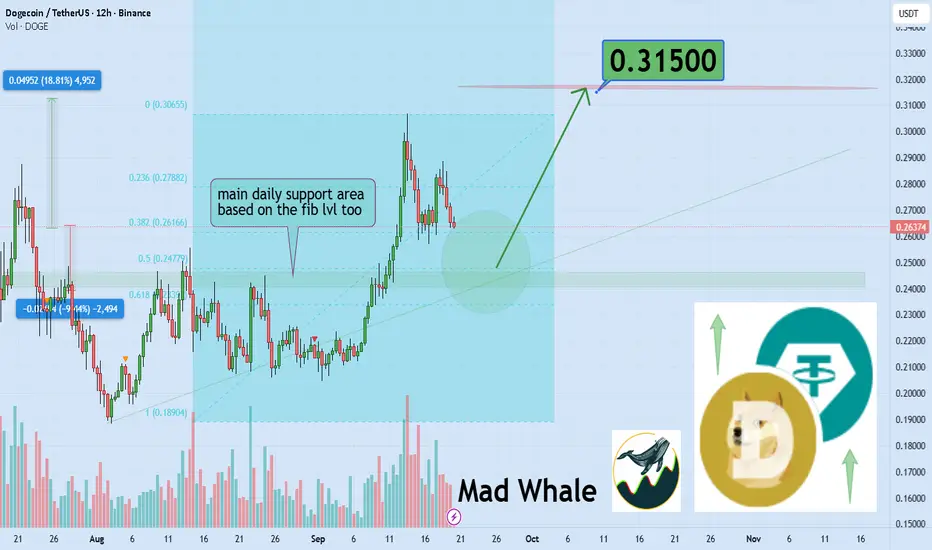
Dogecoin Tests Key Fibonacci, Could Rally 18% Toward 0.315 TargeHello✌️
Let’s analyze Dogecoin’s price action both technically and fundamentally 📈.
🔍Fundamental analysis:
REX-Osprey may launch a Dogecoin ETF (DOJE) in Sept 2025 if the SEC approves. Analysts see about a 75% chance by 2026. Meanwhile, whales bought 1B+ DOGE (~$266M), cutting exchange liquidity. This could boost price if demand rises, but past whale sell-offs caused sharp corrections.
📊Technical analysis:
BINANCE:DOGEUSDT sits near a critical Fibonacci level, daily support, and weekly trendline 📈🐕; holding these zones could unlock at least an 18% upside, targeting 0.315.
📈Using My Analysis to Open Your Position:
You can use my fundamental and technical insights along with the chart. The red and green arrows on the left help you set entry, take-profit, and stop-loss levels, serving as clear signals for your trades.⚡️ Also, please review the TradingView disclaimer carefully.🛡
✨We put love into every post!
Your support inspires us 💛 Drop a comment we’d love to hear from you! Thanks, Mad Whale
DOGEUSDT – TECH SHORT SELL CALL BY THE CHART ALCHEMIST | 1-HOUR DOGEUSDT – TECH SHORT SELL CALL BY THE CHART ALCHEMIST | 1-HOUR TF
27 SEPT 2025 | 14:00 GMT
The coin is moving in a bearish channel (marked in light blue), having recently touched a retest level of previous breakdown on the bearish side. We expect the crypto coin to move further downwards and achieve a couple of bearish targets.
📢 Technical Analysis by Mushtaque Muhammad (The Chart Alchemist)

DOGEUSDTBINANCE:DOGEUSDT is bear-trend but come to key level for reaction. This level is back to base latest bull trend.
Supports: 0.22 - 0.20 - 0.19
Resistance's: 0.234 - 0.256 - 0.28 - 0.31
⚠️ Please control risk management.

DOGE Swing Long Idea - TRKZ ModelDOGE Swing Long Idea w TRKZ Model
📊 Market Sentiment
FED has resumed its rate-cutting cycle, starting with a 0.25% cut in September, with two more 0.25% cuts expected in the coming months. Additionally, institutional liquidity inflows have accelerated as the U.S. officially adopts crypto as part of its reserves. While inflation remains elevated, the weakening labor market is forcing the FED to ease, driving more capital into risk-on assets.
📈 Technical Analysis
Price broke the bearish trendline that had been responsible for the bearish trend since December 2024 and closed above, indicating that price will seek higher levels.
Price also broke the HTF Key Level aggressively and closed above. I expect this level to hold and push us higher.
📘 Model to be used – Broken Trendline Retest supported by HTF Key Zone Retest (TRKZ)
In this model, we need to see a HTF trendline broken aggressively with a close above on HTF. Then, we check for a broken HTF Key Zone (Supply–Demand–Support–Resistance) aligned with the trendline break. Finally, we look to enter after the retest of both the broken trendline and the broken Key Zone.
📌 Game Plan
Carry the position toward the December 2024 high at 0.48$ as a mid–long term swing position. Trail the stoploss after taking first TP, move entry to breakeven, and manage forward.
🎯 Setup Trigger
Setup is valid after retesting the broken trendline and HTF Key Level.
📋 Trade Management
Stoploss: 0.18254$
Targets: TP1: 0.308$ | TP2: 0.4344$ | TP3: 0.4842$
Once TP1 is hit, stoploss will be moved to breakeven to secure profits.
💬 Like, follow, and comment if this breakdown supports your trading! More setups and market insights coming soon — stay connected!
⚠️ Disclaimer: This content is for informational and educational purposes only and does not constitute financial, investment, or trading advice. Always DYOR before making any financial decisions.

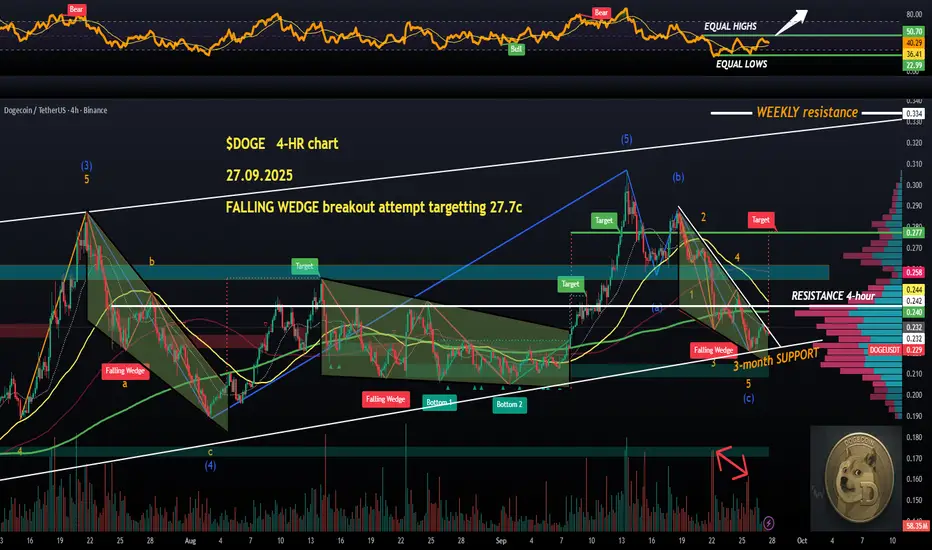
$DOGE attempting a FALLING WEDGE BREAKOUT targetting 27.7cCRYPTOCAP:DOGE has been attempting a FALLING WEDGE breakout all day long and I have mixed feelings about longing the break.
First of all, falling wedges are dominating the 4-hour timeframe, this is the 3rd one in the last two months, the previous ones quickly HIT their targets.
But, we are about to see a DEATH CROSS (yellow 50 MA to cross below green 200 MA), CRYPTOCAP:DOGE is hitting lower highs and lows (although, RSI has been hitting equal lows and highs, BULLISH divergences).
The selling volume has decreased on that last low, and this is a text-book seller capitulation behaviour.
So, even if the wedge BREAKOUT happens this weekend, the volumes are likely NOT going to be big enough to confirm the reversal. In fact, I would expect such a breakout to fail.
The resistances directly overhead (dynamic MAs I mentioned death-crossing plus the horizontal (white) resistance around the 24cent mark...
This breakout will need proper volumes, I would rather look for a short after a potential post-breakout rejection tbh ($0.240-0.245).
Staying put, this looks promising especially just after a bounce from the 3-month old ascending trendline support, but the timing has to be right, not this weekend I think💙👽
🔑 Summary
RSI BULL divergence = momentum base forming.
Price wedge = bullish reversal structure.
Volume = capitulation done, waiting for breakout energy.
👉 Bias = bullish breakout setup, but invalidation = break of 3-month support.
DOGE Looks Bearish (1D)We tried to show the waves from a larger perspective so you can have a better understanding of the path.
It seems that wave "B" of the higher-degree correction has been completed (wave B was a bullish phase), and now we are entering wave "C", which is bearish at a higher degree.
With the price pulling back toward the red zone, we can look for sell/short positions.
On the chart, there is a liquidity pool marked with "$$$", and the first target of this bearish move is to sweep that liquidity pool.
A daily candle closing above the invalidation level will invalidate this analysis.
For risk management, please don't forget stop loss and capital management
When we reach the first target, save some profit and then change the stop to entry
Comment if you have any questions
Thank You

DOGE pump from cmp if holdsFirst DOGE ETF approved, if there are coins that profit off attention it’s memecoins - just liking the R/R in too many factors not to take the risk
DOGEUSDTAccording to the news of Dogecoin ETF that I told you about yesterday,
The price is in a good position now
The daily timeframe is completely bullish
(higher low and high) and according to VWap low and high and moving average and breakeven range that you see in the picture (all intersecting)
It is now in the demand range
And taking risks in this range seems reasonable considering the risk to reward and small stop.
Use this opportunity by relying on your own strategy and perspective and risk management.
Best regards

To much DOGE talk on the timelineI'm bullished on alts in general, but I've heard to much about DOGE in the last couple days. It's not going to pump again until everyone gets quite. You will get a good buying oppertunity under 20 cents. I believe DODGE will head towards $1 after that.

DOGE to $1The move up to .48 late in 2024 is a 2.618 extension above the range from March 2024 (high) to August 2024 (low). A proportional move now from the December 2024 (high) to April 2025 range (low) gets us to $1... See you there.

DOGECOIN #BULLISH #TRENDDogecoin is on the verge of Bullishness I would like to see a big candle closing above for confirmation

Dogecoin short to $0.25349Just a while ago opened up a short trade on dogecoin.
Market is in the process of making a new lower low on 4hr tf and I think it will likely continue to fall impulsively until $0.25349 based on my DTT analysis. Direction, Target and timing.
Also spot a head and shoulder pattern confluence
Some prior wick weekly resistance is around $0.25349 thats where I anticipate it might flip into support and cause a reaction hence I want to get out there.
Time sensitive
3RR for me

DOGE/USDT MarkupAnother Saturday and another chart -- directions? I hope it helps to give some guidance. I feel we need to give that WEEKLY FVG a big dirty sweep before another major upward pounding.

DOGE/USDT – 1H | FVG + Liquidity TrapPrice respected the daily FVG and set up a bullish reaction.
FVGs often act as high-probability demand zones.
Liquidity sweeps at highs/lows fuel the next move.
Stops safely below structure.
This is a textbook SMC sequence:
Respect → Sweep → Expansion.
Daily FVG respected ✅
Prior high liquidity swept ✅
Targeting highs above for clean 3R+
*IGNORE THE DAY NAMES ON DAILY CANDLES - Current 5 candles.

DOGE LONG TRADE SETUPDOGE-USDT
LONG
Entry: 0.24159 or CMP
Target: TP1: 0.25876, TP2: 0.27593, TP3: 0.29310, TP4: 0.31026
Stoploss: 0.20409
Leverage: 1X
Technical Analysis: DOGE/USDT is taking support from its support area there is high change of short term of trend reversal, we can see up trend in short term.

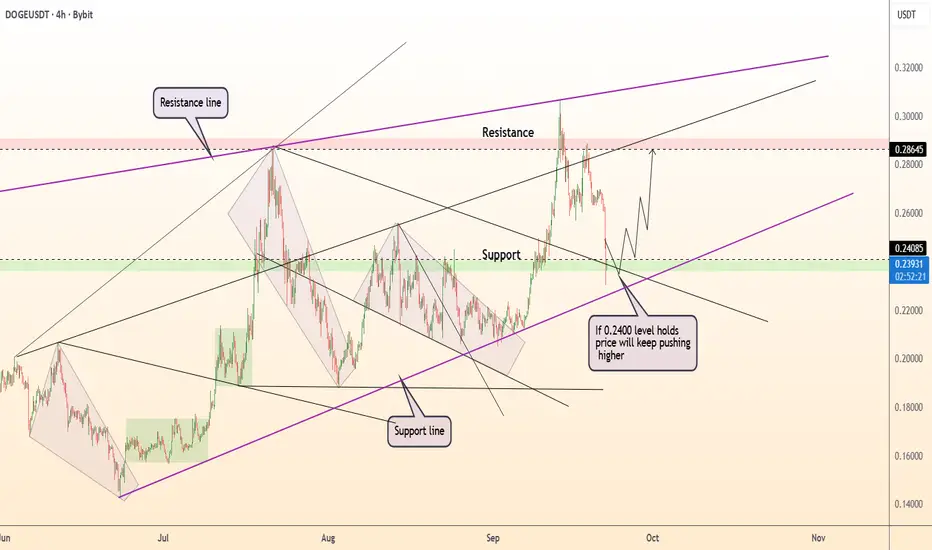
DeGRAM | DOGEUSD reached the support level📊 Technical Analysis
● DOGE/USD is consolidating above the 0.2400 support, aligned with the rising channel structure.
● If this zone holds, price is set to rebound toward 0.2860 resistance, confirming bullish continuation.
💡 Fundamental Analysis
● Dogecoin sentiment is improving as risk assets gain on speculation of Fed rate cuts, while positive crypto inflows support demand for altcoins.
✨ Summary
DOGE/USD holds 0.2400 as key support; continuation targets 0.2860 with bullish momentum fueled by technical structure and improving sentiment.
-------------------
Share your opinion in the comments and support the idea with a like. Thanks for your support!
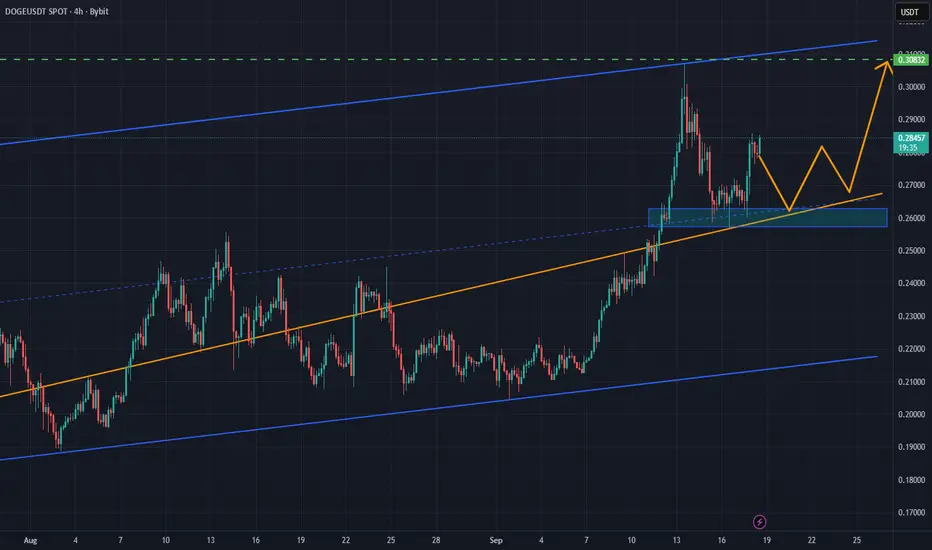
Lingrid | DOGEUSDT Bull Run Retracement PlayThe price perfectly fulfilled my previous idea . BINANCE:DOGEUSDT has shown strong bullish momentum, breaking through a triangle pattern and extending toward the 0.3080 resistance zone. After topping out, price pulled back into the upward trendline, where buyers are attempting to re-establish control. Holding above 0.2600 keeps the bullish structure valid, with potential for another test of 0.3000 and higher levels. The broader trend remains constructive as long as higher lows are maintained.
⚠️ Risks:
A breakdown below 0.2600 could shift momentum and expose 0.2015 support.
Weakness in overall crypto sentiment may cap DOGE’s upside.
Sudden volatility from BTC dominance shifts could pressure DOGE short term.
If this idea resonates with you or you have your own opinion, traders, hit the comments. I’m excited to read your thoughts!

DogeUSDT | 4 H | Market Structure | Consolidation | 1 of 2Based on the chart provided, we cannot take a trade at this stage. The market has printed a Lower High (LH) but has not yet given a Break of Structure (BoS) on the higher time frame.
This indicates that the market is currently in range or consolidation, meaning we do not yet have a clear direction on the higher time frame.
Since the higher time frame (4H) direction is unclear, we cannot confidently take trades on the lower time frame (1H), as there is no strong directional bias.
For now, we should wait for the higher time frame to confirm direction (via a BoS) before considering trades on the lower time frame.

DOGEUSDT Market Report – From Correction to ExpansionDOGEUSDT has completed an impulsive upward cycle, followed by a controlled corrective structure. The earlier surge reflected aggressive positioning from buyers, while the subsequent retracement highlights the market’s need to neutralize inefficiencies and rebalance liquidity.
Price action now reflects a shift from short-term exhaustion into consolidation, where both sides of the market are being tested. The recent structural breaks and measured pullbacks are evidence of liquidity engineering — a common precursor to directional continuation.
The broader market context indicates that this phase is not a reversal but part of a higher-timeframe accumulation process. With order flow stabilizing and volatility compressing, DOGEUSDT is preparing for its next expansionary leg. If momentum sustains, the setup favors a bullish continuation cycle in the coming sessions.

DOGE/USDT: Bullish Structure Intact Above Key Support ZoneDOGE/USDT has displayed strong bullish momentum, breaking out of a triangle pattern and extending toward the 0.3080 resistance zone. Following the peak, price has pulled back to retest the upward trendline, where buyers are stepping in to defend support.
As long as price holds above the 0.2600 level, the bullish structure remains valid, with potential for a retest of 0.3000 and possible extension to higher levels. The broader trend stays positive, supported by the continuation of higher lows within the current market structure.