DOGE/USDT Respecting 4HR FVGDISCOUNT ARRAY
Price is respecting a 4HR FVG
Currently coiling / accumulating.
Low a possible liquidity grab?
🚩 Invalidation: If the supporting FVG breaks with a clear breakaway candle, this setup is void.
DOGEUSDT.5L trade ideas

DOGEUSDTBINANCE:DOGEUSDT is now trading-renge in 0.2240$ resistance and 0.20800$ support.
I wait do to break any support and resistance for buy or sell.
Best support: 0.19100
Best resistance: 0.2450 - 0.26560 - 0.28200
⚠️ Please control risk management.

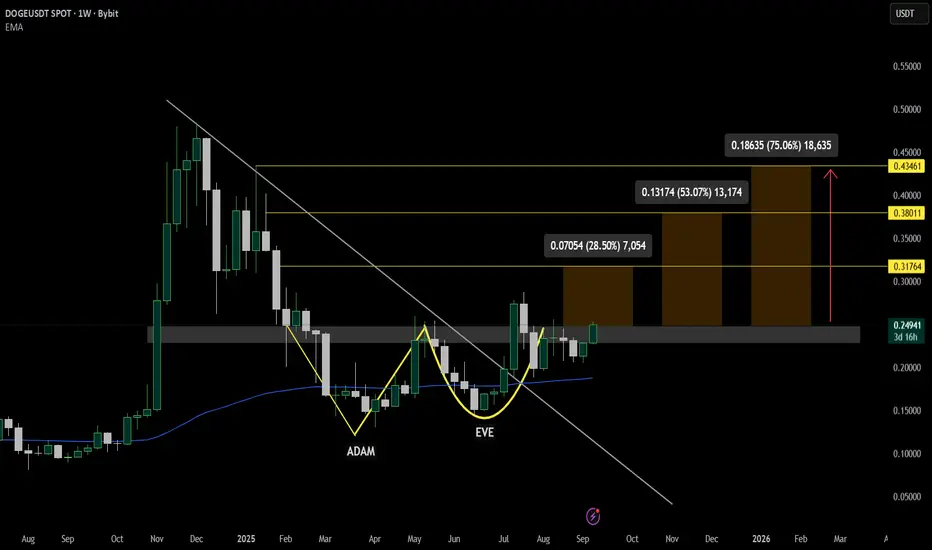
DOGEUSDT – Adam & Eve Pattern Targets $0.43CRYPTOCAP:DOGE on USDT market pair is gearing for a move upside after breaking out above the descending trendline.
With price forming an ADAM & EVE pattern, it going to provide an opportunity for bulls to obtain profits from a bullish rally with it now accumulating at pattern's neckline.
Key upside targets are marked at $0.317, $0.380, and $0.434,
As long as DOGE holds above $0.23,it remains bullish. A weekly close below this level would weaken the structure and could trigger a retest toward $0.20.
Doge - follow the trendDoge - follow the trend
Nearly 500m entered the market - follow it to make money

DOGE season is coming!The structure, price action, and catalysts all look incredibly bullish.
That’s why I rotated half of my CRYPTOCAP:PEPE stack into $DOGE. My overall target for this barbell distribution is a 3x from current levels.
⦿ Key Highlights
- Breaking out after a very long-term consolidation
- Breakout + retest seems complete
- Crypto may be entering the late bull phase
- Altcoins could soon enter the mania stage
- DOGE, as the top and most established memecoin, is well-positioned to lead the pack
- Treasury and ETF launches add strong tailwinds
- DOGE Digital Asset Treasuries (DATs) have started purchasing CRYPTOCAP:DOGE
- CleanCore bought $500M worth of DOGE this week, with another $500M planned in the coming weeks
- Rex-Osprey Dogecoin ($DOJE) goes live today
✅ What’s your read on this move?
Is this the real rotation to alts, or just another fakeout? Drop your take or send this to someone trading memecoins this week. 📢
⚠️ Disclaimer: Crypto products, NFTs, Memecoins are unregulated and can be highly risky. There may be NO regulatory recourse for any losses arising from such transactions.
This content is for educational and informational purposes only and does NOT constitute financial, investment, tax, or legal advice. Cryptocurrencies are highly volatile and speculative — you may lose part or ALL of your investment. I am NOT liable for your losses.
Please do NOT copy my trades. Always consult YOUR financial advisor before making any investment or trading decisions. Or at the very least, consult your cat. 🐱

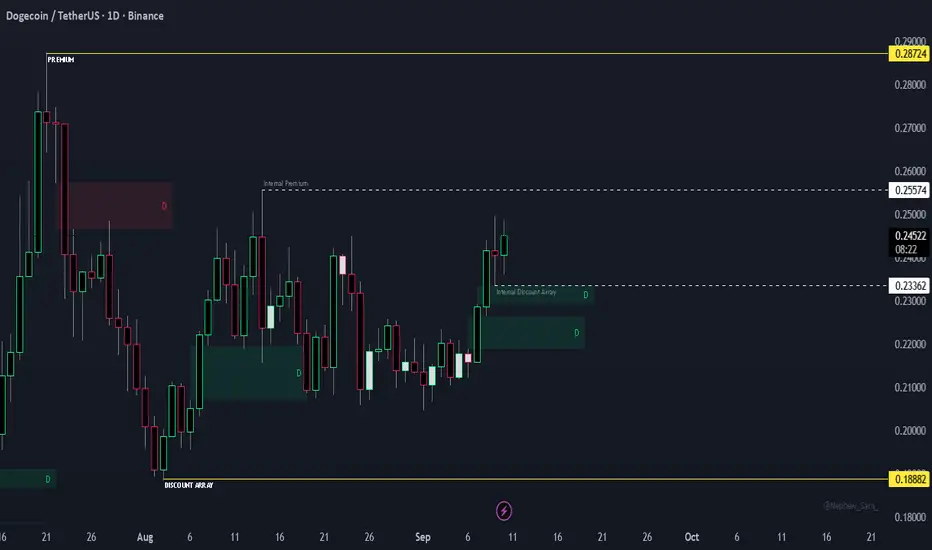
Dogecoin Price Eyes 50% Rally on ETF FrenzyBINANCE:DOGEUSDT price trades near $0.249, pressing against the upper boundary of a symmetrical triangle. A daily close above $0.246–0.249 would confirm a breakout, opening the path toward $0.270, $0.287, and a measured target near $0.381. If momentum stalls, a move back under $0.224 would erase the bullish setup and risk a 10–12% pullback.
Charts show volume will be the key trigger — triangles can flip either way, and only strong buying flow secures continuation.
Supporting sentiment, whale wallets added 230M DOGE (≈$57M) in 24 hours, reflecting confidence in higher prices. The Dogecoin ETF ($DOJE) launch also fuels short-term hype. Still, the Net Unrealized Profit/Loss (NUPL) ratio has climbed to 0.36, a level that has previously led to sharp profit-taking dips.
It is important to watch $0.246–0.249 for confirmation — without volume and follow-through, bulls risk a trap.

DOGE/USDT Waiting for a Sweep of the PCL DAILYSweep of latest interim lows = scalp opportunity (shorter-term reaction).
Price failed to create new FVG off previous FVG. Failing to create new displacement out of the prior FVG is the source of the weak leg. We now need a sweep of the Prior Candle Low (PCL). This clears the liquidity sitting under the most recent leg—interim liquidity inside the structure. Sweeping this might trigger a bounce.
👉 So if you want a higher-probability setup, you wait for the sweep of the first bar that caused the FVG imbalance. That clears the true liquidity pool. you can treat it as a scalp trigger if you’re looking for smaller plays.
Key points:
FVG leg = imbalance created.
PCL sweep = liquidity grab + stop run.
After the sweep, look for rejection/market structure shift on a LOWER TIME-FRAME to confirm entry.
No sweep → no trade.
🚩 Invalidation: If the supporting FVG breaks with a clear breakaway candle, this setup is void.
DOGEUSDT.P 1WDOGE Update
Key Level: $0.27
Pattern: Double Bottom & Triangle
Bullish Target: $0.50 (on breakout)
Action: Watch for volume on a break above $0.27.
DYOR & NFA

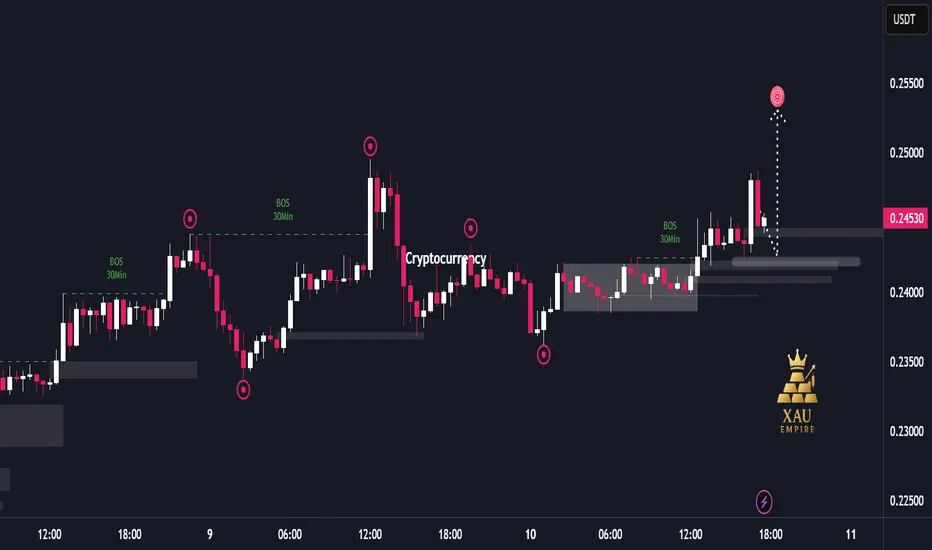
Institutional Flow Driving DOGE Upside Liquidity Hunt📊 Report-Based Analysis
Market Structure:
The chart shows multiple “Break of Structure (BOS)” events, indicating that institutional orders are driving the market direction. Frequent upside BOS suggests that the bullish trend is currently dominant.
Liquidity Movements:
Price has repeatedly hunted liquidity around major highs and lows (sharp wicks and sudden moves triggering stop losses) before returning to its intended direction. This behavior reflects strong institutional control over market flow.
Price Action Dynamics:
First, the market expanded upward with strong bullish momentum.
A sharp correction followed, creating volatility.
Afterwards, price entered a consolidation phase, which later broke to the upside.
Despite a recent rejection, the bullish structure remains intact.
Current Situation:
Price is trading around the 0.245 area. A large bullish candle was followed by a quick rejection, but the broader structure continues to lean bullish. Projections on the chart suggest a potential push higher as liquidity targets remain above.
Market Bias:
Short-term bias remains bullish. The consistent BOS and formation of higher lows show that the market is more likely to continue seeking upside liquidity in the near term.
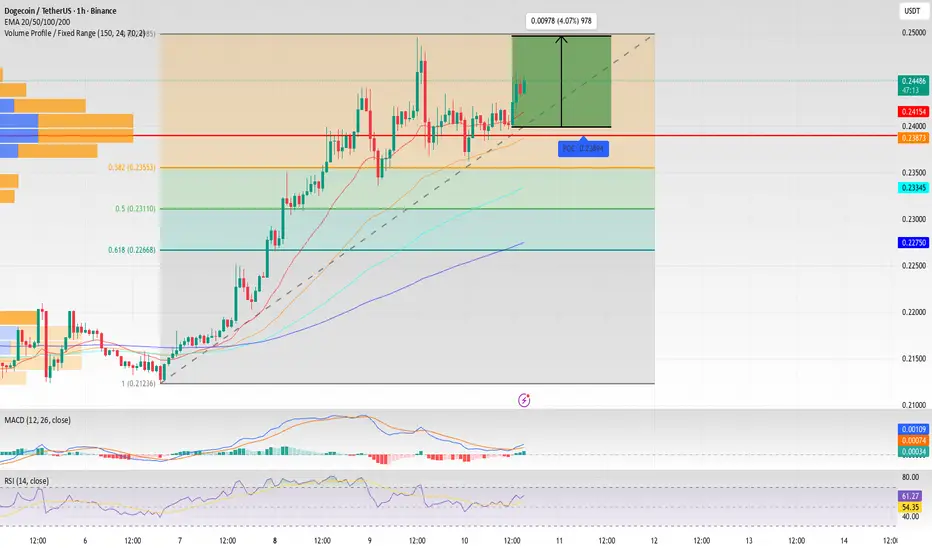
DOGE: Key Support Test.As anticipated, DOGE is pulling back to test a key support zone. This is a make-or-break moment for the bullish scenario.
The main focus is now on the $0.2370 - $0.2355 range. This area represents a strong support cluster, where the Point of Control (POC) from the volume profile converges with the 0.382 Fibonacci level—a prime zone for smart money to accumulate.
A successful hold and bounce from this level would be a strong confirmation of the uptrend's continuation. For those who missed the initial move, this could present an excellent entry point for a spot position. The target remains unchanged: a retest of the highs and a push towards the $0.250 - $0.255 zone.
A breakdown and close below $0.2350 would invalidate the current bullish setup and could trigger a deeper correction toward the $0.2300 area.
We are closely watching the price action in this zone and will act accordingly.
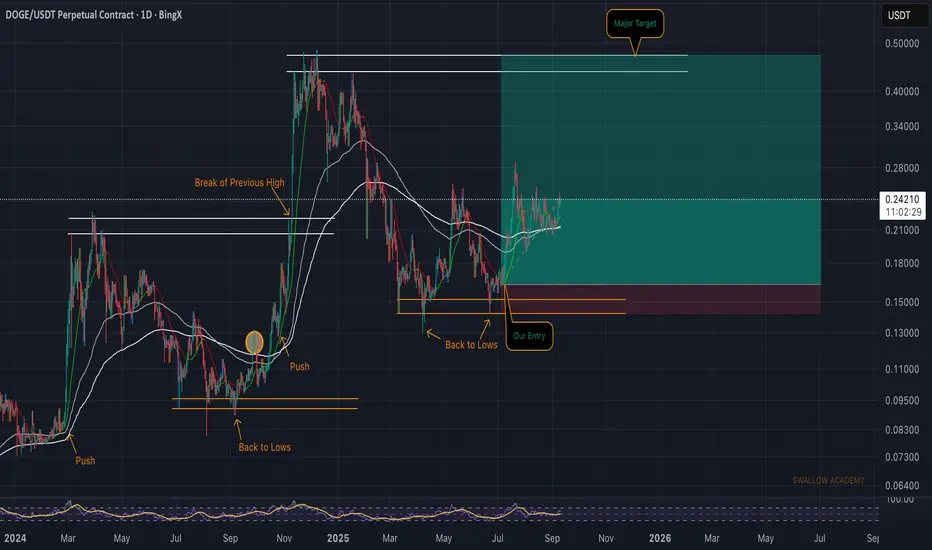
Dogecoin (DOGE): About To Go ParabolicWe’ve been onto CRYPTOCAP:DOGE for quite some time now, and since our last update, the price has given us a solid bounce, securing the EMAs along the way.
From here, the path is clear—we only have one way, and it’s up. The major target remains locked at the higher zone, where we expect the next strong reaction.
Swallow Academy
DOGE is Set to Rise to 0.2400DOGE is Set to Rise to 0.2400
Over the past month, Doge has found a strong support area near 0.2075
Price tested this area several times and bounced back up after testing this area with strong bullish momentum.
In fact, price has retested this area and we also have a small bullish pattern. It is possible that Doge could drop to 0.2130 - 0.2160 before moving back up.
I am looking at two reasonable targets where price bounced back down.
Key targets: 0.2300; 0.2400
You may find more details in the chart!
Thank you and Good Luck!
❤️PS: Please support with a like or comment if you find this analysis useful for your trading day❤️

DogeCoin/USD : Struggling to Hit 0.24002 key levelDogecoin continues to impress with a strong bullish breakout, surging above key resistance levels and sustaining an upward channel. With a recent high of $0.24002, the meme coin is signaling strong momentum as buyers dominate the market.
Updated Setup Strategy
The chart showcases a well-respected *uptrend channel*, supported by three pivot levels (S1, S2, S3), acting as solid stepping stones for price continuation. The price remains above the uptrend line, indicating that bullish strength is intact.
As long as price trades above the channel support and pivots, *buy-on-dips* could be a favorable strategy. A continuation towards higher highs is anticipated if no major resistance halts the current momentum.
Targets
Immediate Bullish Target: $0.24002 (already touched)
Next Psychological Target: $0.25000 and beyond (if momentum holds)
Support Levels:
* S1: Mid-channel pivot
* S2: Lower pivot on uptrend channel
* S3: Base pivot near breakout level
* Major Support:** \$0.21047
These support levels must hold to keep the bullish structure valid.
Final Thought
The *bullish trend in Dogecoin* is well-structured, and with the market sentiment leaning positive, there's potential for further upside. However, watch for any rejection near psychological zones like \$0.25000. Maintain proper risk management and trail stops to protect profits during this rally.

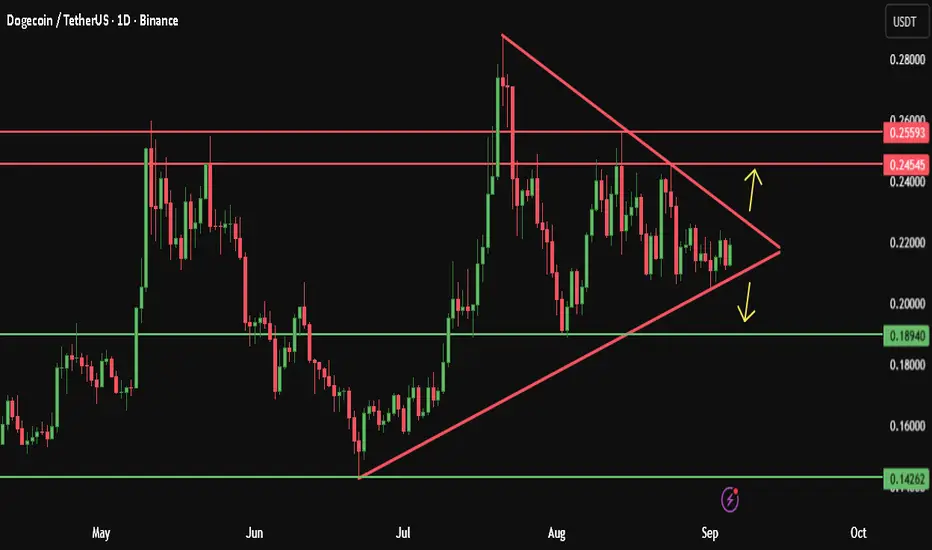
Dogecoin A potential explosive move is comingWe are currently observing the formation of a Symmetrical Triangle, suggesting the market is coiling up for a significant move.
A bullish breakout to the upside would likely target the upper resistance zone 0.2454 and 0.25593.
In the event of a bearish breakdown, we could see a decline towards the lower support at 0.18940 and 0.14262.
Let’s keep a close eye on this pattern for a confirmed direction.
please note :
this is not financial advice — it reflects only my personal opinion.
PLEASE always do your own research before trading .. Good luck with your trades.
DeGRAM | DOGEUSD above the support area📊 Technical Analysis
● DOGE/USD held firm above the 0.2000 demand zone, forming a potential bottom and defending the green support area.
● Price structure suggests a breakout setup, with resistance near 0.2450 as the next key objective if momentum carries through.
💡 Fundamental Analysis
● DOGE sentiment is improving as crypto market volatility eases, while whale accumulation reports and sustained social media traction add bullish fuel.
✨ Summary
Bullish above 0.2000; targets 0.2450. Invalidation on a close below 0.2000.
-------------------
Share your opinion in the comments and support the idea with a like. Thanks for your support!

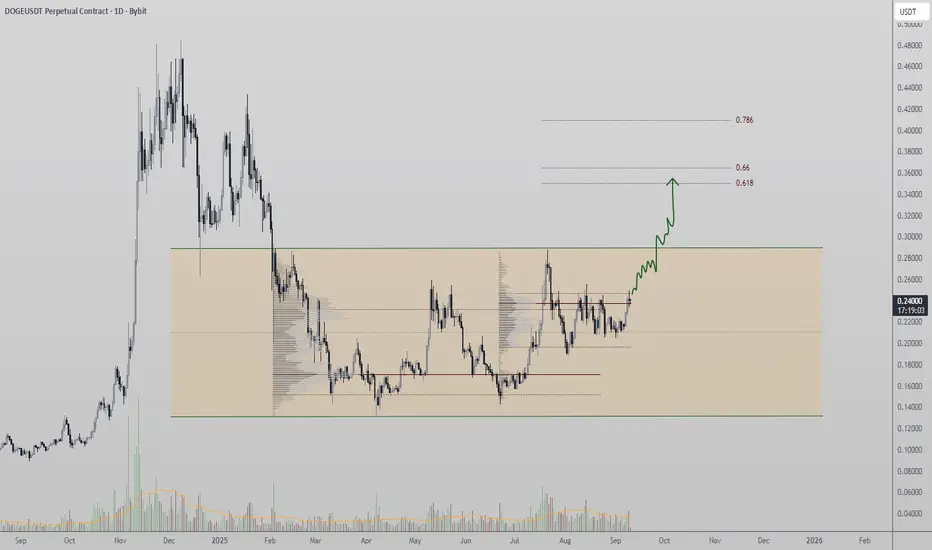
DOGE Retests Point of Control With Bullish ReactionDOGE is attempting to reclaim its local point of control, a major volume resistance. A close above this level with volume support could trigger upside continuation.
DOGE has shown a bullish reaction at the main trend point, with buyers stepping in to defend the structure. The key test now lies at the local point of control, a critical volume-defined resistance level.
Key Technical Points:
- Bullish Reaction at Trend Point: Market participants showing demand.
- Point of Control Resistance: Closing basis above this level is crucial.
- Potential Rally Toward $0.618: A confirmed breakout would open the path higher.
Price action suggests DOGE is preparing for continuation, but the market needs confirmation through volume influx. Once volume aligns with price closing above the point of control, probability for upside acceleration increases significantly.
What to Expect in the Coming Price Action
DOGE’s short-term outlook remains bullish, provided price holds above the point of control. A volume-backed breakout would set the stage for a run toward $0.618, while failure here risks renewed range trading.
DOGE/USDT LPL on 4hr chart. Trading on 1hr time-framePrice failed to create new FVG off previous FVG and instead a LOW PROBABILITY LEG (LPL) was formed ON 4HR time-frame. Price may possibly use this LPL as a new discount array to move higher from. All the best.

DOGE 1D – Golden Cross Confirmed, Eyes on $0.287 Breakout?Dogecoin has printed a golden cross with the 50 EMA crossing above the 200 EMA — a key bullish signal. Price is holding above both moving averages and remains within the Fib retracement cluster of $0.177–0.217.
Upside targets:
$0.287 = first major resistance.
$0.416 and $0.479 = macro resistance levels above.
Downside invalidation:
A close back below the 50/200 EMAs would weaken the golden cross momentum.
Break under $0.201 exposes the 0.786 retrace near $0.177.
Stoch RSI is overbought, hinting at short-term cooling, but structure stays bullish while the golden cross holds.
📊 Key focus: Can DOGE capitalize on the golden cross to push past $0.287, or will overbought momentum trigger another Fib retest?

DOGE Swing Long Idea DOGE Game Plan
📊 Market Sentiment
Overall sentiment remains bullish, supported by expectations of a 0.25% rate cut in the upcoming FOMC meeting. A weakening USD and increasing global risk appetite are creating favorable conditions for further upside in crypto assets.
📈 Technical Analysis
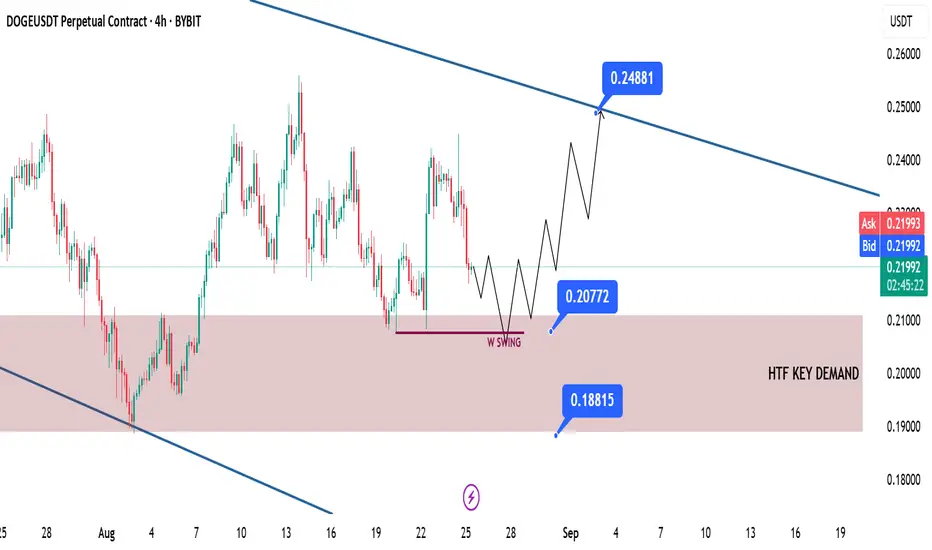
Price is retracing towards the HTF Demand zone, which I expect to act as a bounce area.
Moreover, price currently seems to be seeking liquidity to fuel its next bullish move. That liquidity could be the weekly swing low at $0.207.
📌 Game Plan
Wait for price to reach the HTF Demand zone.
Look for price to sweep liquidity and close back above the $0.207 level.
🎯 Setup Trigger
I will be waiting for a 4H market structure shift before entering the trade.
📋 Trade Management
Stoploss: Daily close below HTF support zone — $0.188
Target: $0.248
💬 Like, follow, and comment if you find this setup valuable!
⚠️ Disclaimer: This content is for informational and educational purposes only and does not constitute financial, investment, or trading advice. Always do your own research before making any financial decisions.

DOGE ready to bark againTechnically , DOGEUSDT on the daily chart is breaking out of an ascending triangle. After a period of compression, the breakout on volume suggests a potential bullish continuation. The immediate target is $0.3300, and if momentum persists, the move could extend to $0.3777. Key support remains near $0.19–0.20, reinforced by the 200-day moving average.
On the fundamental side, DOGE gains attention from speculation about integration into the X (Twitter) ecosystem, with Elon Musk keeping the narrative alive. The broader recovery in the crypto market and renewed interest in altcoins also serve as supportive factors.
Tactically, a sustained close above $0.25 would confirm the bullish setup. As long as volumes remain strong, the path toward $0.33 and beyond looks realistic.
DOGE is still the classic hype-driven asset - and it seems ready to bark again.

Dogecoin Wave Analysis – 8 September 2025
- Dogecoin broke daily Triangle
- Likely to rise to resistance level 0.2600
Dogecoin cryptocurrency recently broke the resistance trendline of the daily Triangle from the middle of July.
The breakout of this Triangle should accelerate the active impulse wave iii of the short-term impulse wave 3 from the start of August.
Given the strongly bullish crypto sentiment seen today, Dogecoin cryptocurrency can be expected to rise toward the next resistance level 0.2600 (former monthly high from August).

