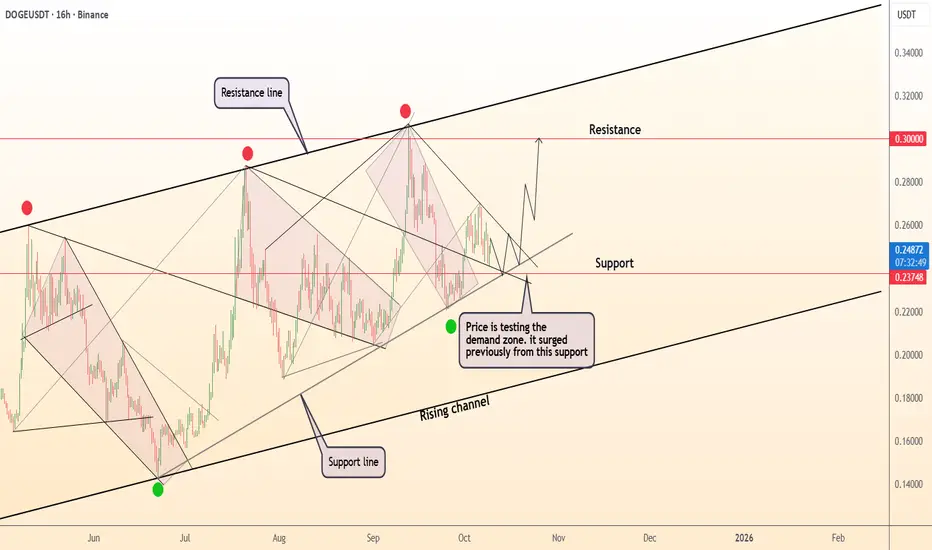
DeGRAM | DOGEUSD is testing the demand zone📊 Technical Analysis
● DOGE/USD is testing the rising channel’s lower boundary near 0.237, a level that previously triggered a strong rebound toward 0.30 resistance.
● Price structure shows accumulation within a demand zone, and bullish momentum could build once buyers confirm a close above 0.248.
💡 Fundamental Analysis
● Dogecoin benefits from renewed social media attention and growing integration in payment networks, supporting medium-term optimism.
✨ Summary
● Long bias above 0.237; targets 0.30. Support holds firm as bullish momentum rebuilds amid improving sentiment.
-------------------
Share your opinion in the comments and support the idea with a like. Thanks for your support!
DOGEUSDT.5S trade ideas
Taking a trade on DOGE/USDTI’m a new trader and just started sharing my experience here. This is not financial advice, so take your own risk

DOGE Hidden Bullish Divergence Faces $0.22 RiskBINANCE:DOGEUSDT ’ price may be cooling off after a volatile week. On the 4-hour chart, DOGE is holding an ascending support line within a rising wedge. Between September 30 and October 7, price made a higher low while RSI made a lower low — a hidden bullish divergence that often signals weakening seller strength and a possible rebound.
As long as the $0.246 support holds, DOGE could aim for $0.257, $0.270, and $0.278. A close below the trendline, though, would shift bias back to bearish, exposing $0.234 and $0.226. The structure still leans cautious, with any small negative catalyst able to trigger another dip.
On-chain data supports mixed sentiment. Whales added about 130 million DOGE since October 2, showing quiet buying, but exchange balances climbed to 17.7% — a level that’s historically marked major corrections. DOGE’s short-term setup favors a rebound attempt, but $0.22 remains the key risk zone if buyers fail to hold the trendline.

DogeusdtAgain same construction double bottom on the air
It will kiss the cloud . Just wait this year will be crazy .
Targets on the 📈📈📈📉📉📉📉
#btc #altseason #meme

Taking a trade on DOGE/USDTI’m a new trader and just started sharing my experience here. This is not financial advice, so take your own risk

DOGE’s Rally Faces Risk as Bearish Divergence EmergesDespite DOGE’s double-digit gains over the past two weeks, its Chaikin Money Flow (CMF) indicator has slipped into negative territory, signaling weakening capital inflows. This forms a bearish divergence, where price continues to rise while money flow declines — a classic sign of fading momentum.
If buying activity doesn’t pick up soon, this divergence could precede a short-term pullback, suggesting that DOGE’s current uptrend may be losing strength.


DOGEUSDT – TECH SHORT SELL CALL BY THE CHART ALCHEMIST | 1-HOUR DOGEUSDT – TECH SHORT SELL CALL BY THE CHART ALCHEMIST | 1-HOUR TF
27 SEPT 2025 | 14:00 GMT
The coin is moving in a bearish channel (marked in light blue), having recently touched a retest level of previous breakdown on the bearish side. We expect the crypto coin to move further downwards and achieve a couple of bearish targets.
📢 Technical Analysis by Mushtaque Muhammad (The Chart Alchemist)

DOGEUSDT Slightly Up, Targeting New HighsIn recent days, DOGEUSDT has seen a slight increase, recovering after hitting its lowest point in several weeks. The growth of DOGE is mainly driven by buying activity at lower levels and improved market sentiment, although the USD remains strong due to positive economic data from the US.
The DOGEUSDT chart is currently trading within a clear upward price channel . The price has found strong support at 0.1950 and is showing signs of recovery. If DOGE can continue to break through the resistance at 0.2730, there is a high likelihood of reaching the target of 0.2730 or higher in the short term.
DOGEUSDT has the potential to continue rising due to the current recovery and strong technical support. Keep an eye on market confirmation to capitalize on trading opportunities.

DOGE — Watching for a Relief Bounce from SupportDogecoin has pulled back into a key support zone at $0.21–$0.22, a level that has historically acted as both resistance and support. With the broader market showing signs of consolidation, this area could offer a short-term bounce opportunity.
That said, this is likely a relief rally within a broader downtrend, so managing risk is critical. A failure to hold this support could lead to a deeper correction later this month.
🔹 Trade Plan:
• Entry Zone: $0.21–$0.22
• Targets: $0.27–$0.28, $0.37–$0.44
• Stop Loss: Below $0.20
This is a spot-only setup with an asymmetric risk-reward profile if the bounce materializes. Avoid overleveraging and stick to your plan.
Can #DOGE continue to rise?📊Can #DOGE continue to rise?
🧠From a structural perspective, a double bottom bullish pattern is forming on the daily chart, though its ideal target hasn't yet been reached, so we can remain optimistic. We're currently near the neckline support zone. If we can stabilize there over the next period of time, we could potentially initiate a new uptrend.📈
➡️If we fail to stabilize at the neckline support zone, the next support level to watch is around 0.243, with extreme support around 0.2046.
🤜If you like my analysis, please like 💖 and share 💬
BITGET:DOGEUSDT.P

Market overview for DOGEThe current correction is sufficient within the last wave of growth, but there are still no signs of a reversal. A breakout of the current fractal at 0.23067 could bring the price to the ascending trendline, but most likely it will break and head toward the 200-day moving average.
As long as the price doesn’t reclaim 0.25 , I’m not considering long positions under the current formations, especially given that the price is already below the 50-day moving average.

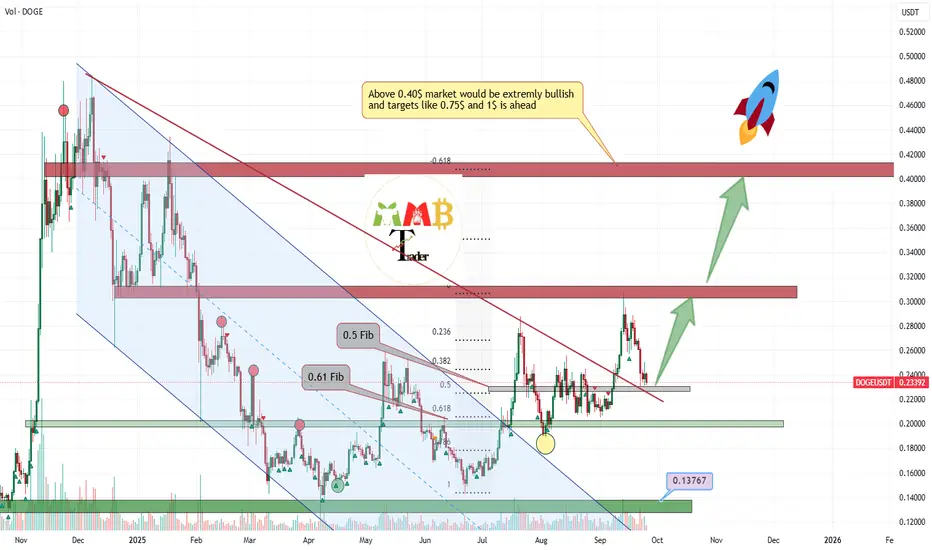
DOGE is once again near 0.5 & 0.61 Fib levels---> pumpPrevious times it test these levels and pump strong and hit new high this time it may happen again and this time we are looking for at least 0.4$ as target or maybe more gain after breaking that but for now we need the supports hold strong first else market would be dead and range for a while.
DISCLAIMER: ((trade based on your own decision))
<<press like👍 if you enjoy💚
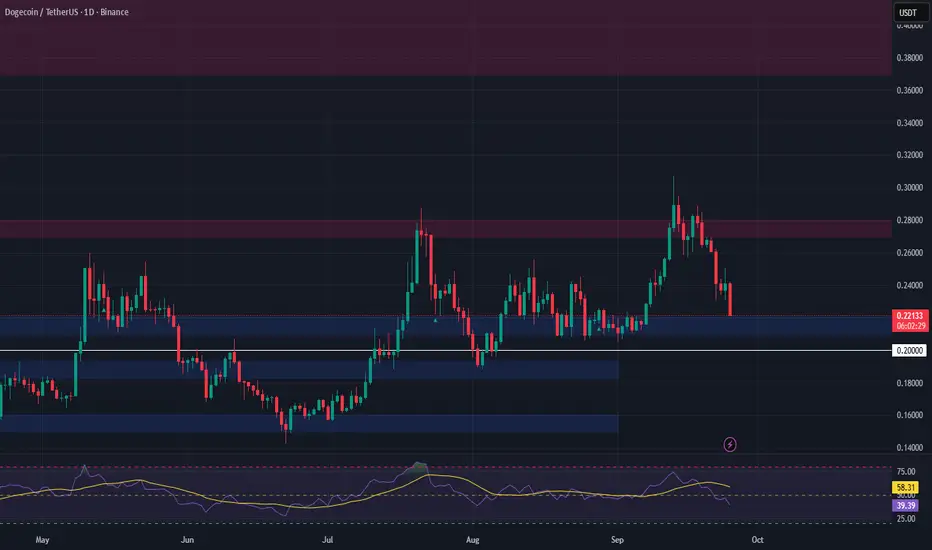
Dogecoin: Uptrend Intact, Eyeing $0.90–$1.00 ZoneCRYPTOCAP:DOGE #Crypto #Memecoin #ElonMusk — September 24, 2025.
Price (Sept 24, 2025): $0.24700
Chart (1D):
•
•
💡 Entry & Exit:
Entry: $0.24700
🎯 Take Profit: $0.8900 (+260.32%)
My View:
Dogecoin pulled back nicely, but the overall uptrend is still intact. We’re seeing that rounded base start to tilt toward acceleration. Remember, this is Elon Musk’s meme coin = and it’s also tradable on Robinhood.
Looking at Coinbase order books, there’s a grid of buy orders stacked all the way up to $2.50. If we factor in a light breakout and the 1.618 Fibonacci extension, the $0.90–$1.00 range looks like a logical zone to lock in gains and move on from this coin.
The recent dip across crypto definitely shook a lot of people = myself included.

DOGEUSDTAccording to the news of Dogecoin ETF that I told you about yesterday,
The price is in a good position now
The daily timeframe is completely bullish
(higher low and high) and according to VWap low and high and moving average and breakeven range that you see in the picture (all intersecting)
It is now in the demand range
And taking risks in this range seems reasonable considering the risk to reward and small stop.
Use this opportunity by relying on your own strategy and perspective and risk management.
Best regards

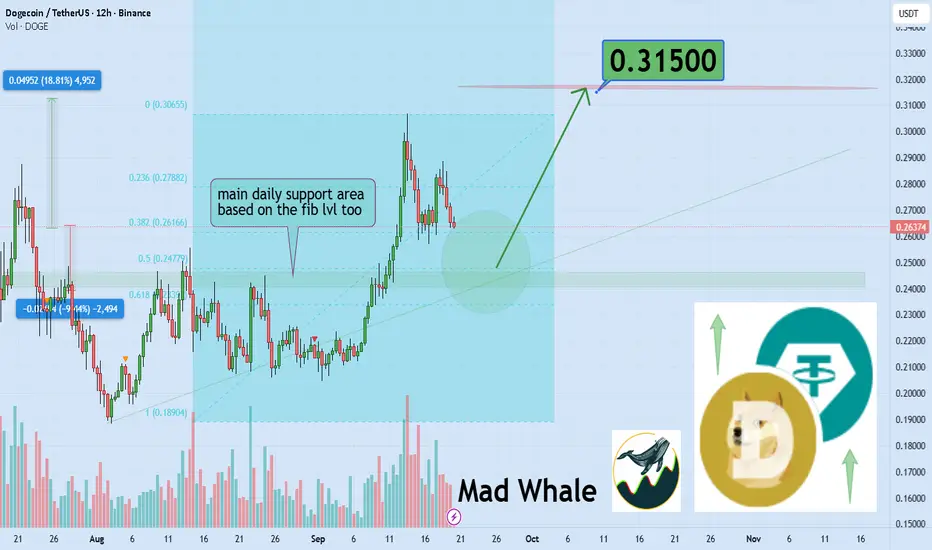
Dogecoin Tests Key Fibonacci, Could Rally 18% Toward 0.315 TargeHello✌️
Let’s analyze Dogecoin’s price action both technically and fundamentally 📈.
🔍Fundamental analysis:
REX-Osprey may launch a Dogecoin ETF (DOJE) in Sept 2025 if the SEC approves. Analysts see about a 75% chance by 2026. Meanwhile, whales bought 1B+ DOGE (~$266M), cutting exchange liquidity. This could boost price if demand rises, but past whale sell-offs caused sharp corrections.
📊Technical analysis:
BINANCE:DOGEUSDT sits near a critical Fibonacci level, daily support, and weekly trendline 📈🐕; holding these zones could unlock at least an 18% upside, targeting 0.315.
📈Using My Analysis to Open Your Position:
You can use my fundamental and technical insights along with the chart. The red and green arrows on the left help you set entry, take-profit, and stop-loss levels, serving as clear signals for your trades.⚡️ Also, please review the TradingView disclaimer carefully.🛡
✨We put love into every post!
Your support inspires us 💛 Drop a comment we’d love to hear from you! Thanks, Mad Whale
Doge (DOGE): Good Chance To Get +15% From HereDOGE is trading near the top trendline of its rising channel and currently bouncing between that resistance and the lower support line. The EMAs are curved tightly together, adding pressure and showing that price is compressing heavily. It’s normal to see quick back-and-forth swings inside such a setup — right now the current zone looks logical for a push if buyers take control and force a breakout.
Swallow Academy

DOGECOIN #BULLISH #TRENDDogecoin is on the verge of Bullishness I would like to see a big candle closing above for confirmation

Doge - LONg zone activatedDoge - LONg zone activated
in a previus analysis i shared a plan with clear long signal
right now - the price is following it

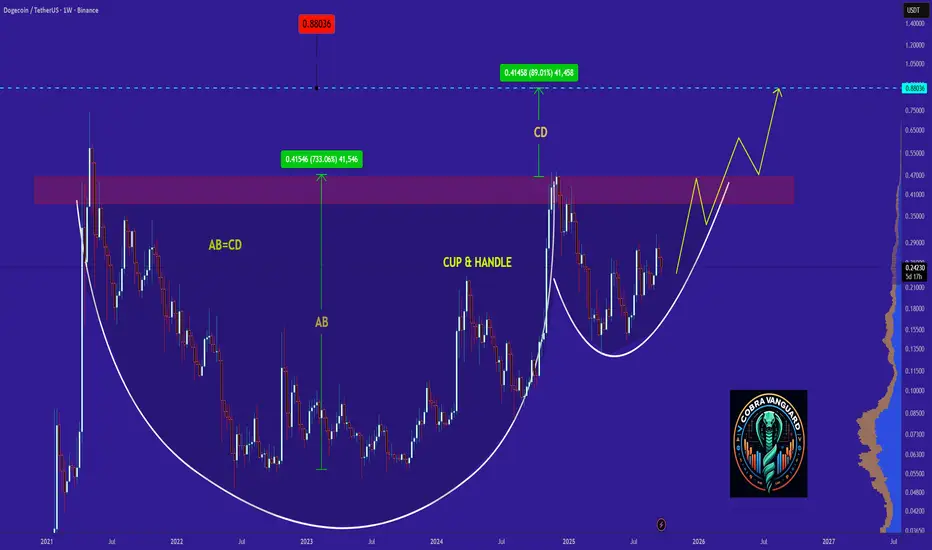
DOGE's Situation, A Comprehensive Analysis !!!It appears that the price is forming a cup and handle pattern, and if this occurs, it could push the price above $0.50.
Best regards CobraVanguard.💚
DOGE LONG TRADE SETUPDOGE-USDT
LONG
Entry: 0.24159 or CMP
Target: TP1: 0.25876, TP2: 0.27593, TP3: 0.29310, TP4: 0.31026
Stoploss: 0.20409
Leverage: 1X
Technical Analysis: DOGE/USDT is taking support from its support area there is high change of short term of trend reversal, we can see up trend in short term.

DOGE Looks Bearish (1D)We tried to show the waves from a larger perspective so you can have a better understanding of the path.
It seems that wave "B" of the higher-degree correction has been completed (wave B was a bullish phase), and now we are entering wave "C", which is bearish at a higher degree.
With the price pulling back toward the red zone, we can look for sell/short positions.
On the chart, there is a liquidity pool marked with "$$$", and the first target of this bearish move is to sweep that liquidity pool.
A daily candle closing above the invalidation level will invalidate this analysis.
For risk management, please don't forget stop loss and capital management
When we reach the first target, save some profit and then change the stop to entry
Comment if you have any questions
Thank You

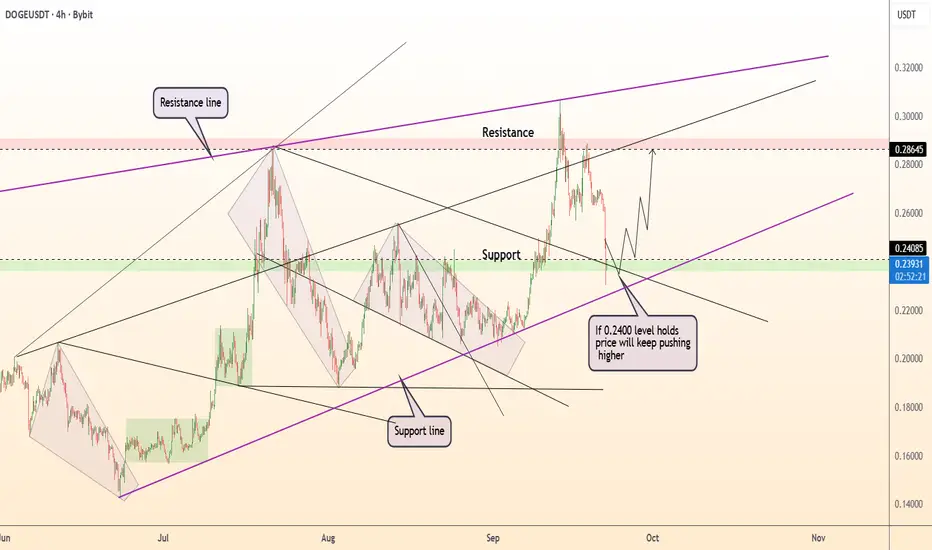
DeGRAM | DOGEUSD reached the support level📊 Technical Analysis
● DOGE/USD is consolidating above the 0.2400 support, aligned with the rising channel structure.
● If this zone holds, price is set to rebound toward 0.2860 resistance, confirming bullish continuation.
💡 Fundamental Analysis
● Dogecoin sentiment is improving as risk assets gain on speculation of Fed rate cuts, while positive crypto inflows support demand for altcoins.
✨ Summary
DOGE/USD holds 0.2400 as key support; continuation targets 0.2860 with bullish momentum fueled by technical structure and improving sentiment.
-------------------
Share your opinion in the comments and support the idea with a like. Thanks for your support!