Dogecoin (DOGE) Update — $0.14 Reclaims SupportDogecoin continues to stabilise above the $0.14 region after a sharp fakeout trapped late sellers. The recovery back into support has created early signs of a potential three-drives reversal pattern forming.
Price action now shows a consistent defence of this level, and with a third drive taking shape, bullish pressure is gradually building. Holding above $0.14 increases the chances of an expansion move into higher resistance zones.
Key Points
- Price has reclaimed a key support level after a liquidity sweep.
- Market structure suggests a possible shift in short-term momentum.
- A break above local resistance may trigger continuation to the upside.
What to Expect
As long as DOGE stays above $0.14, the probability of a push toward $0.21 and possibly $0.24 increases. Losing this level would invalidate the pattern and restore bearish control.
Trade ideas

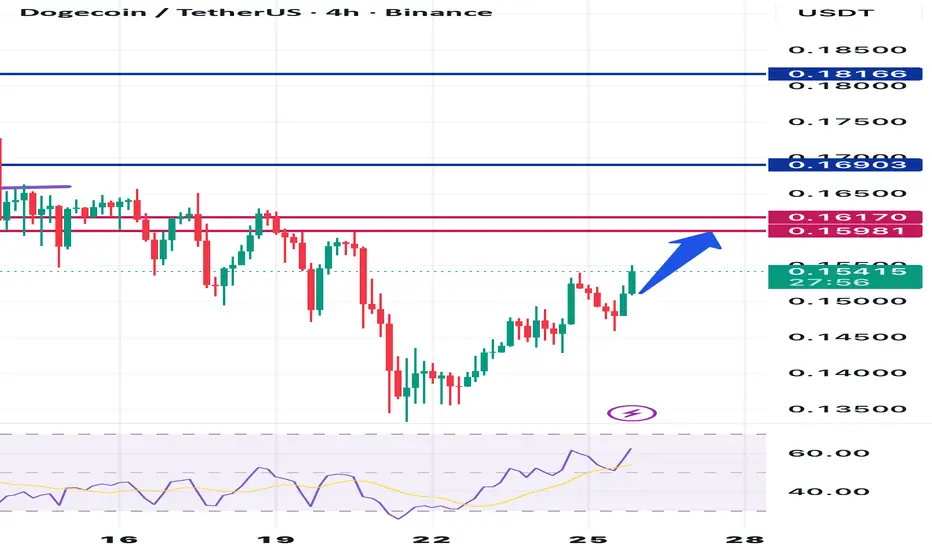
DOGE Ready to Break $0.16000 – Strong Bullish Momentum Ahead!Currently, DOGE is fluctuating within a clear accumulation structure with strong support at $0.14700 and resistance near $0.16000. After testing this support zone, the price could break above the resistance, signaling the potential for a strong continuation of the bullish trend.
Reasons for the increase:
- ETF Hype & Institutional Confidence: The listing of the DOGE spot ETF on the US exchange has drawn attention from both institutional and retail investors. This could lead to a large influx of capital into DOGE, creating strong buying pressure.
- Technical Accumulation & Bullish Setup: The current price structure indicates a strong breakout potential if DOGE surpasses $0.154, with solid support levels below, such as $0.14700, which reinforces the likelihood of continued upward momentum.
- FOMO Opportunity & Market Sentiment: As a meme-coin, Dogecoin is highly sensitive to news and market "hype." When positive factors such as ETF announcements or favorable news arise, DOGE is likely to create a strong surge due to FOMO (Fear of Missing Out) sentiment.
Next scenario:
If DOGE surpasses $0.15400, it is likely to continue the bullish rally, targeting $0.16000, and possibly extend towards $0.17000. Both market factors and technical analysis suggest strong potential for further upward movement in the near term.
In summary: DOGE currently has strong upside potential thanks to ETF support and solid technical accumulation. If the market maintains a positive sentiment and DOGE breaks resistance, the bullish trend will continue.

Long trade 🟩 1. Trade Details
Pair: DOGEUSDT
Direction: Buyside Trade
Date: Thu 27th Nov 2025
Time: 7:29 PM
Session: London PM → NY Session PM
Entry TF: 5-min
Entry: 0.15039
Take Profit: 0.15979 (+6.25%)
Stop Loss: 0.14842 (−1.31%)
Risk-to-Reward: RR = 8.2R
🟧 3. Liquidity Story (ICT Liquidity Logic)
This trade typically follows a ICT liquidity cycle:
1️⃣ Sell-Side Sweep
Multiple sell-side lows at 0.1485 were taken out.
Stop-hunts engineered during London PM session.
2️⃣ Inducement Layer
Local double bottom + equal lows gave retail a false "floor".
Smart money used these as inducement for the long entry.
3️⃣ Displacement
Strong displacement candle breaks through 0.15120.
Fair Value Gaps (FVGs) form on 5m, 3m, 1m.
4️⃣ Rebalance & Entry
Price pulled back into a stacked FVG region + 5m OB.
Entry triggered exactly inside the discount zone of the bullish leg.
5️⃣ Buyside Liquidity Target
TP placed into the 0.15970 region — aligning with the next buyside pool.
🟥 4. Entry Logic
Entry Model: 📌 5-min BOS → 3-leg pullback → FVG → Bullish Order Block
ICT model confirmed:
Break of Structure (BOS) on 5m
Micro MSB on 1m
Retest into confluence zone:
FVG (5m)
Discount pricing
Bullish OB (institutional candle)
EMA + WMA crossover shift
Stop Placement:
Below: Recent liquidity sweep, OB invalidation point and 0.25 fib pullback zone
Take Profit Logic: Target aligns with the next premium inefficiency
Buyside liquidity resting at 0.16000–0.16150
🟪 5. Market Sentiment & Session Narrative
Session Flow: London PM created the liquidity base.
New York PM session delivered the displacement leg confirming buyers.
Low volatility midday compression → classic NY PM expansion setup.
Retail narrative:
We assumed the range was breaking down; price engineered a bearish trap, swept liquidity, and reversed.
Smart Money perspective:
Accumulation → displacement → rebalance → continuation model.
🟫 6. Outcome
Status: Active
Initial reaction: Bullish follow-through after FVG fill
Invalidation: Break below 0.14820

DOG USDT LONG SIGNAL---
📢 Official Trade Signal – DOG/USDT
📈 Position Type: LONG
💰 Entry Price: Market
---
🎯 Take-Profit Targets (Partial Exits):
• TP1: 0.15680
• TP2: 0.15929
• TP3: 0.16244
• TP4: 0.16522
• TP5: —
• TP6: —
---
🛑 Stop-Loss: 0.15134
📊 Timeframe: 15m
⚖️ Risk/Reward Ratio: 3.72
💥 Suggested Leverage: 5× – 10×
---
🧠 Technical Summary
DOG shows a bullish reaction from intraday demand and is forming higher lows on the 15m chart.
Momentum indicators support continuation toward liquidity levels at 0.1568 → 0.15929 → 0.16244 → 0.16522.
As long as price remains above 0.15134, bullish structure is intact.
---
⚙️ Trade Management Rules
✔ Take partial profit at TP1
✔ Move SL to Break-Even after TP1
✔ Trail SL toward higher targets
✔ Avoid re-entry if SL is hit
✔ Confirm structure before entering
---
📌 TradingView Hashtags
#DOGUSDT #DOG #CryptoSignal #LongSetup
#TradingView #FuturesTrading #Altcoins #TechnicalAnalysis
-

DOGEUSDT UPDATE#DOGE
UPDATE
DOGE Technical Setup
Pattern: Falling Wedge Pattern
Current Price: $0.151
Target Price: $0.215
Target % Gain: 41.50%
Technical Analysis: DOGE is breaking out of a falling wedge pattern on the 4H chart, showing bullish momentum building after a strong move above the resistance trendline. Price reclaimed the key support zone highlighted on the chart, confirming strength as buyers stepped in. The breakout is supported by improving structure, and the market is now aiming toward the next major resistance area near the target zone.
Time Frame: 4H
Risk Management Tip: Always use proper risk management.


DOGEUSDT - Only One Scenario Left: UP After a long and painful correction, Dogecoin has finally put in what looks like a major bottom.
The downside momentum is completely exhausted, volume is drying up on the lows, and the structure is forming higher lows — all classic signs that the bear phase is done.
I no longer see any realistic bearish scenario here.
For me, there is only one direction from current levels: UP.
Bullish targets (open-ended):
1. 0.16 – 0.162 (first serious resistance)
2. 0.173+ (next major zone)
3. 0.185+ in case of real FOMO
❌Invalidation:
Only a hourly close below $0.1483 would make me reconsider the bullish bias.
Risk: Always use proper risk management!
⚠️ Disclaimer: This is not financial advice. This is just my personal technical view. Trading carries high risk — DYOR and trade at your own responsibility.
If you agree that Dogecoin is ready to run — smash that LIKE button! 🔥
Follow for more crypto calls!
Comment below: which coin should I analyse next? 👇

DOGEUSDT 12H#DOGE is moving inside a falling wedge pattern on the 12H timeframe. Consider entering this coin only after a solid breakout. If the breakout confirms, the potential upside targets are:
🎯 $0.16728
🎯 $0.18615
🎯 $0.20140
🎯 $0.21665
🎯 $0.23837
🎯 $0.26603
⚠️ Always remember to use a tight stop-loss and maintain proper risk management.

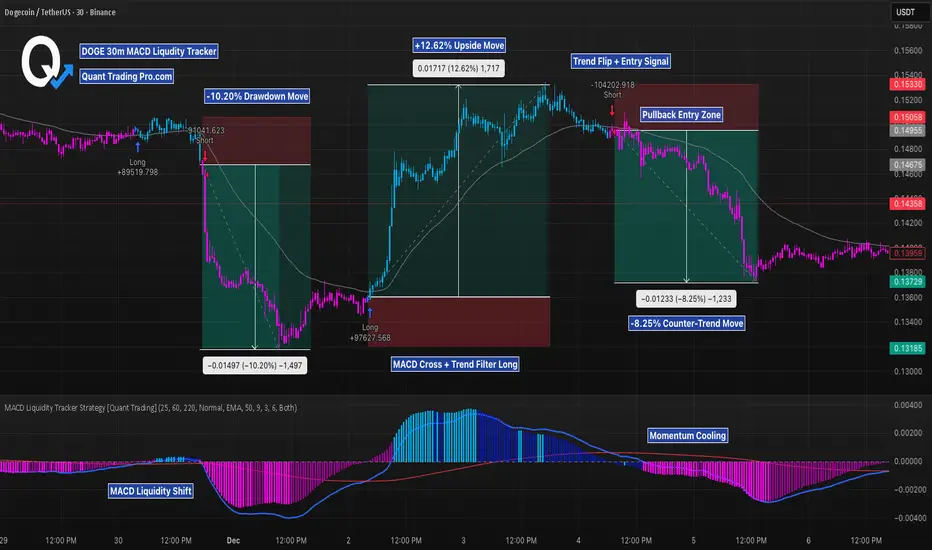
DOGE 30M – MACD Liquidity Tracker Trend Flip in ActionThis 30M chart shows how the MACD Liquidity Tracker Strategy behaves during clear trend rotations. The first shift came after a strong liquidity flip on MACD, followed by alignment with the EMA trend filters. That combination produced a clean long signal and a full trend rotation before momentum began to fade.
The second sequence shows the opposite: a pullback entry formed while momentum was already weakening, leading into a counter-trend move as EMAs rolled over and MACD histogram compressed. This contrast highlights how the strategy performs best when MACD expansion and trend filters sync, and becomes less reliable during momentum decay.
The settings used here were selected through automated backtesting, where multiple MACD lengths and EMA filters were tested to identify combinations that maintained trend clarity and avoided excess chop. The final set reflected the strongest balance between early momentum detection and false-signal reduction.
Backtested Settings:
MACD: 25 / 60 / 220
Signal: 9
EMA Filters: 50 & 100
Mode: Normal
Trend Filter: On
Entry Type: Long + Short enabled
Price is now consolidating under the EMAs while MACD momentum cools. A new trend signal requires a higher low and fresh MACD expansion; otherwise, short-term chop remains likely.
DOGEUSDT Analysis: Bearish Continuation with Potential ReversalDOGEUSDT 30-Minute Chart Analysis: Bearish Continuation with Potential Reversal Signals
DOGE/USDT pair on Binance in a 30-minute timeframe. It captures price action from December 6 to a projected view into December 9, focusing on recent volatility in Dogecoin (DOGE) against Tether (USDT). At the time of the snapshot, the price is quoted at 0.13936 USDT, down 0.0012 (or -0.9%) from the previous close, with a trading volume of 1.98 million units. The chart uses standard candlestick representation (red for bearish candles, green for bullish), overlaid with trendlines, support/resistance zones, and custom annotations to highlight potential trading setups.
The overall theme appears to be a bearish downtrend with signs of exhaustion, possibly setting up for a "fakeout" move followed by a reversal. I'll break this down in detail below, structured like a TradingView Idea post for clarity, including key sections for analysis, trade ideas, and insights.
Chart Overview
The chart spans multiple days (December 6 to 9), with the x-axis labeled in 6-hour intervals starting from 06:00 on December 6. The y-axis shows price levels in USDT, ranging from approximately 0.13650 at the bottom to 0.14250 at the top, with key levels marked like 0.13936 (ask price in red) and 0.13900 (bid in gray).
Candlestick Pattern: The left side shows a sharp downward impulse with a large red candle, indicating strong selling pressure, likely from a breakdown below a previous support. This is followed by a period of consolidation with smaller, choppy candles (mix of red and green), suggesting indecision. Toward the center-right, there's another cluster of red candles, pushing prices lower, but with diminishing volume implied by smaller wicks.
Trendline: A prominent descending trendline (sloping downward from left to right) connects multiple high points, acting as dynamic resistance. This line starts from the initial high around 0.14200 and trends lower, touching subsequent peaks.
Annotations and Zones:
"Retesting" Zone: A horizontal green box labeled "Retesting" is placed near the trendline around 0.14100–0.14200. This suggests the price is retesting the underside of the broken trendline or a former support level, a common setup in technical analysis where old support becomes new resistance.
"First Move Fake Then Reversal" Label: Positioned at the bottom left near a low point around 0.13800, this indicates a potential "fakeout" – a brief move in one direction (likely downward) to trap traders, followed by a reversal (potentially upward). A purple lightning bolt icon below emphasizes a high-impact event or turning point.
"PER NEED" Zone: A lower green box labeled "PER NEED" (possibly a typo or abbreviation for "Perfect Need" or "Per Need" in a trading context, like "perceived need" for liquidity) is drawn around 0.13750–0.13850. This could highlight a demand zone where buyers might step in, or a level of "need" for price to fill orders before reversing.
Projection Lines: Diagonal lines extend rightward from current price action into December 8–9, suggesting forecasted paths. One line points upward from a low, implying a bullish reversal, while the trendline continues downward.
The chart's title, "#DOGEUSDT 30 Mints Analysis" (likely "30 Mins" for minutes), hints at a short-term scalping or intraday focus, common for crypto pairs like DOGE/USDT, which are known for high volatility driven by social media hype, meme trends, and market sentiment.
Technical Analysis Breakdown
Diving deeper into the indicators and patterns:
Downtrend Confirmation: The series of lower highs and lower lows aligns with the descending trendline, confirming a bearish channel. The initial large red candle on December 6 (around 18:00) represents a breakdown, possibly triggered by broader market news or DOGE-specific events (e.g., Elon Musk tweets or crypto market dumps). Volume (1.98M) supports this, though not explicitly charted – higher volume on down moves strengthens the bearish bias.
Support and Resistance Levels:
Resistance: The trendline at ~0.14050–0.14150, where "Retesting" is occurring. A break above could invalidate the downtrend.
Support: Bottom levels around 0.13800 (near "First Move Fake Then Reversal") and 0.13700 ("PER NEED"). These are potential bounce zones, perhaps Fibonacci retracements or psychological round numbers.
Key Prices Marked: Ask at 0.13936 (red) and bid at 0.13900 (gray), showing tight spreads typical in liquid Binance pairs.
Potential Patterns:
Descending Wedge or Channel: The narrowing price action toward the right suggests a wedge formation, often bullish if it breaks upward. The "Retesting" label implies price is probing the upper boundary before a possible squeeze.
Fakeout Setup: The "First Move Fake Then Reversal" annotation points to a classic liquidity grab – price dips below support to stop out longs, then reverses. This is common in crypto, where whales manipulate thin order books.
Reversal Indicators: The small green candles at lows and the upward-projecting line suggest bullish divergence (if RSI were shown, it might confirm). The lightning bolt could symbolize a "shock" event like news catalyzing the reversal.
Timeframe Context: On a 30-min chart, this captures intraday swings, but aligns with DOGE's broader 2025 trends – assuming continued meme coin volatility amid potential regulatory news or adoption (e.g., Dogecoin payments on X platform).
Trade Idea: Bearish Continuation vs. Bullish Reversal
Based on the chart's annotations, here's a balanced trade setup:
Bearish Scenario (Continuation): If price fails the "Retesting" and breaks below 0.13800, target lower supports at 0.13650. Entry: Short below 0.13900. Stop Loss: Above trendline at 0.14100. Take Profit: 0.13700 or lower. Risk-Reward: 1:2. This plays the downtrend's momentum, with the fake move being a trap for bulls.
Bullish Scenario (Reversal): If the "First Move Fake Then Reversal" plays out, buy on a bounce from "PER NEED" zone (0.13750). Entry: Long above 0.13950. Stop Loss: Below 0.13700. Take Profit: Retest high at 0.14200 or higher. This anticipates the fakeout exhausting sellers, leading to a short squeeze.
Risk Management: Use 1-2% account risk per trade. Monitor volume for confirmation – fading volume on downs could signal reversal. Consider external factors like BTC correlation (DOGE often follows Bitcoin) or social sentiment on X.
Key Insights and Mindsets for Traders
To wrap up with practical "minds" (mindsets or key takeaways), inspired by TradingView community wisdom:
Mindset 1: Patience in Trends: Don't fight the descending trendline – wait for confirmation. As the chart shows, retests often precede big moves.
Mindset 2: Beware Fakeouts: The "First Move Fake" label reminds us crypto loves traps. Always use multiple timeframes (e.g., check 1H or 4H for alignment) to avoid getting shaken out.
Mindset 3: Zone Trading Over Exact Levels: Focus on boxes like "PER NEED" rather than pinpoint prices. These represent liquidity pools where smart money accumulates.
Mindset 4: Projection Caution: The forward lines into Dec 8-9 are speculative – use them as guides, not guarantees. Combine with fundamentals like DOGE's community-driven pumps.
This analysis assumes standard technical principles; always DYOR (Do Your Own Research) and consider market conditions on December 7, 2025. If you're posting this as a TradingView Idea, use hashtags like #DOGE #Crypto #TechnicalAnalysis for visibility!

DOGE — WEEK 49 TREND REPORTBINANCE:DOGEUSDT — WEEK 49 TREND REPORT
Ticker: BINANCE:DOGEUSDT — 12/03/2025 @ 0.15$
Timeframe: WEEKLY
This is a reactive structural classification of CRYPTOCAP:DOGE based on the weekly chart as of this timestamp. Price conditions are evaluated as they stand — nothing here is predictive or forward-assumptive.
⸻
1) Current Trend Condition
• Trend Duration: +7 weeks (Bearish)
• Trend Reversal Level (Bullish): .018$
• Trend Reversal Level (Bullish Confirmation): 0.20$
• Structural Support: 0.28$
⸻
2) Structure Health
• Retracement Phase:
Breakdown (establishing price beneath 38.2%)
• Position Status:
Unstable (price below both structural layers)
⸻
3) Temperature :
Cooling Phase
⸻
4) Momentum :
Bearish
⸻
Author’s Note
This analysis is fully reactive, not predictive. Market conditions, trend structure, and behavior are classified as they appear in real time. The objective is to identify where directional shifts first occurred, where structural integrity remains intact, and where it would begin to weaken if key levels were breached.
Predictive analysis projects outcomes that do not exist yet. Without price confirmation, prediction is built on baseless assumptions. This framework avoids that entirely by responding only to verified structural changes and live conditions.
The levels shown simply identify where the current trend structure first shifted and where it would begin to lose integrity if breached. Recognizing these boundaries allows for clearer interpretation of market behavior without relying on forward guarantees, speculative projections, or unsupported assumptions.
⸻
Methodology Overview
This classification framework evaluates directional conditions using internal trend-interpretation logic that references price behavior relative to its structural layers. These relationships are used to identify when price movement aligns with the framework’s criteria for directional phases, transition points, or regime shifts. Visual elements or structural labels reflect these internal interpretations, rather than explicit trading signals or preset indicator crossovers. This framework is observational only and does not imply future outcomes.

Dogeusdt BullishDogecoin bullish outloock, we can identify strong bullish entry at 0.3180 level. If price breaks this zone than bears target will be 0.24 zone but hope this doesn't happen.

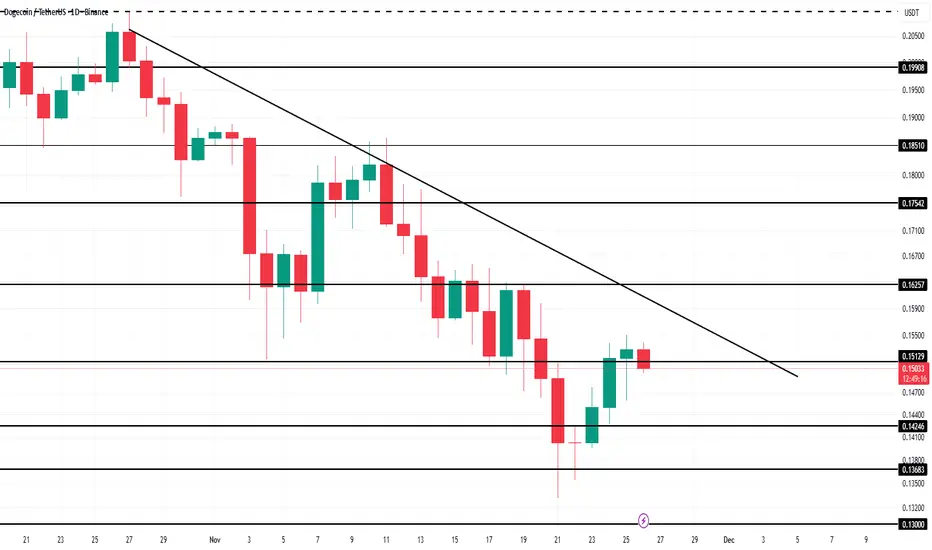
Did Dogecoin ETF Fail At Launch? Where Is Price Headed?Dogecoin is trading at $0.149, sitting just below the $0.151 resistance. The meme coin remains trapped under a persistent downtrend that has lasted nearly a month, with little evidence of a breakout forming.
Given the weak ETF inflows and bearish on-chain signals, breaking above this downtrend could be difficult. DOGE may continue oscillating under the trendline and could fall toward $0.142 if selling pressure increases.
If Dogecoin manages to attract fresh demand, however, the picture changes. A decisive breach of the downtrend could push the price above $0.162 and potentially toward $0.175. This would invalidating the bearish thesis and setting the stage for renewed momentum.
DOGE 4H – MACD Liquidity Tracker Trend SetupThis DOGE 4H chart showcases how the MACD Liquidity Tracker Strategy performs when aligned with the dominant trend, using the exact settings backtested inside Quant Trading Pro.
Backtested Settings (via QTP):
Fast MA: 25
Slow MA: 60
Signal MA: 220
System Type: Normal
Trend MA: EMA 50 (VIDYA Volatility Length 9)
With this configuration, the Trend MA (grey line) acts as the primary directional filter. Every short generated by the MACD Liquidity Tracker occurred directly beneath the Trend MA and the descending resistance, producing clean, trend-aligned setups.
Momentum confirmation through the MACD histogram and signal line allowed each position to scale efficiently into TP1 and TP2, with several moves extending deep into liquidity sweeps. This highlights the core advantage of the system: pairing a trend filter with momentum shifts dramatically increases trade accuracy.
Although DOGE is bouncing off recent lows, price remains below both the Trend MA and the descending resistance line. Until those levels break, any rally into this zone may simply set up the next continuation short using the same QTP-backed settings.
A breakout above the Trend MA would signal the first potential shift in trend strength — but as long as price stays under it, bearish setups remain favored.

DOGE/USDT - Momentum Shifts Toward the 0.105–0.093 Demand Zone?DOGE has entered one of its most decisive phases in recent months.
The chart shows the market has just lost one of its strongest technical pillars:
the primary ascending trendline that supported the entire multi-month rally.
Once that trendline broke, structure shifted from accumulation → distribution, and the momentum immediately favored the sellers.
DOGE attempted a recovery, but the retest into 0.183–0.208 was rejected aggressively, forming a classic failed bullish continuation pattern. This typically signals that market makers have chosen the lower liquidity zones as the next destination.
Price is now sitting around 0.151, caught between:
A freshly-confirmed resistance zone above, and
The major demand block at 0.105–0.093, one of the strongest historical accumulation zones on the chart.
This demand block is not random.
It is where high-volume positioning and historical liquidity clusters have repeatedly formed.
If DOGE drifts lower, this is where the next major battle will take place.
---
Key Pattern Highlights
1. Trendline Breakdown + Failed Retest
A textbook sign of a trend transition from bullish to bearish.
A failed retest often leads to a continuation selloff.
2. Consistent Lower Highs
A clear representation of seller dominance and weakening bullish momentum.
3. Deep Liquidity Wick
The long downward wick signals liquidity hunting — often occurring before price seeks a major support level.
4. Compression Toward Demand
Price structure is tightening downward, a typical sign of distribution.
---
Bullish Scenario
The bullish path is countertrend and requires strong confirmation.
Bullish structure only returns if:
1. DOGE closes above 0.183,
2. Reclaims 0.208 as support,
3. Retests the zone successfully without losing it again.
If these conditions are met, higher targets open:
0.260
0.290
0.395 (macro resistance zone)
Until then, every bounce remains a relief bounce, not a reversal.
---
Bearish Scenario
This remains the structurally dominant scenario:
1. Rejection around 0.160–0.170,
2. Breakdown below 0.148–0.140,
Opens the door toward the main target:
🎯 0.105 – 0.093 (major demand zone)
If this zone fails, DOGE may hunt liquidity as low as:
🔻 0.072 — a macro support level visible on the chart.
Because the gap between these zones is wide, downward continuation can accelerate quickly if sell volume increases.
---
> DOGE is trading below a trendline that once shaped its entire bullish structure.
The failed retest tells us the market still favors the downside.
Unless price reclaims 0.183–0.208, the primary scenario remains a continuation move toward the 0.105–0.093 demand zone — the key area that will determine whether DOGE prepares for a major rebound or extends its correction further.
---
#DOGE #Dogecoin #Crypto #TechnicalAnalysis
#PriceAction #CryptoCharts
#DemandZone #TrendlineBreak #AltcoinAnalysis
#SwingTrading #CryptoMarket

Doge, bullish divergence on daily.Price was rejected at the daily pivot per the last report’s analysis. The downtrend is intact.
Wave (2) appears complete after the Oct 10th flash crash, just above the ‘alt-coin’ golden pocket, 0.786 Fibonacci retracement. The trend remains down, so further downside is the higher probability. Price needs to overcome the heavy resistance ahead before we can talk about being bullish long-term.
📈 Daily RSI has printed bullish divergence
👉 Continued downside has a target of the 0.618 Fibonacci retracement and High Volume Node $0.12
Safe trading

DOGEUSDT is near weekly support and can pump +200% nowThe market has undergone a severe correctional phase, with declines exceeding 70% from previous highs—a movement that technically qualifies as a bear market cycle rather than a simple pullback. At these oversold levels, we may anticipate a potential technical rebound or relief rally. However, such upward movements should initially be viewed as corrective within the larger bearish structure unless key resistance levels are reclaimed with strong volume and sustained momentum.
Traders should monitor for signs of market stabilization and potential reversal patterns forming on higher timeframes, while remaining cautious of false breakouts or bear market rallies—often referred to as 'dead cat bounces'—that may temporarily lift prices before the primary downtrend resumes.
DISCLAIMER: ((trade based on your own decision))
<<press like👍 if you enjoy💚

DOGECOIN ( DOGE )Due to the influx of liquidity into the market. For two months. Also, entering the US stock market. ( ETF ).
The probability of the end of the downtrend is high.
Dogecoin is also suitable for volatility. If you are aware of the market.
But if you cannot fluctuate, then holding this coin can be suitable. (About 2 months).
Don't forget about capital management, please.

DOGE Analysis (1D)Dogecoin has entered the correction phase from the point we marked on the chart.
Based on the structure, an ABC pattern has been identified on the chart, and after wave C is completed, we expect retracement movements to the upside.
Wave C still needs more time to complete, and it is expected to finish between the two vertical time lines drawn on the chart.
Within the time lines and the green zone, one can consider buy/long positions.
As long as wave C has not finished, buying is not wise
For risk management, please don't forget stop loss and capital management
When we reach the first target, save some profit and then change the stop to entry
Comment if you have any questions
Thank You

DOGE - Update: CRYPTOCAP:DOGE - Update 🟥
Charts looks terrible & resistance aren't holding! 📉
Worst case —> Deeper correction toward the 0.0950 - 0.0900$ monthly levels.
Short term:
At the moment, the current price is sitting on a daily support: 0.1300 - 0.13500$, and we could see a consolidation phase before to see the next big move! 📈👀📉
I also noticed a possible Wedge (likely a bearish accumulation structure - under resistances).
Prices could follow this pattern before the next dump? 📉👀
Long term:
Bulls must push above 0.1800$ & red resistances area!
I personally have a long position on NASDAQ:STRK wich looks much better than such bearish outlook!
#NFA 🐕 #DOGE

DOGE Macro Triangle Compression → Breakout PotentialDOGEUSDT has been moving inside a massive multi-year symmetrical triangle since 2021. The current price is sitting exactly on the rising macro support line — a level that has held for several years.
🔍 Market Structure
Price is retesting the long-term rising support
Volume continues to contract → classic compression phase
DOGE is moving toward the apex of the macro triangle
Higher lows remain intact within the structure
📈 My Outlook / Scenario
Over the coming months, I expect DOGE to continue consolidating along the lower support area:
Oscillating inside the triangle
Building energy as volatility decreases
Gradually squeezing toward the apex
After this compression phase, a strong upside breakout becomes highly probable, similar to previous DOGE cycles where long accumulation phases led to sharp vertical moves.
If a breakout occurs with volume confirmation, DOGE could enter a fast impulsive rally.

DOGEUSDT Time And Price AnaysisAt least until the date specified in the chart, it will be negative.
The price will definitely reach the range of 0.24752-0.25606 and the price will see this range.
