DOGE Swing Long Idea - TRKZ ModelDOGE Swing Long Idea w TRKZ Model
📊 Market Sentiment
FED has resumed its rate-cutting cycle, starting with a 0.25% cut in September, with two more 0.25% cuts expected in the coming months. Additionally, institutional liquidity inflows have accelerated as the U.S. officially adopts crypto as part of its reserves. While inflation remains elevated, the weakening labor market is forcing the FED to ease, driving more capital into risk-on assets.
📈 Technical Analysis
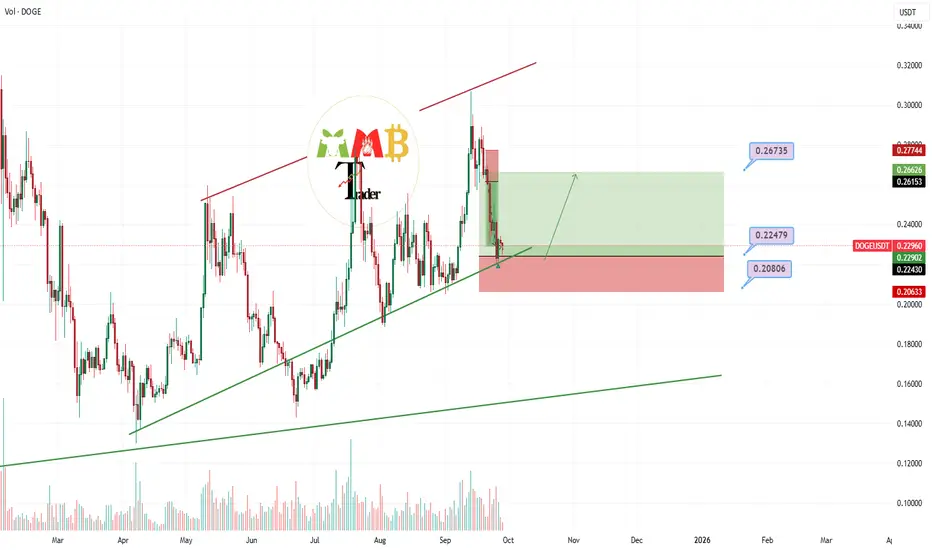
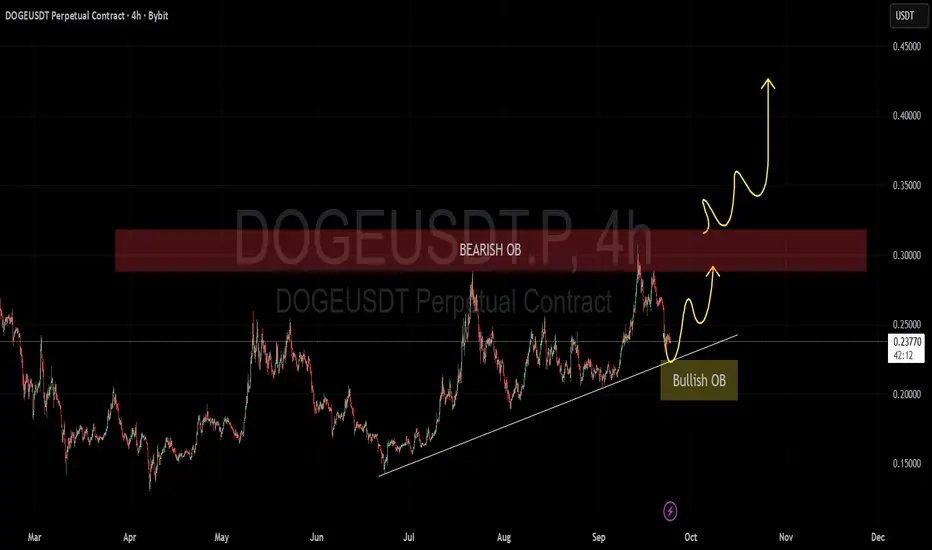
Price broke the bearish trendline that had been responsible for the bearish trend since December 2024 and closed above, indicating that price will seek higher levels.
Price also broke the HTF Key Level aggressively and closed above. I expect this level to hold and push us higher.
📘 Model to be used – Broken Trendline Retest supported by HTF Key Zone Retest (TRKZ)
In this model, we need to see a HTF trendline broken aggressively with a close above on HTF. Then, we check for a broken HTF Key Zone (Supply–Demand–Support–Resistance) aligned with the trendline break. Finally, we look to enter after the retest of both the broken trendline and the broken Key Zone.
📌 Game Plan
Carry the position toward the December 2024 high at 0.48$ as a mid–long term swing position. Trail the stoploss after taking first TP, move entry to breakeven, and manage forward.
🎯 Setup Trigger
Setup is valid after retesting the broken trendline and HTF Key Level.
📋 Trade Management
Stoploss: 0.18254$
Targets: TP1: 0.308$ | TP2: 0.4344$ | TP3: 0.4842$
Once TP1 is hit, stoploss will be moved to breakeven to secure profits.
💬 Like, follow, and comment if this breakdown supports your trading! More setups and market insights coming soon — stay connected!
⚠️ Disclaimer: This content is for informational and educational purposes only and does not constitute financial, investment, or trading advice. Always DYOR before making any financial decisions.
Trade ideas

DOGEUSDT 1D#DOGE is trading within a symmetrical triangle on the daily chart. Consider buying here and near the support zone ($0.22046 ~ $0.20927), which aligns with the daily SMA200. If a breakout occurs above the triangle resistance, the potential targets are:
🎯 $0.29810
🎯 $0.33781
🎯 $0.39434
🎯 $0.46635
⚠️ Always remember to use a tight stop-loss and maintain proper risk management.

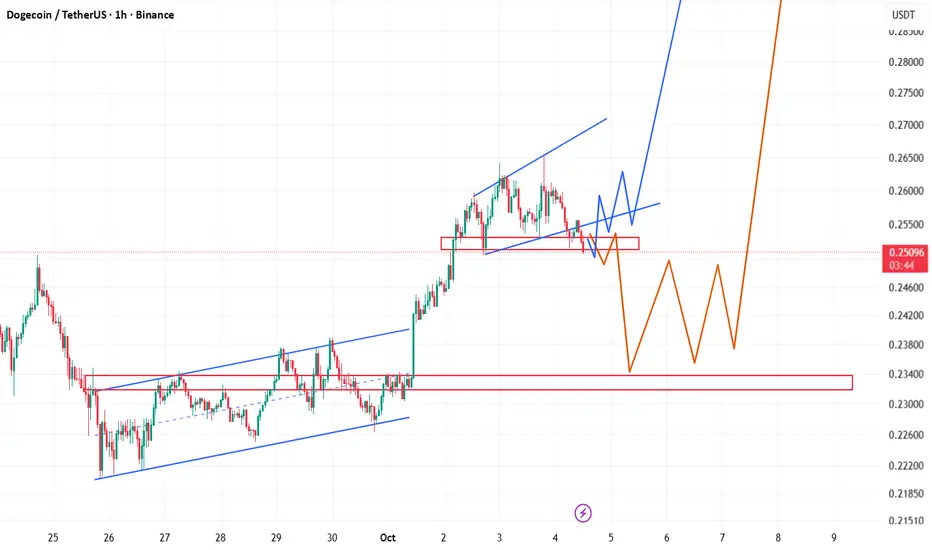
dogeusdtIts time to pump again.
maybe some range on 0.265 to 0.24 to fill gap then raise again to target.
I think its not last chance for buy but its ending.
wish lucky for all of us :)

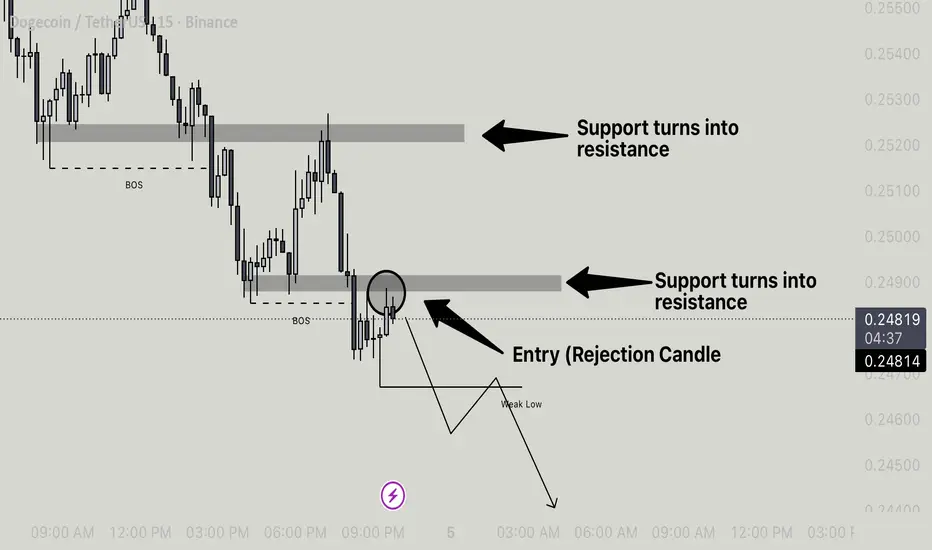
Doge/Usdt - Support Turned Resistance With BOS Bearish Setup 1. Support Turned Resistance (STR)
• The price initially had a support zone that later got broken.
• After the breakdown, that same zone is now acting as resistance (highlighted grey zones).
• This confirms a bearish shift in structure.
2. BOS (Break of Structure)
• The BOS mark shows that a previous low was broken, indicating bearish market intent.
• This is often used by traders to confirm continuation in the downward direction.
3. Rejection Candle (Entry Point)
• After the BOS, the price retraced back into the resistance zone (previous support).
• A rejection candle formed inside that zone, signaling sellers are defending it.
• This is the entry trigger for a short trade.
4. Weak Low & Target
• The chart suggests that the recent low is weak and likely to be taken out.
• The target is placed below that weak low, expecting continuation to the downside.
Trade Idea Summary
• Bias: Bearish
• Entry: On rejection candle at support-turned-resistance.
• Confirmation: BOS already occurred, validating bearish structure.
• Target: Below weak low (marked).
• Stop Loss: Should be placed slightly above the resistance zone (not shown but recommended).
This setup is a classic support-turned-resistance with BOS confirmation—a strong bearish continuation pattern.
DOGE Breakdown Could Trigger a Major Dump Yello, Paradisers! Have you noticed what just happened with DOGE? The recent price action is sending a clear warning that downside risk is increasing — and fast. Several technical signals are aligning, and ignoring them here could be costly.
💎DOGEUSDT has broken down from its ascending channel structure — a clear shift in trend. More importantly, we’re seeing bearish divergence on both MACD and RSI, confirming that momentum is weakening despite recent price attempts to push higher. When these signals appear together, it often precedes a sharp reversal.
💎Adding to the bearish bias, the price has just formed a double top pattern — and not just anywhere, but exactly at a previous support level that has now turned into resistance. This type of confluence makes the setup even more reliable for a potential move to the downside.
💎From the current levels, the risk-to-reward ratio is already attractive for short positions. However, considering the broader bullish tone of the overall crypto market, it may be wise to size positions conservatively here. Traders who prefer more confirmation might wait for a clean retest of the resistance zone, where a bearish candlestick pattern would provide a higher-conviction entry point.
💎If, however, price breaks back above the resistance zone and closes firmly above the invalidation level, the bearish setup becomes invalid. In that case, it's best to step aside and wait for fresh signals or clearer market structure before acting again.
🎖But it never is, and never will be a free ride. Make sure you play it smart, Paradisers; the next 6–9 months will be juicy for some and painful for others. Discipline, patience, robust strategies, and trading tactics are the only ways you can make it long-term in this market.
MyCryptoParadise
iFeel the success🌴

doge is bullish in high timeframesi think this is a low timeframe analyze that can show us how doge can move in the chart.
what do u think about it?
Dogecoin short back to $0.25124Dogecoin short back to $0.25124 before continuation back up . Seen more clearly on daily tf. Target is around daily tf fib 38.2. It's a corrective short
sl: 0.25913
1.91 RR

DOGE H2 - shortI think a pattern has formed on this chart and the price is going down. What do you think?

DOGEUSDT Forecast: Correction Near EndDogecoin has cycled through an aggressive expansion phase followed by distribution and a clear corrective sequence. The strong rally earlier in September reached exhaustion after buyers failed to sustain momentum, leading to a controlled decline. This retracement phase has pushed price back toward levels where market participants are reassessing risk and value.
Recent flows highlight reduced seller dominance, with price beginning to display characteristics of absorption. Market behavior suggests that liquidity is being tested, creating conditions where a potential recovery phase could emerge. Historical Dogecoin cycles often show this pattern: rapid expansions, corrective cooling, then renewed accumulation before the next impulse.

Dogecoin OUTLOOK Dogecoin Breaks 1hr resistance , that is a good Bullish signal to go long targeting daily order block
DOGE pump from cmp if holdsFirst DOGE ETF approved, if there are coins that profit off attention it’s memecoins - just liking the R/R in too many factors not to take the risk
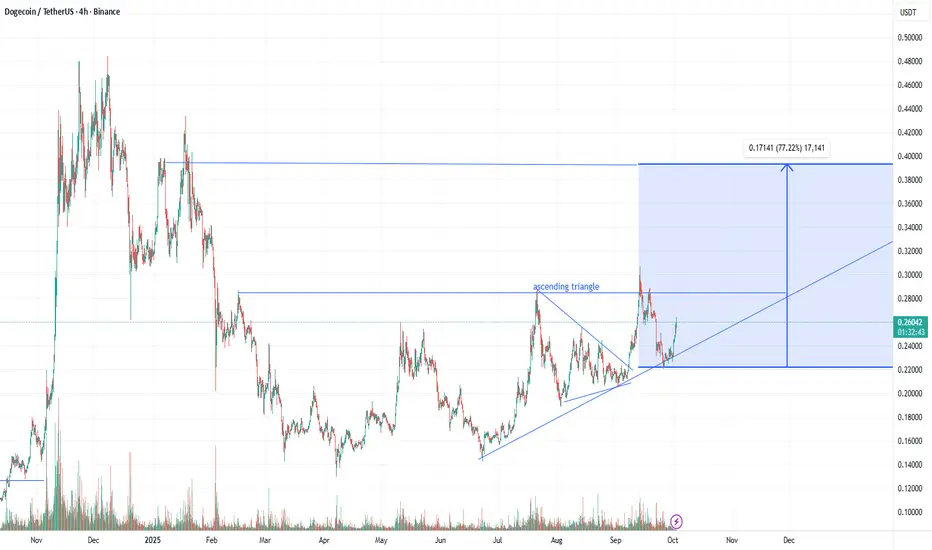
DOGE/USDT - Potential Ascending Triangle Breakout SetupDogecoin has been consolidating in a 9-month ascending triangle pattern and is approaching a critical breakout level.
The Setup:
📊 Pattern Formation: Clean ascending triangle forming since early 2025
Rising support shown by the blue ascending trendline - multiple higher lows
Horizontal resistance at approximately $0.28-$0.30 tested several times
Bottom support around $0.22 has held firm
Current price: $0.26, coiling near the apex of the triangle
🎯 Potential Target: $0.38-$0.40 zone (blue shaded area)
Measured move: Triangle height ($0.18) added to breakout point ($0.30)
Interestingly, this aligns with the previous resistance from earlier in 2025 around $0.40
What to Watch For Validation:
✅ Decisive Close Above $0.30
Need a strong daily candle close above $0.30 to confirm breakout
Not just a wick - a solid body close
✅ Volume Surge
Breakout must occur with significantly elevated volume
Compare to recent average volume - need at least 2-3x normal
✅ Retest Success
After breaking $0.30, watch for pullback to hold this level as new support
Failed retest = failed breakout
✅ Follow-Through
Price should push toward $0.35+ relatively quickly after confirmed breakout
Key Levels:
🔸 Resistance: $0.28-$0.30 (breakout level)
🔸 Support: $0.22 (triangle bottom) - break below invalidates pattern
🔸 Previous high: $0.40 (from chart history) - major resistance if we get there
Pattern Context:
Ascending triangles are bullish continuation patterns with approximately 70% success rate when volume confirms. However, we're near the apex, which means a move is likely coming soon - either up or down.
Invalidation:
Break below $0.22 support
Multiple rejections at $0.30 with declining volume
Extended consolidation without resolution
Triangle patterns must resolve. Watch for that decisive move above $0.30 with volume. Not financial advice - DYOR.
DOGEUSDTBINANCE:DOGEUSDT is bear-trend but come to key level for reaction. This level is back to base latest bull trend.
Supports: 0.22 - 0.20 - 0.19
Resistance's: 0.234 - 0.256 - 0.28 - 0.31
⚠️ Please control risk management.


Doge - long at POC 0.2264In a previus updated i gave u a signal to take long at VWAP
Price did 10% rise since that
at this moment i have new plan
Doge - long at POC 0.2264
Oi - already waped out
big chance to close the imbalance

DOGE to $1The move up to .48 late in 2024 is a 2.618 extension above the range from March 2024 (high) to August 2024 (low). A proportional move now from the December 2024 (high) to April 2025 range (low) gets us to $1... See you there.


DOGE/USDT Long Setup, Bounce From Trendline Support Toward 0.31DOGE is respecting a strong ascending trendline that has held since July. Price has recently tested this support zone around 0.23 and bounced higher, showing bullish momentum. As long as DOGE stays above 0.23, the bias remains positive.
The next key resistance lies near 0.27, with an extended target toward 0.30–0.31. This aligns with previous swing highs and Fibonacci levels.
📌 Entry: 0.238 – 0.245
🎯 Targets:
TP1: 0.270
TP2: 0.295
TP3: 0.310
🛑 Stop Loss: 0.220
Risk-to-reward ratio is favorable, with clear invalidation below trendline support. A daily close under 0.220 would invalidate the setup.

How Liquidation Data Protects you From Unexpected LossesHave you ever felt the market suddenly caught you off guard, wiping out your capital in an instant?
The Liquidation Data indicator can help manage the fear of liquidation and make smarter trading decisions easier.
Understanding collective market behavior and high-risk zones is key to reducing losses and increasing returns in futures trading.
Hello✌️
Spend 2 minutes ⏰ reading this educational material.
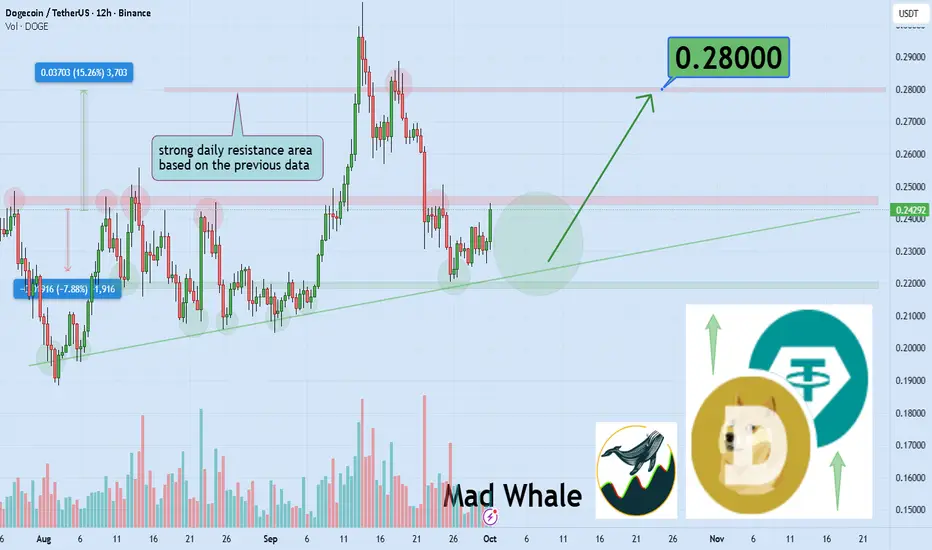
🎯 Analytical Insight on Dogecoin:
BINANCE:DOGEUSDT is testing a strong daily trendline and key support 📉; holding this level could fuel a 15% upside toward the next resistance near 0.28 🚀.
Now , let's dive into the educational section,
⚡ Market Psychology and Collective Fear
Fear of liquidation often leads traders into wrong positions.
Liquidation clusters act like traps, which whales exploit for profit.
Most losses occur in highly emotional areas of the market.
Collective fear often comes with short-term opportunities, but caution is essential.
Focusing on critical zones prevents FOMO and emotional decisions.
Understanding collective behavior is key to futures trading success.
Collective fear can create short-term golden opportunities.
Increasing trade volume in high-risk areas can lead to losses.
📊 Risk Management Strategies
Combining Liquidation Data with candlestick analysis identifies safer entry points.
Short timeframes are ideal for tracking rapid market movements.
ATR indicates market volatility and helps set appropriate Stop Loss.
VWAP shows average price and market direction.
Alerts notify you when the market reaches risky zones.
Checking multiple timeframes provides a comprehensive risk perspective.
Always have alternative scenarios for your trades.
Reducing trade size in liquidation clusters lowers overall risk.
🔍 Spotting Opportunities Amid Fear
If most traders are getting liquidated in one direction, a price reversal is likely.
Combining Liquidation Data with RSI and MACD can confirm safer entries.
Whale movements and liquidation volume protect you from major losses.
Learning to read Liquidation Data is a must-have skill for every trader.
Identifying high-risk zones improves decision-making and capital management.
Entering positions with over 70% liquidation is extremely risky.
Collective fear can offer short-term opportunities, if approached cautiously.
Focusing on real market data leads to smarter decisions.
🛠️ TradingView Tools and Features
Liquidation Data: Shows clusters of long and short positions at risk of liquidation.
Volume Profile: Analyzes buying and selling pressure and critical levels.
ATR: Measures market volatility for setting Stop Loss.
VWAP: Displays average price and market direction.
Alerts: Notifies when the market reaches high-risk levels.
Multiple Timeframes: Track both short-term movements and overall trends.
Combining these tools allows decisions based on multiple data points.
📝 Summary
Liquidation Data is an essential tool for reducing losses in futures trading.
Collective fear can be risky, but proper analysis can turn it into golden opportunities.
💡 3 Highly Practical Recommendations
Always check liquidation clusters before entering trades and avoid emotional entries.
Use a combination of analytical tools to find safer entry and exit points.
Prioritize risk management; adjust trade size and Stop Loss based on market behavior.
✨ Need a little love!
We pour love into every post your support keeps us inspired! 💛 Don’t be shy, we’d love to hear from you on comments. Big thanks , Mad Whale 🐋
📜Please make sure to do your own research before investing, and review the disclaimer provided at the end of each post.
DOGE/USDT: Bullish Jump to 0.3170? BINANCE:DOGEUSDT is gearing up for a bullish move on the 4-hour chart , with an entry zone between 0.2575-0.2637 near a key support and breakout level.
The target at 0.3170 aligns with the next resistance, offering strong upside potential. 📈 Set a stop loss on a close below 0.2420 to manage risk effectively. 🌟
A break above 0.2650 with solid volume could trigger this jump, driven by meme coin hype and market momentum. Watch BTC trends! Entry is good even right now with proper risk management. 💡
📝 Trade Plan:
✅ Entry Zone: 0.2575 – 0.2637 (support + breakout area)
❌ Stop Loss: Daily close below 0.2420 to manage risk
🎯 Target: 0.3170 (next resistance)

$DOGE Analysis🚨 CRYPTOCAP:DOGE Analysis 🚨
Watching for a sweep of sell-side liquidity first 👀
If price taps the POC level and shows a bullish setup, I’ll be looking for longs ✅
Local accumulation down here could set up a really clean play 🚀
DOGE the Buy signal soon will hit targetThe chart is clear and we are near major daily support zone + 0.5 Fibonacci support here all can pump the price easily to above 0.3$ once again and our target is definitely easy to hit if our support hold strong.
DISCLAIMER: ((trade based on your own decision))
<<press like👍 if you enjoy💚