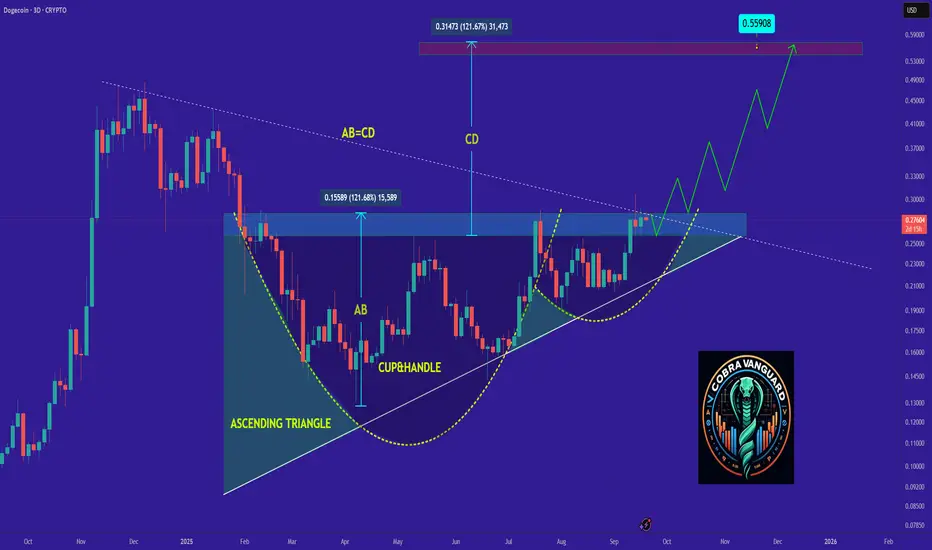
DOGE : This May Be Your Last Chance Before Exploding to Upside !As you can see, the price is forming two bullish patterns on the 3D timeframe, If my view is correct, DOGE will rise to 0.50 .
And if this pattern is correct and breaks, higher targets are possible.
Give me some energy !!
✨We spend hours finding potential opportunities and writing useful ideas, w
Key stats
Trading activity
Transactions 410
BuysSells
181229
Volume 59.88 KUSD
Buys volumeSells volume
24.76 K35.12 K
Traders 177
BuyersSellers
8691
About DOGEWBNB_3319A8.USD
Related DEX pairs
DOGE Explodes After Every BTC Milestone – Is 124,000 Next?History doesn’t just rhyme — it barks! Every time Bitcoin breaks a major psychological level (124 → 1,240 → 12,400), DOGE launches into a parabolic move shortly after. The pattern is clear: as BTC enters a new order of magnitude, DOGE follows with exponential gains — from fractions of a cent to over

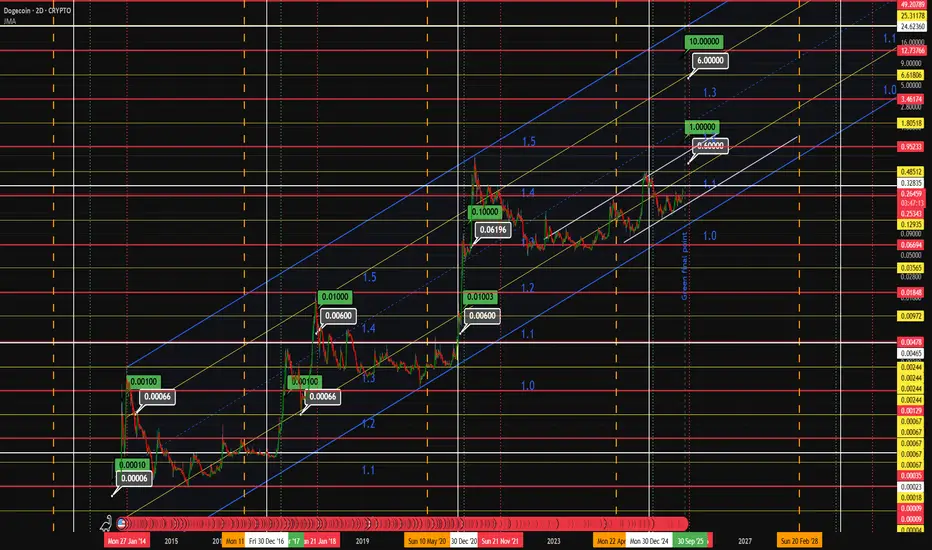
DOGE consistently touches 10 and 6 twice every cycle.Each bullish cycle shows a repeating pattern where price first spikes to $6, pulls back, then makes a second move to $10 — marking the cycle top. This repeating structure suggests a psychological and liquidity-driven resistance band between $6–$10, acting as a final rally zone before major correctio
dogecoin major wave loadingDogecoin 3rd wave incoming.
CRYPTOCAP:DOGE is more than just a meme, it's a movement.

DOGE LONG TERM is GONNA BE MASSIVEDiamond hand everyone. We buckle up soon.
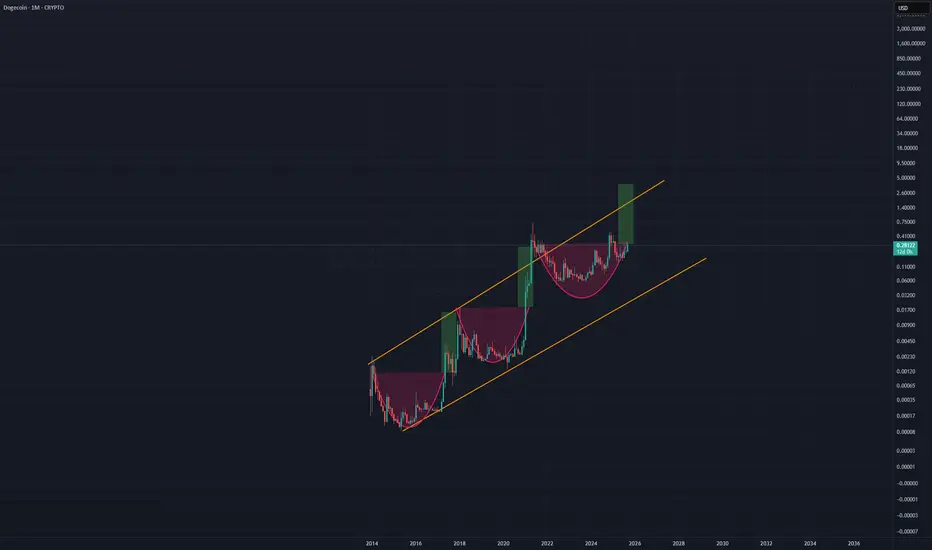
Doge in the monthly chart forming a cup pattern, and ready to blast soon.
Say it back $DOGE
Dogecoin, the pioneer of the super memecoin cycle, is entering its parabolic phase.

Is Dogecoin Ready for a Major Reversal? Key Zone Ahead!Dogecoin is approaching a major supply zone around 0.255 – 0.260 (highlighted in red). This area has acted as a strong resistance in the past, where sellers stepped in aggressively.
📊 On the 4H chart, price is currently sitting at 0.2440 and pushing upward. If price taps into this supply zone, we c

DOGE Short The BAT harmonic pattern signals a robust downward movement for DOGEUSD, beginning at 3 USD and targeting likely TP 1 and TP 2 .


DOGE rejected on its 6-month Resistance. What's next?Dogecoin (DOGEUSD) eventually made the bullish break-out we talked about on our last analysis above the top (Lower Highs trend-line) of the Triangle but got emphatically rejected on its 6-month Higher Highs trend-line.
That is the main Resistance holding since March 03. Last time it delivered a rej

See all ideas
Summarizing what the indicators are suggesting.
Oscillators
Neutral
SellBuy
Strong sellStrong buy
Strong sellSellNeutralBuyStrong buy
Oscillators
Neutral
SellBuy
Strong sellStrong buy
Strong sellSellNeutralBuyStrong buy
Summary
Neutral
SellBuy
Strong sellStrong buy
Strong sellSellNeutralBuyStrong buy
Summary
Neutral
SellBuy
Strong sellStrong buy
Strong sellSellNeutralBuyStrong buy
Summary
Neutral
SellBuy
Strong sellStrong buy
Strong sellSellNeutralBuyStrong buy
Moving Averages
Neutral
SellBuy
Strong sellStrong buy
Strong sellSellNeutralBuyStrong buy
Moving Averages
Neutral
SellBuy
Strong sellStrong buy
Strong sellSellNeutralBuyStrong buy
Curated watchlists where DOGEWBNB_3319A8.USD is featured.

Alt forks: The path less traveled. But still pretty profitable
12 No. of Symbols

Gen 1 crypto: from little acorns grow
15 No. of Symbols

Memecoins: Top meme tokens
10 No. of Symbols

Proof of Work: Embracing the crunch
27 No. of Symbols
See all sparks