$AMZN - bottom of the channel bounce hereAMZN - Stock bouncing off bottom of the channel. on high watch if move higher here we can see top of the channel at $250. Stock has all time highs at $242.52 area. could see that break soon post Rate cut.
AMZ trade ideas
Amazon Building Launch Pad - ABC Flat Appears as if this is forming a perfect ABC Flat correction, however tis market is so bull it may start next week from this price, if we can get some seasonal weakness in October hoping it fills the GAP. Leg into longs if it continues to decline.
But interestingly enough, what I have found in the past , is that the stock seems to be weak in the 4th quarter, which seems contrary to the fact that it does so much retail business in those months, and actually bulls hard in 1st quarter. So i think its worth watching to see what happens this time around.

Top Healthcare Stocks to Watch in Today’s Market🏥 Industry Overview: Healthcare in 2025
The healthcare sector has experienced a period of volatility in 2025, with the S&P 500 healthcare index rising just 4% since early 2023, compared to a 52% surge in the broader market. Factors contributing to this underperformance include policy uncertainties, regulatory challenges, and pricing pressures. Despite these headwinds, the sector remains resilient, driven by demographic trends such as an aging population, technological advancements, and increasing healthcare expenditures.
📈 Top Healthcare Stocks to Watch
1. Johnson & Johnson (NYSE: JNJ)
Johnson & Johnson continues to be a stalwart in the healthcare sector, with a diversified portfolio spanning pharmaceuticals, medical devices, and consumer health products. The company's robust pipeline and consistent dividend payouts make it a reliable choice for long-term investors.
2. Eli Lilly and Company (NYSE: LLY)
Eli Lilly has been at the forefront of innovation, particularly in the diabetes and oncology spaces. The company's recent advancements in weight-loss therapies have garnered significant attention, positioning it as a leader in metabolic health.
3. Merck & Co., Inc. (NYSE: MRK)
Merck's oncology drug, Keytruda, remains a cornerstone of its portfolio, with ongoing clinical trials expanding its therapeutic indications. The company's strategic partnerships and global reach enhance its growth prospects.
4. AbbVie Inc. (NYSE: ABBV)
AbbVie's acquisition of Allergan has bolstered its presence in the aesthetics and eye care markets. The company's strong pipeline, particularly in immunology and neuroscience, provides a solid foundation for future growth.
5. Amgen Inc. (NASDAQ: AMGN)
Amgen's leadership in biologics and biosimilars positions it well in the evolving pharmaceutical landscape. The company's focus on cardiovascular and oncology therapies aligns with current healthcare priorities.
6. AstraZeneca plc (NYSE: AZN)
AstraZeneca's commitment to oncology and respiratory treatments has driven its recent growth. Strategic acquisitions and a strong R&D pipeline support its long-term prospects.
7. Novartis AG (NYSE: NVS)
Novartis continues to innovate in gene therapies and ophthalmology. The company's focus on high-value treatments and strategic divestitures streamline its operations, enhancing shareholder value.
8. Sanofi (NYSE: SNY)
Sanofi's emphasis on immunology and rare diseases has strengthened its market position. Collaborations and acquisitions in the biotech space expand its therapeutic reach.
9. Vertex Pharmaceuticals (NASDAQ: VRTX)
Vertex's leadership in cystic fibrosis treatments has been complemented by its expansion into gene editing technologies. The company's innovative approach positions it as a key player in precision medicine.
10. Intuitive Surgical (NASDAQ: ISRG)
Intuitive Surgical remains a pioneer in robotic-assisted surgery. The company's expanding global footprint and continuous technological advancements sustain its competitive edge.
🔍 Emerging Opportunities
Obesity Treatment Market
The global obesity epidemic has spurred demand for effective treatments. Companies like Novo Nordisk and Eli Lilly are capitalizing on this trend with their weight-loss therapies. In India, Fortis Healthcare plans to expand its network of obesity clinics, reflecting the growing importance of metabolic health in emerging markets.
Biotech Innovations
Biotechnology firms are making significant strides in gene therapies and personalized medicine. Companies like Vertex Pharmaceuticals and Scholar Rock are at the forefront of these innovations, offering potential breakthroughs in treating genetic disorders.
📊 Market Trends and Considerations
Regulatory Landscape: Policy changes, such as drug pricing reforms and reimbursement adjustments, can impact profitability.
Technological Advancements: The integration of AI and robotics in healthcare delivery enhances efficiency and patient outcomes.
Global Health Initiatives: International collaborations and funding for global health challenges present growth opportunities.
💡 Investment Strategies
Diversification: Investing across various subsectors—pharmaceuticals, medical devices, biotechnology—mitigates sector-specific risks.
Long-Term Horizon: Focusing on companies with strong pipelines and robust financials ensures resilience against market fluctuations.
Thematic Investing: Targeting trends like aging populations, digital health, and personalized medicine aligns investments with macroeconomic shifts.
🧾 Conclusion
The healthcare sector in 2025 offers a plethora of investment opportunities, driven by innovation, demographic trends, and evolving market dynamics. By focusing on companies with strong fundamentals, strategic initiatives, and alignment with global health trends, investors can position themselves for long-term success in this vital industry.

AMZN ShortMini-coil breakdown after a long choppy uptrend.
Long term trend broken and previous high failed to clear as well

Amazon Wave Analysis – 23 September 2025
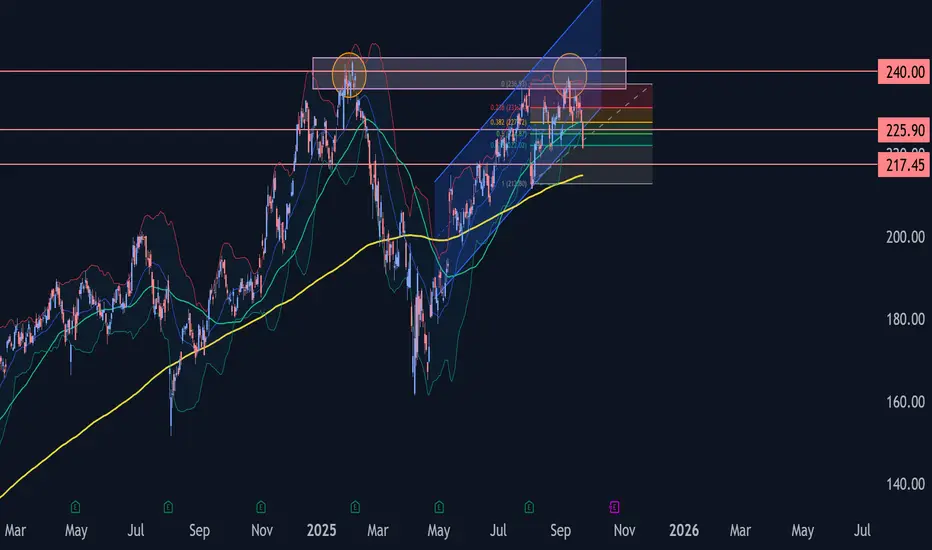
- Amazon broke support zone
- Likely to fall to support level 217.45
Amazon recently broke the support zone between the support level 225.90 (low of the earlier impulse wave i), support trendline of the daily up channel from April and the 50% Fibonacci correction of the upward impulse C from the start of August.
The breakout of this support zone continues the active impulse wave 3 which belongs to the intermediate downward impulse sequence (C) from September.
Amazon can be expected to fall to the next support level 217.45 (target price for the completion of the active impulse wave 3).
AMZN Shorts are Losing GripHello I am the Cafe Trader.
Today we’re looking at Amazon
If you have followed my last couple Idea's on AMZN, we have really pegged down where these players are in the market.
This month I wanted to highlight the bullish sentiment with AMZN.
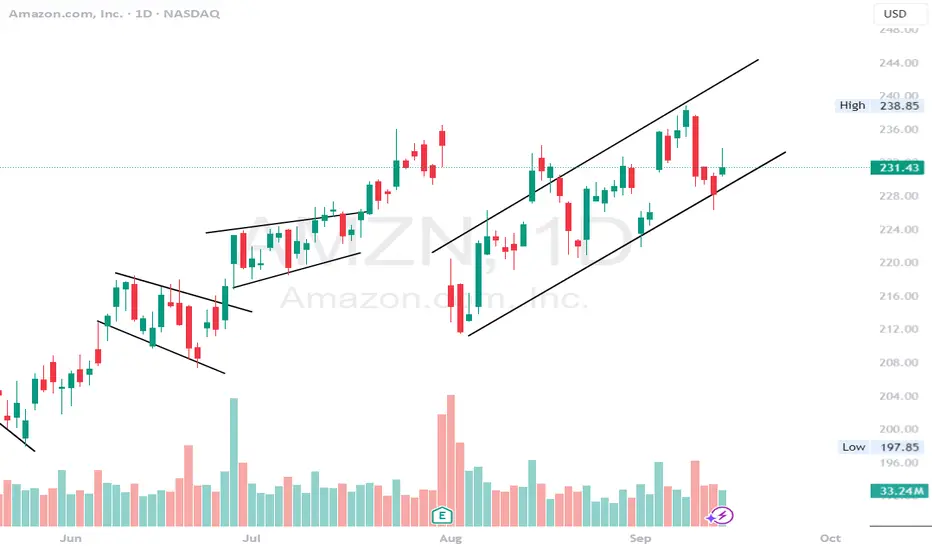
This chart shows us something important — shorts are losing grip. Every time they’ve tried to step in, the moves have been getting weaker and weaker. From the sharp -10% drop in early August, to the most recent -1.7% retracement, sellers are showing less conviction. Adding to this, there is a new Aggressor, a new buyer on the market looking to defend their position. This is putting a lot of pressure on the Strong supply, which is a key seller, and really the last one.
Green Scenario
If AMZN can push through this Strong Supply zone (around 235–240) and hold, then we open the door to a breakout higher. A close above the Strong Supply by the end of the week would really signal the beginning of shorts covering, and an extension toward the 250 area and beyond.
NOTE
If sellers manage to hold the line here one more time, I expect a dip back into the New Aggressor demand zone around 227–230. If these new buyers fail, we may be in for months of bear territory for AMZN.
Watch out for ATH's!
Follow and Boost, comment on some stocks you would like to see forecasted.
Happy Trading,
@thecafetrader

History of International Trade & Finance1. Early Civilizations and Barter Trade
1.1 The Origins of Trade
Trade began as simple bartering—exchanging one good for another. Ancient tribes swapped food, tools, and raw materials. Over time, trade networks extended across rivers, deserts, and seas.
Mesopotamia (3500 BCE onwards): Known as the “cradle of civilization,” Mesopotamians traded grain, textiles, and metals. Cuneiform tablets recorded trade contracts.
Indus Valley Civilization (2500 BCE): Had advanced trade with Mesopotamia; seals found in Mesopotamia prove this.
Ancient Egypt: Exchanged gold, papyrus, and grain with neighboring kingdoms.
China: Silk production started around 2700 BCE, later leading to the legendary Silk Road.
1.2 Rise of Currency
Barter had limitations—value mismatch and lack of divisibility. To solve this, money emerged:
Commodity money like salt, shells, and cattle.
Metallic coins (Lydia in 7th century BCE) became a global standard.
Precious metals like gold and silver gained universal acceptance, laying the foundation for finance.
2. Classical Empires and Trade Routes
2.1 The Silk Road
The Silk Road (200 BCE – 1400 CE) was the greatest ancient trade route, linking China, India, Persia, and Rome. It carried silk, spices, glassware, and ideas. More than goods, it spread culture, religion, and technology.
2.2 Roman Trade Networks
Rome imported grain from Egypt, spices from India, and silk from China. Roman finance developed banking houses, credit, and promissory notes. Roman coins (denarii) were used across Europe and Asia.
2.3 Indian Ocean Trade
Arab merchants dominated sea routes. Dhows carried spices, ivory, and textiles. The monsoon winds made seasonal navigation predictable. Indian and Chinese merchants thrived here, creating one of the earliest examples of global maritime trade finance.
3. The Middle Ages and Islamic Finance
3.1 European Trade Revival
After the fall of Rome, Europe faced decline. But by the 11th century, trade revived:
Medieval fairs in France became major trade hubs.
Italian city-states (Venice, Genoa, Florence) dominated Mediterranean trade.
3.2 The Rise of Islamic Finance
Islamic empires (7th – 13th centuries) expanded trade from Spain to India. Key contributions:
Bills of exchange (suftaja) allowed merchants to travel without carrying gold.
Hawala system enabled money transfers through trust networks, avoiding risks of theft.
Introduction of credit instruments helped finance caravans and voyages.
4. The Age of Exploration (15th – 17th Century)
4.1 Maritime Expansion
European powers—Portugal, Spain, later Britain and the Netherlands—launched voyages for spices, silk, and gold.
Vasco da Gama reached India (1498).
Columbus discovered the Americas (1492).
Magellan circumnavigated the globe (1519–22).
4.2 Mercantilism and Colonial Trade
The mercantilist system dominated: nations sought to maximize exports, minimize imports, and accumulate gold. Colonies became suppliers of raw materials and consumers of finished goods.
4.3 Birth of Modern Finance
To finance risky voyages, new institutions emerged:
Joint-stock companies (e.g., Dutch East India Company, British East India Company).
Amsterdam Stock Exchange (1602) – world’s first modern stock market.
Insurance (Lloyd’s of London) protected ships and cargo.
This era established the deep link between trade, finance, and empire-building.
5. The Industrial Revolution (18th – 19th Century)
5.1 Transformation of Trade
The Industrial Revolution (1760–1840) changed everything:
Steam engines, textile machines, and iron production boosted manufacturing.
Mass production required raw materials (cotton, coal, iron ore) and expanded markets.
Global trade networks intensified.
5.2 Finance in the Industrial Age
The gold standard emerged, fixing currencies to gold reserves.
Banks expanded credit to industries.
London became the financial capital of the world.
Railroads and steamships were financed through international capital markets.
5.3 Colonial Exploitation
European empires extracted resources from colonies—India, Africa, Southeast Asia. The colonial economy was designed to feed Europe’s industrial growth, shaping global trade imbalances that persist even today.
6. Early 20th Century: Globalization and Crises
6.1 Pre–World War I Globalization
By 1900, global trade was booming:
Free trade policies spread.
Telegraphs and steamships made commerce faster.
Capital flowed across borders, mainly from Britain and France to colonies.
6.2 The Great Depression (1929–39)
The Wall Street Crash led to worldwide financial collapse:
Global trade shrank by two-thirds.
Countries imposed tariffs (e.g., Smoot-Hawley Act in the U.S.).
Protectionism deepened the crisis.
6.3 World Wars and Finance
Both World Wars disrupted trade but also advanced technology. Finance shifted towards war bonds, government borrowing, and central bank intervention. The U.S. emerged as a financial superpower after WWII.
7. The Bretton Woods System (1944 – 1971)
7.1 Establishing New Institutions
In 1944, world leaders met at Bretton Woods (USA) to design a new economic order. Key outcomes:
Creation of IMF (International Monetary Fund) to stabilize currencies.
Creation of World Bank for reconstruction and development.
U.S. dollar linked to gold ($35 per ounce), other currencies pegged to the dollar.
7.2 Expansion of Global Trade
GATT (General Agreement on Tariffs and Trade, 1947) reduced tariffs.
Europe rebuilt under the Marshall Plan.
Japan and Germany emerged as industrial powers again.
8. Collapse of Bretton Woods & Rise of Global Finance (1971 onwards)
8.1 Nixon Shocks and Floating Exchange Rates
In 1971, U.S. President Richard Nixon ended dollar-gold convertibility. Result:
Shift to floating exchange rates.
Rise of foreign exchange markets (Forex).
8.2 Oil Shocks and Petrodollar System
The 1973 oil crisis reshaped global finance. Oil was priced in dollars, reinforcing U.S. dominance. Oil-rich nations invested surplus revenues into Western banks—known as petrodollar recycling.
8.3 Financial Deregulation (1980s–90s)
Margaret Thatcher and Ronald Reagan promoted free markets.
Liberalization allowed capital to flow freely.
Growth of multinational corporations (MNCs).
Stock markets, derivatives, and hedge funds expanded dramatically.1. Early Civilizations and Barter Trade
1.1 The Origins of Trade
Trade began as simple bartering—exchanging one good for another. Ancient tribes swapped food, tools, and raw materials. Over time, trade networks extended across rivers, deserts, and seas.
Mesopotamia (3500 BCE onwards): Known as the “cradle of civilization,” Mesopotamians traded grain, textiles, and metals. Cuneiform tablets recorded trade contracts.
Indus Valley Civilization (2500 BCE): Had advanced trade with Mesopotamia; seals found in Mesopotamia prove this.
Ancient Egypt: Exchanged gold, papyrus, and grain with neighboring kingdoms.
China: Silk production started around 2700 BCE, later leading to the legendary Silk Road.
1.2 Rise of Currency
Barter had limitations—value mismatch and lack of divisibility. To solve this, money emerged:
Commodity money like salt, shells, and cattle.
Metallic coins (Lydia in 7th century BCE) became a global standard.
Precious metals like gold and silver gained universal acceptance, laying the foundation for finance.
2. Classical Empires and Trade Routes
2.1 The Silk Road
The Silk Road (200 BCE – 1400 CE) was the greatest ancient trade route, linking China, India, Persia, and Rome. It carried silk, spices, glassware, and ideas. More than goods, it spread culture, religion, and technology.
2.2 Roman Trade Networks
Rome imported grain from Egypt, spices from India, and silk from China. Roman finance developed banking houses, credit, and promissory notes. Roman coins (denarii) were used across Europe and Asia.
2.3 Indian Ocean Trade
Arab merchants dominated sea routes. Dhows carried spices, ivory, and textiles. The monsoon winds made seasonal navigation predictable. Indian and Chinese merchants thrived here, creating one of the earliest examples of global maritime trade finance.
3. The Middle Ages and Islamic Finance
3.1 European Trade Revival
After the fall of Rome, Europe faced decline. But by the 11th century, trade revived:
Medieval fairs in France became major trade hubs.
Italian city-states (Venice, Genoa, Florence) dominated Mediterranean trade.
3.2 The Rise of Islamic Finance
Islamic empires (7th – 13th centuries) expanded trade from Spain to India. Key contributions:
Bills of exchange (suftaja) allowed merchants to travel without carrying gold.
Hawala system enabled money transfers through trust networks, avoiding risks of theft.
Introduction of credit instruments helped finance caravans and voyages.
4. The Age of Exploration (15th – 17th Century)
4.1 Maritime Expansion
European powers—Portugal, Spain, later Britain and the Netherlands—launched voyages for spices, silk, and gold.
Vasco da Gama reached India (1498).
Columbus discovered the Americas (1492).
Magellan circumnavigated the globe (1519–22).
4.2 Mercantilism and Colonial Trade
The mercantilist system dominated: nations sought to maximize exports, minimize imports, and accumulate gold. Colonies became suppliers of raw materials and consumers of finished goods.
4.3 Birth of Modern Finance
To finance risky voyages, new institutions emerged:
Joint-stock companies (e.g., Dutch East India Company, British East India Company).
Amsterdam Stock Exchange (1602) – world’s first modern stock market.
Insurance (Lloyd’s of London) protected ships and cargo.
This era established the deep link between trade, finance, and empire-building.
5. The Industrial Revolution (18th – 19th Century)
5.1 Transformation of Trade
The Industrial Revolution (1760–1840) changed everything:
Steam engines, textile machines, and iron production boosted manufacturing.
Mass production required raw materials (cotton, coal, iron ore) and expanded markets.
Global trade networks intensified.
5.2 Finance in the Industrial Age
The gold standard emerged, fixing currencies to gold reserves.
Banks expanded credit to industries.
London became the financial capital of the world.
Railroads and steamships were financed through international capital markets.
5.3 Colonial Exploitation
European empires extracted resources from colonies—India, Africa, Southeast Asia. The colonial economy was designed to feed Europe’s industrial growth, shaping global trade imbalances that persist even today.
6. Early 20th Century: Globalization and Crises
6.1 Pre–World War I Globalization
By 1900, global trade was booming:
Free trade policies spread.
Telegraphs and steamships made commerce faster.
Capital flowed across borders, mainly from Britain and France to colonies.
6.2 The Great Depression (1929–39)
The Wall Street Crash led to worldwide financial collapse:
Global trade shrank by two-thirds.
Countries imposed tariffs (e.g., Smoot-Hawley Act in the U.S.).
Protectionism deepened the crisis.
6.3 World Wars and Finance
Both World Wars disrupted trade but also advanced technology. Finance shifted towards war bonds, government borrowing, and central bank intervention. The U.S. emerged as a financial superpower after WWII.
7. The Bretton Woods System (1944 – 1971)
7.1 Establishing New Institutions
In 1944, world leaders met at Bretton Woods (USA) to design a new economic order. Key outcomes:
Creation of IMF (International Monetary Fund) to stabilize currencies.
Creation of World Bank for reconstruction and development.
U.S. dollar linked to gold ($35 per ounce), other currencies pegged to the dollar.
7.2 Expansion of Global Trade
GATT (General Agreement on Tariffs and Trade, 1947) reduced tariffs.
Europe rebuilt under the Marshall Plan.
Japan and Germany emerged as industrial powers again.
8. Collapse of Bretton Woods & Rise of Global Finance (1971 onwards)
8.1 Nixon Shocks and Floating Exchange Rates
In 1971, U.S. President Richard Nixon ended dollar-gold convertibility. Result:
Shift to floating exchange rates.
Rise of foreign exchange markets (Forex).
8.2 Oil Shocks and Petrodollar System
The 1973 oil crisis reshaped global finance. Oil was priced in dollars, reinforcing U.S. dominance. Oil-rich nations invested surplus revenues into Western banks—known as petrodollar recycling.
8.3 Financial Deregulation (1980s–90s)
Margaret Thatcher and Ronald Reagan promoted free markets.
Liberalization allowed capital to flow freely.
Growth of multinational corporations (MNCs).
Stock markets, derivatives, and hedge funds expanded dramatically.
9. Globalization Era (1990s – 2008)
9.1 WTO and Free Trade
In 1995, the World Trade Organization (WTO) replaced GATT, enforcing trade rules. Globalization accelerated:
Outsourcing and offshoring.
China became “the world’s factory.”
NAFTA and EU expanded regional trade blocs.
9.2 Rise of Emerging Markets
India, Brazil, Russia, and China (BRIC nations) became major players. Foreign direct investment (FDI) surged.
9.3 Asian Financial Crisis (1997–98)
Currency collapses in Thailand, Indonesia, and South Korea exposed risks of free capital flows. IMF bailouts highlighted tensions between sovereignty and global finance.
10. The 2008 Global Financial Crisis
The collapse of Lehman Brothers triggered the worst financial crisis since the Great Depression. Causes:
Excessive lending, subprime mortgages.
Complex derivatives (CDOs, credit default swaps).
Weak regulation.
Impact:
World trade contracted sharply.
Governments rescued banks with bailouts.
Central banks adopted quantitative easing (QE)—printing money to stabilize economies.
11. The 21st Century: Digital Trade and Fintech
11.1 Rise of Digital Economy
E-commerce giants (Amazon, Alibaba) revolutionized trade.
Services trade (IT outsourcing, digital platforms) grew faster than goods trade.
Data became a new form of currency.
11.2 Fintech and Cryptocurrencies
Mobile payments (PayPal, UPI, Alipay) expanded financial inclusion.
Blockchain and Bitcoin challenged traditional banking.
Central banks began exploring CBDCs (Central Bank Digital Currencies).
11.3 China vs. U.S. Rivalry
China’s Belt and Road Initiative (BRI) reshaped global trade finance. The U.S.-China trade war (2018 onwards) revealed deep tensions in globalization.
12. COVID-19 Pandemic and Supply Chain Shocks
The 2020 pandemic disrupted global trade:
Supply chains collapsed.
Oil prices turned negative temporarily.
Governments injected trillions into economies.
Digital trade accelerated massively.
The crisis highlighted the risks of overdependence on global supply chains.
13. Future of International Trade & Finance
13.1 Green Trade and Sustainable Finance
Climate change is shaping global trade policies:
Carbon taxes on imports.
Green finance for renewable projects.
13.2 Multipolar Trade World
India, ASEAN, and Africa rising as key players.
Decline of Western dominance.
13.3 AI, Automation & Decentralized Finance (DeFi)
Artificial intelligence is transforming logistics, stock markets, and risk management. Blockchain-based DeFi could replace traditional banking intermediaries.
Conclusion
The history of international trade and finance is a story of innovation, expansion, crisis, and adaptation. From Mesopotamian barter to today’s AI-driven digital finance, humans have constantly sought ways to connect across borders.
Key lessons:
Trade thrives on trust, finance, and institutions.
Every era of expansion faces crises that reshape the system.
The future will be defined by sustainability, digital innovation, and geopolitical shifts.
In essence, trade and finance are not just economic activities—they are engines of civilization, shaping politics, culture, and human destiny.
AMZN Ascending Triangle + Inverse Head and ShouldersAmazon has been bouncing off the trendline several times in the last couple weeks. It's formed an inverse head and shoulders last couple months and the last couple weeks has formed an ascending triangle. 235-245 area has had a bit of resistance last couple months, and AMZN recently rejected off the 240 this week. There is a potential for a double top, but with the right volume and momentum it can break through it just like Google did not too long ago (had a similar setup). Rate Cuts could be coming soon, and there was some put (bearish) flow on SPY and QQQ so there is a possibility for another looming rejection for amazon. However, I'm leaning bullish long as there's been strong Amazon Call flow, and its due for its breakout with the rest of the mag7s. The patterns are bullish, EMA's bullish, market sentiment overall could be bullish, options flow is bullish, AMZN has potential... nfa.

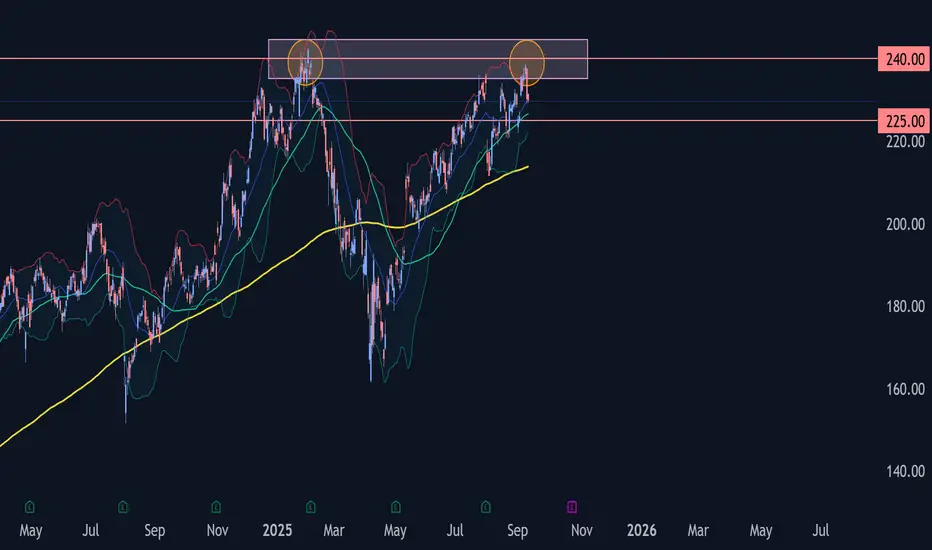
Amazon Wave Analysis – 11 September 2025- Amazon reversed from the resistance area
- Likely to fall to support level 225.00
Amazon recently reversed from the resistance area between the strong resistance level 240.00 (which stopped the sharp uptrend at the start of 2025) and the upper daily Bollinger Band.
The downward reversal from support level 240.00 stopped the previous extended ABC correction (2) from the start of April.
Given the strength of the resistance level 240.00, Amazon can be expected to fall to the next support level 225.00.
I am buying AMAZONI am buying AMAZON
Amazon's stock lost over 10% last week, marking a significant decline within just one week.
I will start buying using dollar cost averaging (DCA) with $240 as my long-term to mid-term target.
I will hold
Please like, share, comment and follow.
I look forward to connecting with you

How to recognize the Fundamentals Support in a stock chart.Candlesticks are more than just a buy entry signal or a sell short entry signal. Candlesticks offer far more information such as where are the fundamentals of a company in relation to its stock price? The chart of AMZN shows the current level of fundamentals at this time which is within the outlined price level. AMZN is an excellent example of a company that is prospering during a time of rising tariffs and trade wars.
AMZN chart also show Buy Side "Support the Market" activity and quiet accumulation for much of this year. The steady rise of Accum/Dist is a pattern in the indicator that represents quiet accumulation over time.
Reminder: When Dark Pools are in accumulation mode they do not move price in huge price action. The candles will be small, uniform, and periodic. TWAP orders, Time Weighted at Average Price are used to set an automatic ping to buy when a stock falls below the fundamental level of a sideways trend. Fundamentals are always sideways trends.
If the stock moves beyond the high price set for the TWAP order, then the accumulation buying ping halts and waits.
Therefore, you can see the area where the majority of Dark Pool TWAP orders are buying and when the orders pause.
This is very useful information as Professional Independent Traders are monitoring the Dark Pool Buy Zone and will buy with the Dark Pools in anticipation that the liquidity draw is going to drive price upward suddenly as HFTs AI suddenly find the liquidity draw which occurs slowly over time, often several months.

Next week to $230 or $235. Long Term it wants $200 again...Gex levels as seen in my chart show that we are very over sold to the down side (UNLESS GEX LEVELS COMPLETLY CHANGE) we will see $230-$235 by end of this month.
The entire tech market and equities are a buy the dip and sell the rip before September.
Buy calls and sell at $230 & $235, boom money made.

AMZN 2Hour Time frameAMZN 2-Hour Snapshot
Current Price: $238.24 USD
Change: +1.02% from the previous close
Intraday High: Not available
Intraday Low: Not available
🔎 Technical Indicators
Relative Strength Index (RSI): Neutral
Moving Averages:
5-period MA: Not available
10-period MA: Not available
20-period MA: Not available
50-period MA: Not available
📈 Market Sentiment
Pivot Points:
Resistance: Not available
Support: Not available
📅 Outlook
Bullish Scenario: A breakout above the current price could lead to further gains.
Bearish Scenario: A drop below the current price may test support levels.
Overall Bias: Neutral, with mixed signals from moving averages and momentum indicators.

AMZN 45Minutes Time frameAMZN 45-Minute Snapshot
Current Price: $238.24 USD
Change: +1.02% from the previous close
Intraday Range: $235.08 – $238.85 USD
52-Week Range: $161.38 – $242.52 USD
🔎 Technical Indicators
RSI (14): 67.1 — Neutral to slightly overbought
MACD: 1.88 — Bullish momentum
Moving Averages:
5-period SMA: $237.61 — Buy signal
10-period SMA: $236.92 — Buy signal
20-period SMA: $235.59 — Buy signal
50-period SMA: $231.42 — Buy signal
📈 Market Sentiment
Pivot Points:
R1: $238.90
R2: $239.43
R3: $240.13
S1: $236.97
S2: $237.67
S3: $238.20
📅 Outlook
Bullish Scenario: A breakout above $238.90 could lead to a push toward $239.43 and higher.
Bearish Scenario: A drop below $236.97 may test support around $235.59.
Overall Bias: Neutral to slightly bullish, with positive momentum but facing near-term resistance.

AMZN 1D Time frame📊 Amazon (AMZN) Daily Snapshot
Current Price: $238.24
Change: +1.02% from the previous close
Intraday Range: $235.08 – $238.85
Volume: 27,033,778 shares traded
🔎 Key Levels
Resistance:
R1: $238.85 – $239.50 (short-term resistance zone)
R2: $242.52 (52-week high)
Support:
S1: $235.08 – $235.84 (short-term support zone)
S2: $230.00 (psychological support)
📈 Technical Indicators
RSI (14): 60.03 — Neutral to slightly bullish
MACD: 2.30 — Positive momentum
Moving Averages:
5-day SMA: $233.62 — Buy signal
50-day SMA: $226.19 — Buy signal
200-day SMA: $213.56 — Buy signal
📌 Market Sentiment
Catalysts: Positive market sentiment, with AMZN outperforming key competitors in recent sessions.
Sector Performance: Tech sector showing strength, with AMZN leading gains among peers.
📅 Outlook
Bullish Scenario: A breakout above $238.85 could lead to a push toward $242.52 (52-week high).
Bearish Scenario: A drop below $235.08 may test support around $230.00.
Overall Bias: Moderately bullish, with positive momentum but facing near-term resistance.

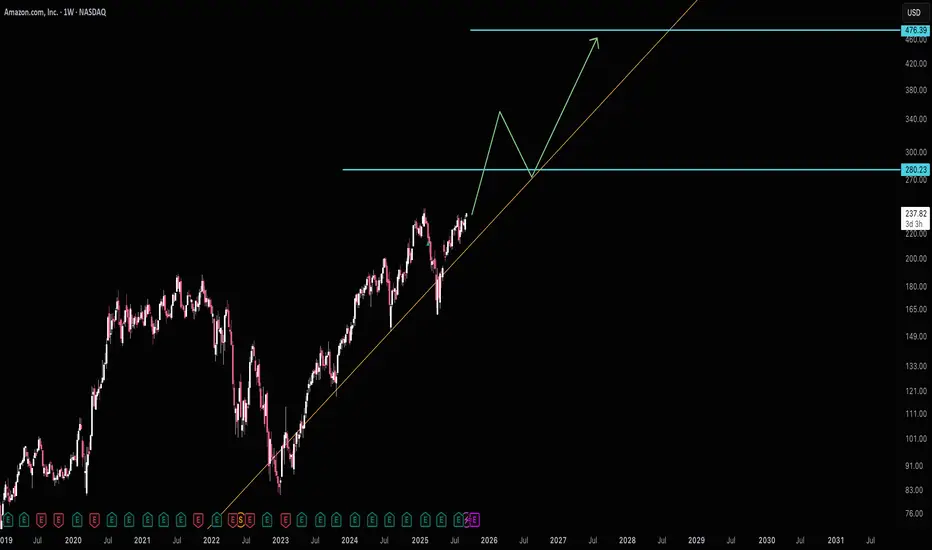
Amazon making it's way to next support $280Amazon seems to be overlooked at the moment, but it should start making bigger moves as it approaches $280 resistance (next support).
I see a lot of things that lead me to believe next year will have a big pullback in tech. Until then AMZN looks to have really good risk reward as it's still so close to it's long term trend line with revenue growth steadily increasing.
Good luck!
AMZNPossible trade setup opportunity in AMZN based on:
1-Price action
2-Volumen action
3-Moving averages and momentum
4-General market conditions

8/1/25 - AMZN: new SELL mechanical trading signal.8/1/25 - AMZN: new SELL signal chosen by a rules based, mechanical trading system.
AMZN - SELL SHORT
Stop Loss @ 234.11
Entry SELL SHORT @ 214.75
Target Profit @ 181.53
Analysis:
Higher timeframe: Prices have stayed below the upper channel line of the ATR (Average True Range) Keltner Channel and reversed.
Higher timeframe: Victor Sperandeo's (Trader Vic) classic 1-2-3/2B SELL pattern...where the current highest top breakout price is less or only slightly peaking higher than the preceding top price.

Global Soft Commodity Trading1. What Are Soft Commodities?
Soft commodities are agricultural products that are cultivated, harvested, and consumed globally. They are often seasonal, perishable, and dependent on climatic conditions. The main categories include:
Grains & Oilseeds
Wheat
Corn (maize)
Soybeans
Barley
Rice
Tropical Products
Coffee (Arabica, Robusta)
Cocoa
Sugar
Fibers
Cotton
Wool
Livestock & Others
Orange juice
Lumber
Dairy (in some markets)
These commodities are not only traded for consumption but also serve as raw materials for industries (e.g., cotton for textiles, soybeans for animal feed, sugar for ethanol production).
2. Historical Evolution of Soft Commodity Trading
Soft commodity trading is as old as civilization itself. The rise of agriculture allowed communities to specialize and trade surplus harvests for other goods. Some key historical milestones include:
Ancient Civilizations: Wheat and barley were traded in Mesopotamia, rice in Asia, and cotton in India and Egypt.
Medieval Period: The spice trade connected Asia to Europe, paving the way for global trading routes.
Colonial Era: European colonial powers exploited tropical regions for sugar, cotton, cocoa, and coffee plantations, fueling global demand.
Industrial Revolution: The textile boom drove massive cotton demand, while sugar and cocoa became staples in Western diets.
20th Century: Modern futures exchanges like the Chicago Board of Trade (CBOT) formalized grain trading, creating standardized contracts.
21st Century: Technology, globalization, and financialization have turned soft commodities into highly liquid and globally traded assets.
3. Key Global Soft Commodities and Their Markets
3.1 Coffee
Second most traded commodity after crude oil (by value).
Grown mainly in Brazil, Vietnam, Colombia, and Ethiopia.
Traded on ICE Futures U.S. (Intercontinental Exchange).
Prices are highly sensitive to weather, pests, and demand from developed countries.
3.2 Cocoa
Primary ingredient in chocolate.
Grown mainly in West Africa (Ivory Coast, Ghana), with smaller producers in Indonesia and Latin America.
Highly volatile due to labor conditions, political instability, and climate.
3.3 Cotton
Integral to the textile industry.
Major producers: India, China, USA, Pakistan.
Traded on ICE Cotton No.2 futures.
Sensitive to weather, pests, and industrial demand.
3.4 Sugar
Dual use: food consumption & biofuel (ethanol).
Brazil is the largest producer and exporter.
Weather patterns (El Niño/La Niña) impact global supply.
3.5 Grains (Wheat, Corn, Rice, Soybeans)
Staple foods for billions worldwide.
U.S., Russia, Ukraine, China, and India dominate production.
Corn is also used for livestock feed and biofuels.
Soybeans are critical for animal protein and vegetable oils.
4. Global Trading Hubs for Soft Commodities
Chicago Board of Trade (CBOT) – grains and oilseeds.
Intercontinental Exchange (ICE) – coffee, cocoa, cotton, sugar.
New York Mercantile Exchange (NYMEX) – certain agricultural futures.
Euronext (Paris) – milling wheat.
Multi Commodity Exchange (MCX) – India – cotton, sugar, and agricultural futures.
Dalian Commodity Exchange (DCE) – China – soybeans and related products.
These exchanges provide futures contracts that allow producers, traders, and investors to hedge risks and speculate on price movements.
5. Participants in Soft Commodity Trading
5.1 Producers
Farmers, cooperatives, and agricultural companies.
Seek to hedge against falling prices by selling futures contracts.
5.2 Consumers
Food companies, textile firms, and beverage manufacturers.
Hedge against rising input costs.
5.3 Traders
Middlemen who connect producers with consumers.
Examples: Cargill, Louis Dreyfus, Archer Daniels Midland (ADM), Bunge.
5.4 Speculators
Hedge funds, institutional investors, and retail traders.
Provide liquidity but increase volatility.
5.5 Governments
Regulate exports, impose subsidies, or control food inflation.
6. Trading Mechanisms
Soft commodities can be traded in several ways:
6.1 Spot Market
Immediate delivery at current prices.
Common for physical buyers like millers, roasters, or exporters.
6.2 Futures Contracts
Standardized contracts traded on exchanges.
Allow hedging and speculation. Example: CBOT Wheat Futures.
6.3 Options on Futures
Provide the right, not obligation, to buy/sell futures.
Used to manage risks.
6.4 Over-the-Counter (OTC) Contracts
Customized private agreements between parties.
6.5 ETFs & Indices
Investors can gain exposure without physical delivery.
Examples: Teucrium Wheat ETF, iPath Coffee ETN.
7. Factors Influencing Soft Commodity Prices
Weather & Climate
Droughts, floods, hurricanes, and frost can devastate harvests.
El Niño & La Niña cycles strongly impact global production.
Geopolitics
Wars (e.g., Russia-Ukraine conflict impacting wheat exports).
Trade policies, tariffs, and export bans.
Currency Movements
Commodities are priced in USD, so fluctuations in dollar value affect global prices.
Global Demand & Consumption Trends
Rising middle class in Asia → higher demand for coffee, chocolate, meat, and processed foods.
Health trends and biofuel demand shape consumption patterns.
Technology & Productivity
GMOs, irrigation, and fertilizers increase yields.
Mechanization reduces costs but can lead to oversupply.
Speculation & Financialization
Hedge funds and ETFs increase price swings.
8. Risks in Soft Commodity Trading
Price Volatility: Sudden weather events or political decisions can cause sharp movements.
Perishability: Storage costs and risks are higher than for hard commodities.
Market Manipulation: Concentrated players can distort prices.
Geopolitical Instability: African cocoa-producing nations often face coups or civil unrest.
Climate Change: Long-term risk as shifting patterns affect traditional growing regions.
9. Opportunities in Soft Commodity Trading
Portfolio Diversification: Provides a hedge against inflation.
High Liquidity: Futures markets are highly liquid, offering trading opportunities.
Emerging Market Demand: Rising populations in Asia and Africa drive demand growth.
Technological Advancements: AI, blockchain, and satellite monitoring improve forecasting and transparency.
Sustainable Investing: ESG-focused funds look at ethical sourcing of coffee, cocoa, and cotton.
10. Case Studies
10.1 Coffee Price Shock (2014)
Brazil’s drought severely reduced coffee output, leading to a 70% surge in Arabica prices. Traders who anticipated the weather-driven shortage made huge profits.
10.2 Cocoa Market (2020–2022)
Political instability in Ivory Coast and Ghana disrupted supply chains, while rising demand in Asia pushed prices higher.
10.3 Russia-Ukraine War (2022–2023)
Ukraine, a top wheat exporter, was blocked from shipping through Black Sea ports, causing a global food crisis. Futures spiked, and developing nations faced shortages.
Conclusion
Global soft commodity trading is a vital, dynamic, and complex part of the international economy. It touches everything from the morning coffee in your cup to the bread on your table and the cotton in your clothes. Unlike hard commodities, soft commodities are more unpredictable, influenced by weather, politics, and human consumption habits.
For investors and traders, soft commodities present both opportunities for profit and risks of volatility. For policymakers, they represent a tool of food security and geopolitical leverage. For producers, they are a lifeline tied to livelihoods and survival.
As climate change, technology, and shifting consumption patterns reshape the world, soft commodities will remain at the heart of global trade, shaping the balance between supply, demand, and sustainability.
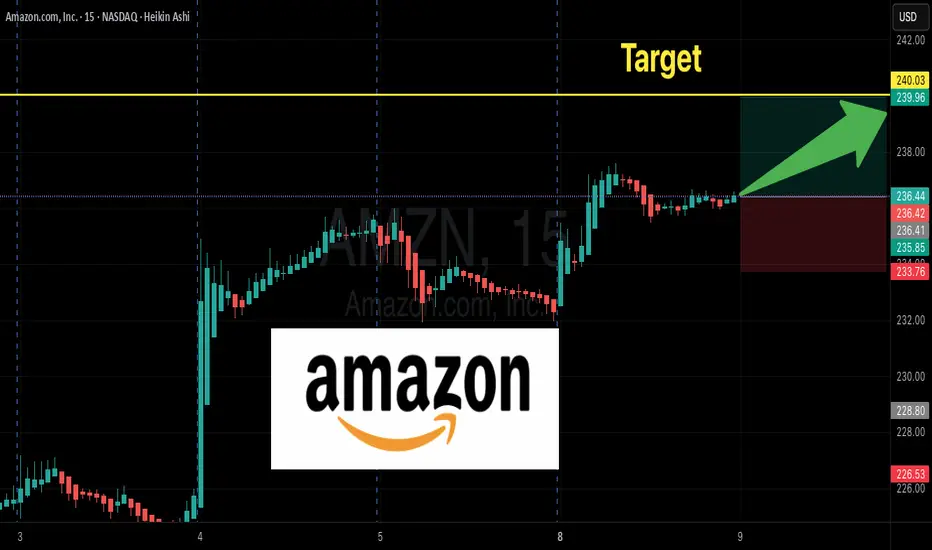
AMZN $240 Weekly Call — Tactical Play for Quick Gains
🚀 **AMZN Weekly Options Alert — \$240 Call Could Double in 4 Days!**
**Directional View:** **Strong-to-Moderate Bullish** 💹
**Confidence:** 75%
**Trade Setup:**
* **Instrument:** AMZN
* **Strategy:** BUY CALL (single-leg)
* **Strike:** \$240
* **Expiry:** 2025-09-12 (4 DTE)
* **Entry Price:** \$0.68 (ask at open)
* **Size:** 1 contract
**Targets & Risk:**
* **Profit Target:** \$1.36 (100% gain)
* **Partial Profit:** \$1.02 (50% gain)
* **Stop Loss:** \$0.34 (50% of premium)
* **Exit Rule:** Close everything by Thursday 15:30 ET to avoid gamma/theta risk
**Why This Trade?**
✅ Weekly RSI rising (71.5) + expanding weekly volume (1.3x) → bullish momentum
✅ Strong call skew (C/P 1.99) → institutional positioning
✅ Low VIX (\~15.2) → cheaper premiums, directional edge
✅ Strike \$240 slightly OTM with **high liquidity** (OI 24,202)
**Key Risks:**
⚠️ Falling daily RSI (59.9) → short-term consolidation possible
⚠️ 4-DTE weekly → high gamma/theta; strict stop mandatory
⚠️ Unexpected news or sector moves could spike IV or widen spreads
⚠️ High OI may create pinning behavior near \$240
**Quick Takeaway:**
* Tactical **short-term bullish weekly trade**
* Exploits **momentum + options flow + liquidity**
* Strict **risk management**: stop at 50% and exit by Thursday
* Partial profits at 50%, full target at 100% gain
---
📊 **TRADE DETAILS (JSON)**
```json
{
"instrument": "AMZN",
"direction": "call",
"strike": 240.0,
"expiry": "2025-09-12",
"confidence": 0.75,
"profit_target": 1.36,
"stop_loss": 0.34,
"size": 1,
"entry_price": 0.68,
"entry_timing": "open",
"signal_publish_time": "2025-09-08 10:11:13 UTC-04:00"
}
```
AMAZON PULLBACK AHEAD|SHORT|
✅AMAZON has retested a key
Resistance level of 236.60$
And as the pair is already
Making a bearish pullback
A move down to retest the
Demand level below at 230.00$
Is likely on Monday
SHORT🔥
✅Like and subscribe to never miss a new idea!✅

Trade Idea – Amazon (AMZN)AMZN just broke above recent highs and closed the gap from the earnings drop.
Price has now bounced off the 50-day MA for the 4th time, signaling a strong dynamic support.
Yesterday's move came on a vector candle with 150% of the 20-day avg. volume → strong confirmation.

Amazon (AMZN) Shares Jump Over 4%Amazon (AMZN) Shares Jump Over 4%
Amazon (AMZN) shares were among the top gainers in the equity markets yesterday, rising more than 4% and closing above $235 for the first time since February 2025.
The rally was fuelled by reports that Kuiper – Amazon’s project aimed at providing internet access via a network of low-Earth orbit satellites – has signed a partnership agreement with JetBlue. From 2027, this will allow free Wi-Fi to be offered on board selected aircraft. As a result, Amazon’s project is emerging as a new competitor to Elon Musk’s Starlink.
Technical Analysis of Amazon (AMZN) Chart
Since August, AMZN’s price fluctuations have been forming a bullish structure of higher highs and higher lows (0-A-B-C-D-E-F).
These and other key turning points provide the basis for constructing an upward channel (shown in blue), with the following implications:
→ in the near term, the price could surpass the previous high at point E, extending the bullish structure;
→ the channel median has proved to be an important support level – it held the price during the early August decline and continued to play this role throughout the month.
It is worth noting that AMZN’s upward momentum within the channel is unfolding step by step, making it possible to draw intermediate resistance lines R0, R1, and R2. In this context:
→ they can be viewed as examples of a bullish flag chart pattern;
→ yesterday’s rally with a bullish gap may signal the start of a new growth phase towards the next resistance at R3.
However, on this path, hurdles could come from:
→ the upper boundary of the blue channel;
→ the $230 level, around which a bearish head and shoulders pattern formed in February, marking this year’s high;
→ the psychological level of $250.
This article represents the opinion of the Companies operating under the FXOpen brand only. It is not to be construed as an offer, solicitation, or recommendation with respect to products and services provided by the Companies operating under the FXOpen brand, nor is it to be considered financial advice.
