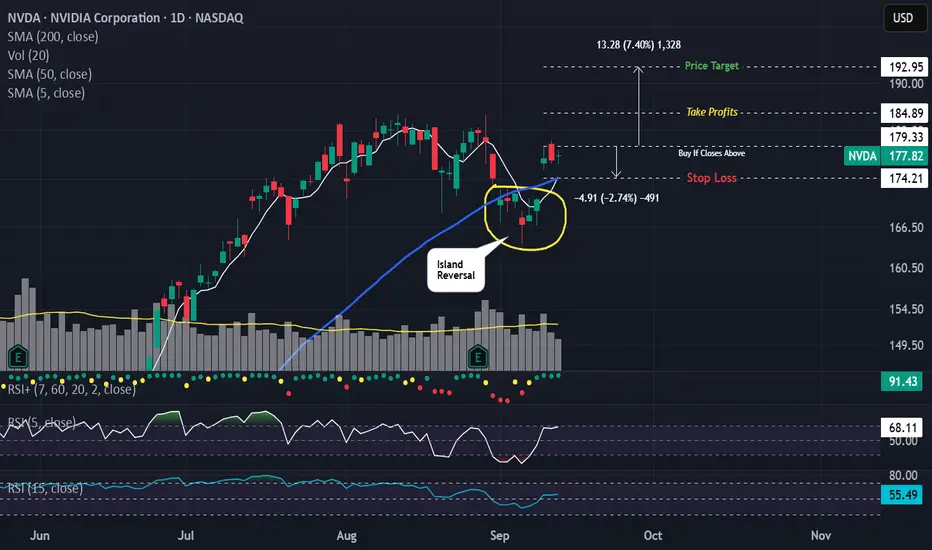
New Setup: NVDANVDA is setup to possibly go higher if it can get around to closing above 179.33. I like how it has an island reversal pattern. If a buy is triggered, I plan to take some profits at 184.89 and set a trailing stop using 8EMA with a price target of 192.95. Cheers!
NVDG trade ideas
NVDA - Price ProjectionNVDA made a double top on 28/08/2025, since been making Lower Highs and Lower Lows. Althought its still just above SMA50. I see some downside in NVDA before a move up.
The question is where would I be a buyer?
I would inch in to buy for a swing trade at three levels:
- my first buy would be at around 157. This is at a long term trendline that goes back to Mar 2024
- my second buy would be 152.74. This a support level from previous double top
- my third buy would be between 147 and 148. This is a strong level and a confluence of two levels. There is gap fill at 147.90 and Fib retracement level of 38.2% at 147.55
Alternatively, my thesis will be invalid if NVDA close above 184.

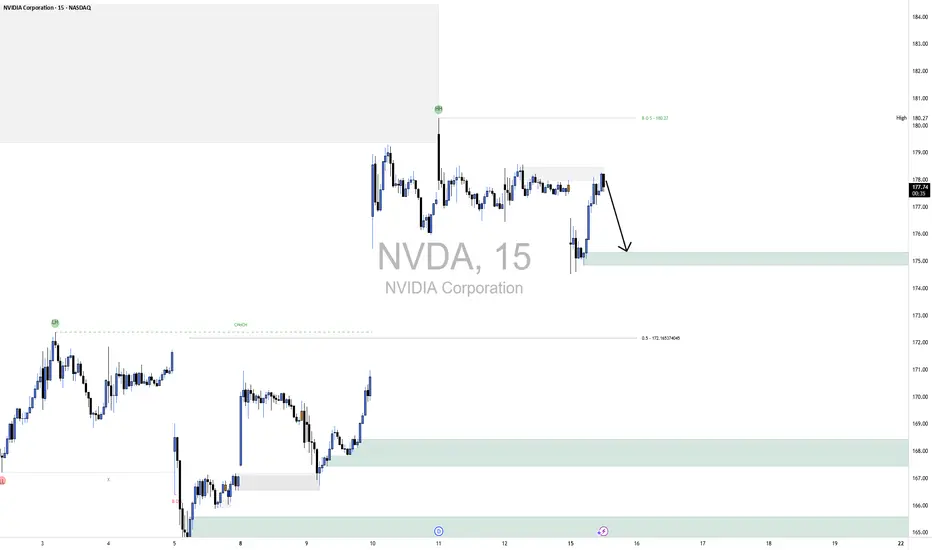
NVDA ShortThe broader market structure on NVDA remains range-bound but with a slight bearish tilt after the recent Break of Structure (BOS) at 180.27, which confirmed sellers pushing price lower from the recent swing high. This BOS indicates short-term momentum favoring the downside, with price unable to reclaim the highs.
Looking at supply and demand, the most recent supply zone near 178–179 caused a sharp reaction and rejection, showing that sellers stepped in with strength. The nearest demand sits at 175–174.5, where buyers previously initiated a strong impulse that led to the most recent rally, making it a valid level to watch for a bounce. Deeper demand exists near 172, which aligns with a 50% retracement level and previously acted as the base of a major move higher.
Price action within the marked region shows that NVDA is currently pulling back from supply, with sellers pushing price lower and momentum slowing on the way down. The most likely next step is a retest of the 175 demand zone. If price reacts bullishly here with strong candles, we could see a bounce back toward 177–178. However, if demand fails to hold and we break below 174.50, continuation toward 172 becomes likely as price seeks deeper liquidity.
The trade bias is currently bearish until we see a strong bullish reaction from demand. Invalidation for shorts would be a clean reclaim and close above 178.50, which would shift structure back toward the upside and likely target 180 again. Momentum currently favors sellers, given the BOS and recent rejection from supply, and candles show lower wicks are minimal—indicating little absorption from buyers yet.
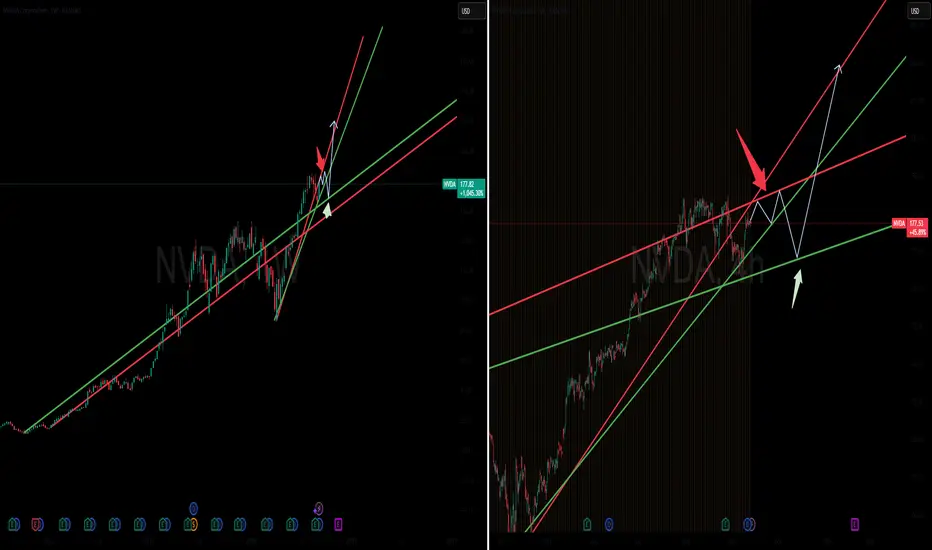
The NVDA Trade: The Tactical Case for an NVDA RetracementNVIDIA's price has been confined within a well-defined ascending channel, with its upward trajectory governed by a diagonal support trendline and its upside limited by a confluence of resistance. The stock's recent attempts to advance have been definitively rejected by this overhead resistance zone, signaling a lack of sufficient buying pressure at current price levels.
The Trading Hypothesis
The primary thesis is that the price will re-engage with and test the strength of the lower diagonal support trendline one final time. The failure to decisively break the dual overhead resistance marks a key moment, suggesting that a retracement is necessary to reset market conditions and establish a more stable foundation for a future rally.
This projected move involves a retracement back to the lower boundary of the existing channel. The price action here will be critical. Should this diagonal support fail to hold—a high-probability scenario given the recent rejections at resistance—it would trigger a breakdown of the prevailing uptrend.
This breakdown would likely initiate a more substantial corrective wave, driving the price toward the next major horizontal support level. This lower support line, identified on the chart, represents a key demand zone where new long-term buyers may step in, providing the necessary liquidity to halt the decline and potentially form a new base.
Entry Point: The Red Arrow
The red arrow on the chart signifies the optimal entry point for initiating a short position.
Exit Point: The Green Arrow
The green arrow marks the strategic exit point for the short position. This level is defined by the next major horizontal support line
NVDA 1H + GEX Game Plan for Tue, Sep 16NVDA Coiling Under the 180 Gamma Wall — Break or Fade Day? 🚦
Market Structure (1H)
* Price rebounded from 172.5 and is compressing under a descending trendline drawn from ~180s.
* Momentum is turning up (MACD curling), but Stoch RSI is hot, so first touches into resistance can reject.
* Intraday balance likely between 172.5 ↔ 180 unless we get a clean break.
Key Levels
Resistance: 177.3–177.8 (intraday ceiling), 178.6, 180 (major wall), 182.5 (next wall), 185.
Support: 175.0, 172.5 (big pivot), 170.0, 167.5 (put wall), 165, 160.
GEX Read (Sep 16 session)
* Highest positive NETGEX / Call resistance: 180 (primary gamma wall).
* Additional call wall: 182.5.
* Put walls: 167.5 and 165.
* HVL / magnet: around 172.5.
* IVR ~3–4, IVx ~39 → options relatively cheap vs own history (careful with overtrading, but debit spreads price well).
* Participation skew light on calls (~25–26%): flow is neutral to slightly cautious.
Implication: Dealers likely keep NVDA pinned 172.5–180 unless flow shifts.
* Above 180: hedging can push to 182–182.5 → 185.
* Below 172.5: opens 170 → 167.5 (put wall magnet).
Trade Setups (use one, not all)
1) Bullish Breakout
* Trigger: 1H/15m close > 177.8 and hold above trendline; momentum stays positive.
* Entry: 178.0–178.2 on hold/retest.
* Targets: 179.8 → 180; runners 182–182.5.
* Invalidation/Stop: below 176.8 (back inside range).
* Options (conservative): 180/182.5 call debit spread (same-week). Take partial near 180; leave a runner only if 180 converts to support.
2) Fade the Wall
* Trigger: Spike into 179.8–180.2 and stall (lower TF rejection / bearish wick).
* Entry: scale in on the rejection.
* Targets: 177.5 → 175.5.
* Invalidation/Stop: above 181.2.
* Options: 180P or 177.5/175 put debit spread (same-week). Quick take-profits into 177–175.
3) Breakdown From Pivot
* Trigger: Clean 1H break < 172.5 with a retest that fails.
* Entry: 172.2–172.4 on failed retest.
* Targets: 170.5 → 167.8 (≈ put wall 167.5).
* Invalidation/Stop: back above 173.3.
* Options: 172.5/170 put debit spread, leave a runner toward 167.5 only if momentum accelerates.
Scalper’s Notes
* First test of 177.8–178.6 likely reacts. If buyers absorb, flip to breakout bias.
* If we gap near 175–176, watch for a quick liquidity sweep toward 172.5 → bounce back into range.
* VWAP/EMA retests that hold above 177.8 favor a push to 180; fails below 175 lean back to 172.5.
Swing Context (1–3 days)
* Still a lower-highs channel until 180/182.5 is reclaimed.
* Reclaim and hold ≥180 turns the path toward 185 this week.
* Lose 172.5 on a daily close and the door reopens to 170 → 167.5.
Risk & Management
* Keep risk tight at the edges; don’t chase inside the 175–177 chop.
* For spreads, size so a full debit loss is acceptable; scale out at first target.
* If IV expands into the move, take profits faster on long options.
This analysis is for education only, not financial advice. Manage risk and trade your plan.

NVIDIA Stock Near Support, Bullish Trend AheadNVIDIA stock is currently trading in close proximity to a critical technical support level. This positioning comes within the context of a firmly established and ongoing bullish trend, characterized by a consistent pattern of forming higher highs and higher lows on its price chart. This sequential upward movement is a classic and powerful technical indicator, suggesting that buying pressure continues to outweigh selling pressure at each successive market cycle.
The prevailing market sentiment and technical structure suggest that this upward momentum is likely to persist in the upcoming trading sessions. Based on this constructive chart pattern, analysts project a potential ascent towards a significant target on the higher side, with the market poised to challenge the $183.00 per share level. This represents a key resistance point that, if breached, could signify a continuation of the bullish phase.
Conversely, on the lower side, the $164.00 price level is identified as a crucial support zone. This is the floor that bulls are expected to defend vigorously to maintain the current positive trajectory. A decisive break below this support could potentially invalidate the near-term bullish outlook, making it a essential level for risk management. Therefore, while the bias remains tilted towards the upside with a clear target in sight, the $164.00 support acts as a vital demarcation line for the trend's integrity.

$NVDA rolling over. $SMH looks vulnerableSemis have been the toughest pillar of this bull market. The Semis ETF NYSE:SM has been making new highs and new lows with occasional consolidation. NASDAQ:NVDA has been instrumental in the dominance of NASDAQ:SMH in most of the thematic ETFS. The ratio chart $NVDA/ NASDAQ:SMH is also showing signs of weakness and rolling over hard. Last time NASDAQ:NVDA lost momentum it fell 40%. Will the history repeat? History usually rhymes. So, when we see weakness in the largest stock in SP:SPX the indices will also roll over. The momentum weakness is visible in the RSI.
If we believe that the previous highs act as support, then we can expect the stock to drop to 150 $. This aligns with the 1.0 Fib retracement level. This can mark a 17% downturn from here. The next support is around 120 $. That will mark a 33% pull back which is not unusual for $NVDA. But these price level will be great accumulation point for the stock. The consolidation in NASDAQ:SMH and NASDAQ:NVDA was predicated by me on Aug 3. But our long-term target remains intact with NASDAQ:NVDA @ 250 and NASDAQ:SMH @ 315.
Verdict: NASDAQ:NVDA and NASDAQ:SMH looks vulnerable here. Price consolidation more likely providing good entry points in $NVDA. Long term target still holds.

NVDA ShortThe broader market structure on NVDA remains bearish, with price putting in lower highs since failing to hold above $180.27. The recent Change of Character (CHoCH) around $164.08 marked a significant shift to bullish momentum, but the market failed to create a clean higher high above $180, leaving the larger bearish structure intact. This failure to break structure to the upside suggests we may be seeing distribution forming at the current levels.
Supply is sitting just above current price in the $178–179 range, where price previously rejected sharply and formed a consolidation top. This is a strong supply zone since sellers stepped in aggressively the last time price was here. Below, there is a well-defined demand zone between $167–164, where buyers stepped in with strength and caused a sharp rally. However, the rally lost steam as it approached supply, which indicates that demand may not be strong enough to absorb another large selloff.
Price action in the marked region is consolidating just below supply, showing choppy, sideways behavior. This is often a sign of absorption before a potential breakdown. If price rejects this supply zone and breaks below intraday support, we could see a move down toward $168, and possibly deeper into the lower demand zone.
The current trade bias is bearish, with an expectation of continuation to the downside after supply rejection. A sustained move and close above $180.50 would invalidate this view and signal potential continuation higher. Momentum is favoring sellers, as price has struggled to break above resistance despite multiple attempts, and wicks on the top side indicate rejection.

NVIDIA: Rally Stalling?After Nvidia initially drew closer to our beige Target Zone between $150.09 and $139.58, the stock was recently pushed higher once again. Therefore, we still see a 40% chance that a new high for beige wave alt.III could emerge above resistance at $184.11. However, our primary view is that price has already entered wave IV, which should extend downward into the aforementioned beige zone. Since we expect a strong rally during wave V, this price range presents an attractive entry point for long positions, with a stop that can be set 1% below the lower boundary of the zone. Looking ahead, beige wave V should extend up to the blue Target Zone between $227.38 and $260.60, where it should complete the larger waves (V) in blue and in lime green.

You wanna bet against NVDA? Go ahead. Not me, though.This is now my 7th idea for NVDA. It's been a while, and I don't really know why. I guess maybe it seems tiresome posting ideas about the same stocks over and over again. But you know what isn't tiresome? Making money on those same stocks over and over again.
The yellow circles represent the entries for my previous ideas. Those trades were made during one of the worst 4 month stretches for NVDA in a LONG time. It lost about 19% for buy and holders during that time. I won't make you go back and data mine the results of my trades in that span. Here are all 12 lots I traded in those 6 ideas:
+8.1% in 6 trading days
+9.90% in 5 trading days
+14.50% in 3 trading days
+4.89% in 1 trading day
+0.74% in 1 trading day
+0.50% in 1 trading day
+1.80% in 1 trading day
+2.30% in 2 trading days
+3.40% in 1 trading day
+8.80% in 1 trading day
+2.60% in 9 trading days
+12.31% in 4 trading days
I trade equal dollar lot sizes so those 12 trades produced a total non-compunded return of just under +70% WHILE the stock was falling 19%. That's not self-promotion, that's a prelude to what comes next.
I'm not afraid of the stock dropping from here. If I was, I would not make the trade. The reality is that the way I trade actually works better when stocks move sideways or are falling than when they are in strong uptrends. Since April, my algo has only generated 5 signals on NVDA. I've only traded 2 of them before this, but all 5 are marked with white arrows. Add those to the ones from previous ideas and we are looking at a total gain of +92% or so since November.
While the most recent signal prior to this one is a loser SO FAR, it actually presents a better opportunity. Historically, the returns on the 2nd entry (adding to an existing trade) are MUCH better than the initial entry returns. Luckily, I didn't trade that most recent signal, so I get to try to grab more juice with less squeeze.
I won't lie, if employment falters after that inflation read we got today, it could be the beginning of a rough period for stocks. But I also know that virtually nobody can predict macro with any degree of success, least of all me. I'd also rather hitch my wagon to NVDA than to the vast majority of stocks in a generally overpriced market.
Add to all that the fact that they are pulling in over $500m a DAY in revenues, roughly 50% more than a year ago - and Wall St. is sad about that, apparently.
The stock also is resting RIGHT on near term support and there is more close by, which makes me take this trade enthusiastically. A word of caution, though. If the whole market goes down, NVDA will too and that could lengthen the time it takes to close here. I only trade the stock, so time isn't really an issue for me. For someone trading short dated options, it would be a disaster if this runs for a while.
My long entry price is 174.18 at the close today. I can and will add to the position tactically if good opportunities present themselves and I will update this idea whenever I add or sell lots.
As always - this is intended as "edutainment" and my perspective on what I am or would be doing, not a recommendation for you to buy or sell. Act accordingly and invest at your own risk. DYOR and only make investments that make good financial sense for you in your current situation.

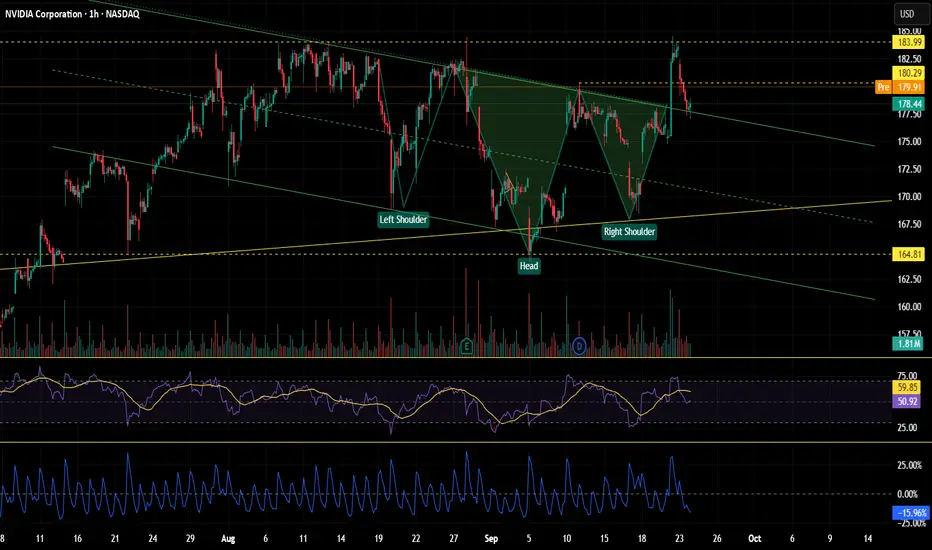
NVDA weekly chart reverse head and shouldersNVDA weekly chart reverse head and shoulders is clearly forming. Looks very bullish. Important to check confirmation of the green candle next Friday. Than a close look to day chart for getting prediction on how far it goes up.
NVDA 2HourTime frameNVDA 2-Hour Snapshot
Current Price: $170.76 USD
Previous Close: $168.31 USD
Day Range: $166.74 – $170.97 USD
52-Week Range: $139.34 – $200.00 USD
Volume: 170,370,750
VWAP: $169.67 USD
Market Cap: $1.1 Trillion
🔎 Technical Indicators
Relative Strength Index (RSI): 39.44 — Neutral
Moving Averages:
5-period: $169.68 — Sell
10-period: $174.59 — Sell
20-period: $177.06 — Sell
50-period: $172.58 — Sell
100-period: $150.61 — Buy
200-period: $139.34 — Buy
Moving Average Convergence Divergence (MACD): -0.91 — Buy
Stochastic Oscillator: 20.33 — Neutral
Commodity Channel Index (CCI): -119.52 — Buy
Average True Range (ATR): 4.93
📈 Market Sentiment
Pivot Points:
Resistance: $175.00 USD
Support: $165.00 USD
📅 Outlook
Bullish Scenario: A breakout above $175.00 USD could signal a move toward $185.00 USD.
Bearish Scenario: A drop below $165.00 USD may lead to further downside.
Overall Bias: Neutral, with mixed signals from moving averages and momentum indicators.

bull flag and inverse head and shoulder breakout retestOn monday 22sept we broke the bullflag/ descending channel and also inverse head and shoulders on the 4hour chart with high volume.
Yesterday we went for a retest of the breakout as expected to 177.6
the 4hours candle closed as a bullish hammer candle.
Todays expectation is nvidia to retest or break its ATH at 184.
If we break 184 today we are lookig at the target of the inverse head and shoulder by end of week wich is 195.
if you look at the rsi ,the rsi is not overbought anymore and made a higher high so no signs of the bears.
Origins and Causes of the US–China Trade WarIntroduction
The trade war between the United States and China has become one of the most defining economic conflicts of the 21st century. It is not merely about tariffs or trade imbalances but represents a broader clash of economic models, political systems, and global ambitions. To truly understand why this trade war began, one must look beyond the headlines and consider the deep historical, economic, and geopolitical contexts that shaped U.S.–China relations over the past five decades.
The U.S.–China trade war formally erupted in 2018 under President Donald Trump’s administration, but its roots stretch back much further—to China’s economic reforms in the late 1970s, the U.S. decision to integrate China into the global trading system, and the growing perception in Washington that Beijing’s rise posed both economic and strategic challenges. The conflict was therefore the culmination of decades of tensions regarding trade deficits, intellectual property theft, industrial subsidies, and the role of state power in shaping markets.
This essay explores the origins and causes of the U.S.–China trade war in detail, examining historical background, economic dynamics, political factors, and the deeper strategic rivalry that underpins the confrontation.
1. Historical Context of U.S.–China Trade Relations
1.1 Early Isolation and Opening Up
For much of the 20th century, China was economically isolated. Following the Communist Revolution in 1949, China adopted a centrally planned economic system with little interaction with global markets. The U.S. had minimal trade with China, especially during the Cold War, when the two countries were ideological and geopolitical rivals.
Everything began to change under Deng Xiaoping’s economic reforms in 1978. China began opening up to foreign trade and investment, allowing special economic zones and market-driven policies. American companies saw enormous opportunities in China’s cheap labor and expanding consumer base.
1.2 Rapprochement and Normalization
The normalization of diplomatic relations in 1979 under President Jimmy Carter paved the way for commercial ties. Over the 1980s and 1990s, trade grew rapidly, and the U.S. increasingly viewed China as both a manufacturing hub and a market for exports.
1.3 WTO Accession and Its Consequences
A crucial turning point came in 2001, when China joined the World Trade Organization (WTO). The United States supported China’s accession, believing it would liberalize China’s economy, reduce state intervention, and bring Beijing closer to Western norms of free markets.
Instead, China used WTO membership to expand its export-led growth strategy. Its manufacturing capacity boomed, and U.S. companies moved large parts of their supply chains to China. While this benefited U.S. corporations and consumers with cheap goods, it also contributed to job losses in American manufacturing, fueling political resentment.
2. Economic Causes
2.1 U.S. Trade Deficit with China
One of the most visible triggers of the trade war was the massive trade imbalance. By the mid-2010s, the U.S. trade deficit with China exceeded $375 billion annually. Washington saw this as evidence of unfair practices, while Beijing argued it was the natural result of global value chains where final assembly took place in China.
2.2 Intellectual Property Theft and Technology Transfer
American firms long complained about forced technology transfer, intellectual property (IP) theft, and restrictions on market access. U.S. companies operating in China often had to form joint ventures with local firms, effectively handing over proprietary technology. Additionally, cyber espionage campaigns allegedly backed by the Chinese state targeted American corporations to steal industrial and military secrets.
2.3 Industrial Policy and State Subsidies
China’s economic model is built on significant state involvement in industry. Programs like “Made in China 2025”, launched in 2015, aimed to establish dominance in high-tech sectors such as semiconductors, robotics, and artificial intelligence. The U.S. saw these policies as unfair because Chinese firms received state subsidies, cheap loans, and protection from competition, giving them an edge over foreign rivals.
2.4 Currency Manipulation Accusations
For years, U.S. policymakers accused China of artificially undervaluing its currency (the yuan) to make exports cheaper and imports more expensive, thereby boosting its trade surplus. While this practice diminished after 2010, the perception remained influential in Washington’s decision-making.
3. Political and Strategic Causes
3.1 U.S. Domestic Politics and Populism
By the 2010s, public opinion in the U.S. had shifted. The loss of manufacturing jobs was often attributed to globalization and specifically to trade with China. Politicians began campaigning on promises to bring jobs back and stand up to Beijing. Donald Trump, elected in 2016, tapped into this sentiment with his “America First” agenda.
3.2 Rising Chinese Ambitions
China’s rapid economic rise also translated into greater global influence. The Belt and Road Initiative (BRI), military modernization, and technological leadership ambitions challenged U.S. dominance. Washington grew concerned that China was not just a trading partner but a strategic competitor seeking to reshape global power structures.
3.3 Clash of Economic Models
At the core of the conflict lies a fundamental clash of economic philosophies. The U.S. system emphasizes free markets, private enterprise, and limited government intervention, while China relies heavily on state capitalism and party-driven industrial policy. This structural difference fueled mistrust and accusations of unfair competition.
3.4 National Security Concerns
Trade and technology are increasingly intertwined with national security. The U.S. worried that dependence on Chinese supply chains—particularly in areas like telecommunications (Huawei, 5G), semiconductors, and rare earth minerals—posed security risks. Restrictions on Chinese technology firms were thus framed not only as trade issues but also as matters of national defense.
4. Escalation into a Trade War
4.1 Trump’s Tariff Strategy
In 2018, President Trump imposed tariffs on Chinese imports worth billions of dollars, citing Section 301 of the U.S. Trade Act of 1974. China retaliated with its own tariffs on U.S. goods, particularly targeting politically sensitive industries like agriculture.
4.2 Negotiations and Breakdown
Although several rounds of negotiations were held, fundamental differences remained unresolved. The U.S. demanded structural reforms in China’s economy, while Beijing refused to abandon state-led policies it considered essential for development.
4.3 Global Economic Fallout
The trade war created uncertainty in global markets, disrupted supply chains, and led to slower economic growth worldwide. Multinational corporations had to rethink sourcing strategies, with some shifting production to countries like Vietnam and Mexico.
5. Deeper Structural Causes
5.1 Thucydides Trap and Power Transition Theory
Some scholars frame the trade war as part of the “Thucydides Trap”—the idea that when a rising power (China) threatens to displace an established power (the U.S.), conflict becomes likely. From this perspective, the trade war is just one manifestation of a broader rivalry for global supremacy.
5.2 Technological Dominance as the New Battleground
The real competition is not about traditional manufacturing but about who leads in emerging technologies—AI, 5G, quantum computing, and biotech. The U.S. fears losing its edge to China, which invests heavily in these areas with state backing.
5.3 Globalization Backlash
The trade war also reflects a broader backlash against globalization. In the U.S., many communities felt left behind by outsourcing and global supply chains. The trade conflict thus became a way to politically channel domestic frustrations.
6. Conclusion
The U.S.–China trade war did not arise overnight. It was the product of decades of economic integration combined with unresolved tensions over trade imbalances, intellectual property, state subsidies, and market access. At its core, the conflict represents not just a dispute over tariffs but a struggle between two economic systems and visions of world order.
The United States seeks to preserve its global dominance and protect its industries, while China aims to secure its rise as a technological and geopolitical power. The trade war is therefore less about soybeans and steel and more about the future of global leadership.
Whether the two countries can find a sustainable coexistence will shape not only their bilateral relationship but also the trajectory of the world economy in the decades ahead.
DAX und TTD AnalyseDer Dax steht aktuell an einem sehr interessanten Punkt, genauso wie die Aktie TTD.

Trend Reversal (Drummond Geometry)Trend Reversal 🔄 Spot and trade sharp market reversals using Drummond Geometry.
1. What It Is
A trend reversal is a sharp, sudden change in market direction.
Defined as 3 consecutive closes on one side of the PL Dot immediately following a trend in the opposite direction.
Can also occur from congestion , so always be open to reversal setups
First image shows the congestion entrance bar
Second image shows the bars that have a close on the same side of the PLdot, thus confirming a a trend-up
Third image shows the immediate shift (reversal)
And finally the trend down
2. Market Context
The market alternates between trend runs and congestion .
Bars are categorized as:
Trend bars : 3 closes on the same side of the PL Dot.
Congestion entrance : A close on the opposite side of the PL Dot after a trend.
Congestion action : Oscillations back and forth across the PL Dot.
Congestion exit : Trend emerging from congestion.
3. Signs of a Trend Reversal
PL Dot pulls back into bar range.
A 5-9, 5-2, 5-1, or 6-1 line appears in the preceding bar.
Resistance/support against the old trend holds; levels in the new trend direction break.
The original block level may be violated (not mandatory).
4. The Cornerline
A diagonal line linking the isolated high/low of congestion entrance with the trend reversal bar .
It’s the bar that confirms a sharp directional shift.
Specifically, it’s the first bar to close on the opposite side of the PL Dot after a trend, followed by two more bars closing on that side (making the full reversal pattern).
It often violates the original block level from the previous trend (though that’s not required).
This bar is linked with the congestion entrance bar via the cornerline—a key diagonal that helps confirm if the reversal has real strength.
So, think of it as the pivot bar that kicks off the new trend, showing that momentum has flipped hard enough to change market structure.
Rarely broken in a true reversal.
High-energy reversals influence all following congestion structure.
5. Anticipation Tips
Watch focus time period (FTP) within higher time period (HTP) envelopes.
Daily reversals often align with:
Daily congestion entrance signs.
Monthly cycles or c-waves pushing weekly structure.
PL Dot pressure at higher levels.
📌 Trader’s Edge:
Trend reversals are fast, decisive moves often starting from strong HTP energy zones. Look for PL Dot pullbacks, strong block levels, and cornerlines to confirm. Once validated, they can define the next major swing or cycle.

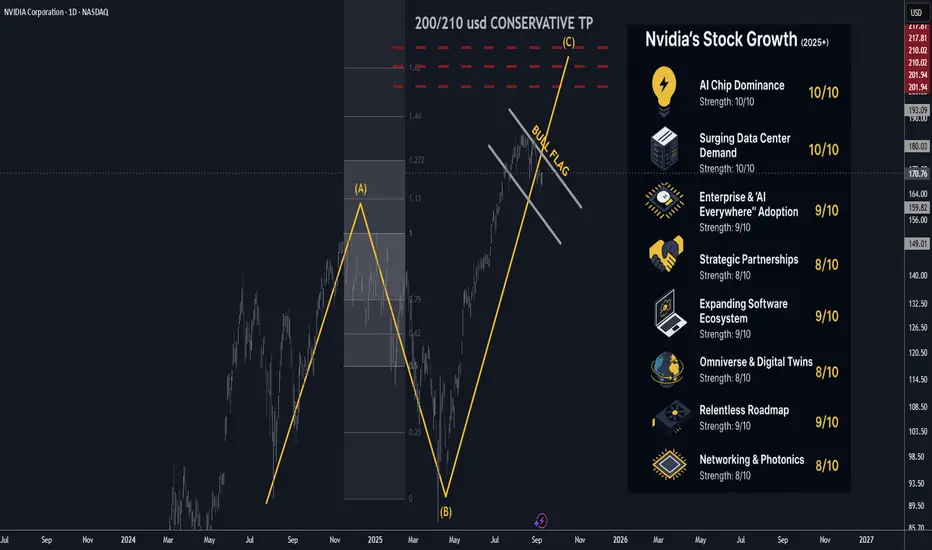
Nvidia (NVDA) 2025+ Catalysts Updated: Analyst Views September🚀 Nvidia (NVDA) 2025+ Catalysts & Risks: Analyst Views — Updated September 2025
________________________________________
📝 Summary Outlook (September 2025)
Nvidia remains at the center of the global AI boom, with dominant GPU share, a strengthening networking/software moat, and multi-year sovereign and enterprise buildouts driving demand. Q2 FY26 confirmed strong momentum, while Q3 guidance points to continued growth. The main risks lie in tariff policy, China licensing, supply chain tightness, and valuation sensitivity. Street consensus remains bullish, with targets in the $207–$211 range and a Strong Buy bias.
🔑 Key Catalysts Driving Nvidia’s Stock Growth (2025+)
1. 🏆 AI Chip Dominance — Score: 10/10
Nvidia still commands ~90%+ of data-center AI accelerators, with CUDA/NVLink lock-in keeping switching costs high.
2. 🏗️ Surging Data Center Demand — Score: 10/10
Hyperscalers remain in an AI “build” cycle. 2025 data-center CapEx is approaching ~$300B, with Nvidia reporting record $41.1B Data Center revenue in its latest quarter.
3. 🌐 Enterprise & “AI Everywhere” Adoption — Score: 8.7/10
Companies across industries are rolling out AI assistants, copilots, and retrieval-augmented applications; Nvidia benefits via GB200 NVL72 racks and RTX-based inference at the edge.
4. 🤝 Strategic/Channel Partnerships — Score: 8.9/10
Cisco is integrating Spectrum-X into networking solutions, while HPE has expanded its Nvidia “AI factory” offerings—broadening reach into enterprise and hybrid AI buildouts.
5. 🚗 Automotive & Robotics — Score: 8.4/10
Auto revenue grew ~70% Y/Y; DRIVE Thor shipments have begun, and Nvidia’s Jetson/AGX Thor and robotics platforms are expanding into industrial automation.
6. 🧑💻 Software & Subscriptions — Score: 8.6/10
Nvidia’s AI Enterprise, DGX Cloud, CUDA-Q, and TensorRT deepen recurring, high-margin revenue and increase developer lock-in.
7. 🌎 Omniverse, Digital Twins & Industrial AI — Score: 8.2/10
Ansys, Siemens, and other industrial software vendors are embedding Omniverse into simulation suites, accelerating adoption of “digital twins” and simulation AI workflows.
8. 🛜 Networking & Photonics — Score: 8.8/10
Spectrum-X Photonics enables co-packaged optics for exascale “AI factories,” improving bandwidth and efficiency while giving Nvidia more end-to-end control.
9. 🧪 Relentless Roadmap (Blackwell → Rubin) — Score: 9.0/10
Blackwell Ultra is ramping into 2025, with the Rubin architecture slated for 2026—sustaining Nvidia’s upgrade cycles.
10. 🌍 Sovereign & Global AI Buildouts — Score: 8.5/10
Europe, the Middle East, and India are launching sovereign AI projects. Saudi-backed Humain alone has committed to tens of thousands of Blackwell chips for 2026 buildouts.
________________________________________
📈 Latest Analyst Recommendations (September 2025)
• Street Stance: Strong Buy/Overweight remains dominant. ~85% of analysts rate NVDA a Buy; avg 12-mo PT ~$207–$211.
• Recent Calls: Multiple firms reiterated Overweight/Buy, with price targets up to $230.
• Common Bull Case: Nvidia’s accelerator lead, software moat, sovereign/enterprise AI pipeline, and expanding networking portfolio.
• Common Cautions: Premium valuation, competition from custom silicon, and export/tariff risk.
________________________________________
🗞️ Latest Events & News (Aug–Sep 2025)
• Q2 FY26 results (reported Aug 27, 2025): Revenue $46.7B (+56% Y/Y); Data Center $41.1B; Blackwell shipments +17% Q/Q; buyback program boosted by $60B.
• Q3 FY26 guidance: ~$54B (±2%) revenue.
• Networking push: Spectrum-X Photonics unveiled; Cisco partnership expanding enterprise deployments.
• Omniverse OEM deal: Ansys to embed Omniverse tech within its simulation platforms.
• Sovereign AI momentum: Saudi Humain centers to deploy 18k+ Blackwell chips starting 2026; UAE and India also ramping large-scale AI initiatives.
• Ecosystem investing: Nvidia continues selective investments in AI startups, strengthening CUDA adoption.
________________________________________
🇺🇸🇨🇳 US–China Tariffs & Export Controls — September 2025 Update
• Tariff truce extended (Aug 2025): Current tariffs remain at ~30% U.S. on Chinese imports and ~10% reciprocal from China. Next decision point: Nov 10, 2025.
• Supreme Court review: The Court will hear a case challenging U.S. executive authority on tariffs this fall.
• China export licensing: U.S. has begun granting licenses for Nvidia’s H20 China-compliant GPUs. Advanced Blackwell exports remain restricted without further approvals.
Impact on Nvidia: Truce reduces near-term disruption, but future tariff or licensing changes remain key risks. China sales are limited to compliant GPUs with lower margins.
________________________________________
⚠️ Key Negative Drivers & Risks (Updated)
1. 🇨🇳 US–China Tech Policy
Tariff truce is temporary; licensing decisions and court rulings keep China exposure uncertain.
2. 🏛️ Regulatory/Legislative Overhang
Proposals like the GAIN AI Act could impose stricter controls on exports and prioritize domestic deployments.
3. 🏭 Supply Chain Bottlenecks
Advanced packaging and HBM memory remain tight despite expansions—potential bottlenecks for shipments.
4. 🧮 Competitive Threats & Custom Silicon
AMD, Intel, and hyperscaler-designed accelerators continue to advance, potentially eroding Nvidia’s hyperscale share.
5. 🏷️ Valuation & Expectations
Nvidia trades at high multiples; any slowdown or guidance miss could trigger volatility.
6. 💵 Customer Concentration
Top cloud giants still account for a large share of revenue; CapEx pauses or custom chip adoption would materially impact results.
________________________________________
Nvidia Stock Chart Fibonacci Analysis 090925Trading Idea
1) Find a FIBO slingshot
2) Check FIBO 61.80% level
3) Entry Point > 168/61.80%
Chart time frame:B
A) 15 min(1W-3M)
B) 1 hr(3M-6M)
C) 4 hr(6M-1year)
D) 1 day(1-3years)
Stock progress:A
A) Keep rising over 61.80% resistance
B) 61.80% resistance
C) 61.80% support
D) Hit the bottom
E) Hit the top
Stocks rise as they rise from support and fall from resistance. Our goal is to find a low support point and enter. It can be referred to as buying at the pullback point. The pullback point can be found with a Fibonacci extension of 61.80%. This is a step to find an entry-level position. 1) Find a triangle (Fibonacci Speed Fan Line) that connects the high (resistance) and low (support) points of the stock in progress, where it is continuously expressed as a Slingshot, 2) and create a Fibonacci extension level for the first rising wave from the start point of the slingshot pattern.
When the current price goes over the 61.80% level, that can be a good entry point, especially if the SMA 100 and 200 curves are gathered together at 61.80%, it is a very good entry point.
As a great help, TradingView provides these Fibonacci speed fan lines and extension levels with ease. So if you use the Fibonacci fan line, the extension level, and the SMA 100/200 curve well, you can find an entry point for the stock market. At least you have to enter at this low point to avoid trading failure, and if you are skilled at entering this low point, with the fibonacci6180 technique, your reading skill of to chart will be greatly improved.
If you want to do day trading, please set the time frame to 5 minutes or 15 minutes, and you will see many of the low points of rising stocks.
If you prefer long-term range trading, you can set the time frame to 1 hr or 1 day

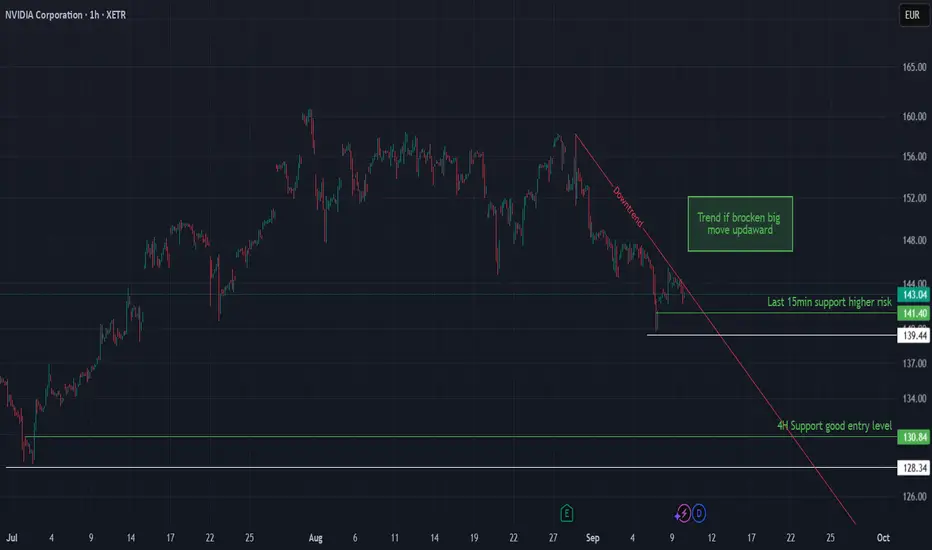
NVIDIA Testing Downtrend — Breakout Could Unlock UpsideNVIDIA has been trading in a corrective downtrend after its recent highs, with price compressing under the red trendline. If this downtrend breaks, a strong bullish move upward could follow, but key supports below remain critical if sellers extend pressure.
🔍 Technical Analysis
Current price: 143.04 EUR (XETR).
Price is consolidating under the downtrend line, keeping short-term bias cautious.
Immediate supports: 141.40 (short-term) and 139.44 (intraday).
A break of the red trendline would flip momentum bullish.
🛡️ Support Zones & Stop-Loss (White Lines):
🟢 141.40 – Last 15m Support (High Risk)
Weak intraday defense.
Stop-loss: Below 139.44
🟠 130.84 – 4H Support (Good Entry)
Major demand zone.
Stop-loss: Below 128.2
⚪ 128.34 – Macro Base
Strong final floor if deeper correction plays out.
🔼 Resistance Levels:
🟥 Downtrend Line (Red)
The key resistance. A break above → signals bullish reversal.
Psychological resistance: 145.00
🧭 Outlook
Bullish Case: Break above trendline → upside momentum resumes, targeting 145+.
Bearish Case: Rejection under trendline + loss of 141.40 → opens path to 139.44 and 130.84.
Bias: Neutral to bullish — watching for a confirmed trendline breakout.
🌍 Fundamental Insight
NVIDIA’s latest earnings disappointed the market, with slowing revenue growth and concerns about sustainability of its AI-driven boom. Profit margins remain high, but weaker guidance has triggered selling pressure and fueled the current downtrend.
Bearish pressure: Revenue slowdown + post-earnings profit-taking.
Bullish support: Long-term AI leadership and strong market position keep investors interested on dips.
✅ Conclusion
NVIDIA is testing a critical downtrend line after weak earnings triggered a pullback. A confirmed breakout could reignite the bullish trend, but failure and a break below 141.40/139.44 opens the way toward deeper supports at 130.84.
⚠️ Disclaimer
This analysis is for educational purposes only and does not constitute financial, investment, or trading advice.
NVDA gravity is strong....$140NVDA is heading towards the death cross (SMA200) and doesn't seem like much will change that at this point. The economy is doing horribly, despite a few small wins. Even the lower interest rate (25/50 basis points) is too little too late, when most of the S&P is already trading below 200SMA. There is a massive overheating of AI Tech stocks that are highly concentrated, and a massive correction is coming. Follow CAPE and PE ratios historically, this time won't be different! Best of luck....

$NVDA: Wave PropertiesResearch Series
Documenting regularities:
Half-way through bullish phase draws distinctive pattern (stops there, corrects a while, and tackles the direction in refreshed state)
After heavy drops it scales out in distinctive way
When stretched - also fits its internal cadence
Alternative scenario with similar scaling laws
Lowered fractal patterns to emphasize on cycles only (temporal aspect)

AI GAIN Act: A Shot in the Foot for the Chip Industry?By Ion Jauregui – Analyst at ActivTrades
The debate over Western leadership in artificial intelligence once again centers on Washington. The new AI GAIN Act, integrated as part of the National Defense Authorization Act (NDAA), establishes that any chip with performance above 4,800 TOPS will require an export license. The measure also stipulates that semiconductor manufacturers must prioritize deliveries to U.S. companies before exporting advanced chips abroad. Framed as a strategy to reinforce national security and curb China, the legislation has sparked alarm across the industry. In short: if U.S. companies are waiting for chips, China and other countries move to the back of the line.
Nvidia raises the alarm
Nvidia (NASDAQ: NVDA.O), the undisputed leader in GPUs for AI, has warned that the law would stifle global competitiveness and slow innovation in artificial intelligence. According to the company, there is currently no domestic supply shortage that justifies restricting access for foreign clients. The criticism recalls the controversial AI Diffusion Rule, pushed by the Biden administration in early 2025 and eventually revoked before coming into force. At the time, restrictions also aimed to control the export of chips and AI models but were discarded for being excessively rigid.
Impact on the semiconductor sector
The reach of the AI GAIN Act goes beyond Nvidia:
• AMD, with its growing exposure to AI accelerators, faces similar risks in its international operations.
• Intel, with a stronger domestic presence, may be less affected, as its profile aligns with the strategic goal of boosting local production.
• Broadcom and Qualcomm, highly dependent on global client networks, would face tighter constraints on commercial flexibility.
The most likely outcome is a double-edged sword: ensuring the U.S. always has priority in the supply chain, but at the cost of undermining the global business model that sustains sector margins. In short: the risk is that the cure ends up being worse than the disease, slowing global competition.
Technical analysis of Nvidia
Nvidia’s stock remains close to record highs after holding above USD 164 yesterday and closing at USD 168.31. Price action shows the loss of the 50-day moving average and movement toward the 100-day. A clear trend reversal has not yet materialized, even though the RSI is in oversold territory at 39.44, while the MACD is shifting into negative territory, crossing into the lower part of the histogram.
Another relevant factor is a price bell that has moved strongly between USD 152.89 and USD 126.84, with its Point of Control (POC) around USD 138.17, slightly below the accumulation zone that fueled the rally to all-time highs. The ActivTrades US Market Pulse currently signals Extreme Risk-On conditions in U.S. markets, highlighting a phase of exuberance on Wall Street where macro or geopolitical risks seem ignored. This new law could act as a catalyst for sector pullbacks.
If the current support at USD 164.58 and the next level at USD 152.89 fail, a return to the POC would be likely. On the other hand, if prices hold and consolidate, a new rally toward highs is possible. Such regulatory moves can trigger trend shifts, but if the market absorbs them, upside momentum could resume. From a wave structure perspective, bullish waves remain intact, suggesting this may be only a temporary pause.
• Resistances: All-time high at USD 184.48
• Supports: 164.58, 152.89, and POC at 138.17
• Indicators: RSI at 39.44, signaling oversold and potential consolidation
• MACD: Negative territory
• Moving averages (50/100/200): No trend change yet, though the 50-day is approaching the 100-day
• ActivTrades US Market Pulse: Extreme Risk-On
Conclusion: Trump vs. AI
The Trump administration’s protectionist measures aim to secure national access to silicon and reduce dependence on foreign suppliers, in order to safeguard U.S. leadership in AI. However, Nvidia’s warnings—echoed by the broader sector—underscore fears that overregulation could erode the international competitiveness of American tech giants, especially against China and other emerging innovation hubs. In this race for AI dominance, building walls may end up slowing down your own runners.
*******************************************************************************************
The information provided does not constitute investment research. The material has not been prepared in accordance with the legal requirements designed to promote the independence of investment research and such should be considered a marketing communication.
All information has been prepared by ActivTrades ("AT"). The information does not contain a record of AT's prices, or an offer of or solicitation for a transaction in any financial instrument. No representation or warranty is given as to the accuracy or completeness of this information.
Any material provided does not have regard to the specific investment objective and financial situation of any person who may receive it. Past performance and forecasting are not a synonym of a reliable indicator of future performance. AT provides an execution-only service. Consequently, any person acting on the information provided does so at their own risk. Political risk is unpredictable. Central bank actions can vary. Platform tools do not guarantee success.

NVDA Support and Resistance Lines Valid from July 1 to 31st 2025Overview:
These purple lines act as Support and resistance lines when the price moves into these lines from the bottom or the top direction. Based on the direction of the price movement, one can take long or short entries.
Trading Timeframes
I usually use 30min candlesticks to swing trade options by holding 2-3 days max. Anyone can also use 3hr or 4hrs to do 2 weeks max swing trades for massive up or down movements.
I post these 1st week of every month and they are valid till the end of the month.
