Crazy or Optimistic?We've followed an upward channel since 2022. Since then, we have created HLs & HHs.
I see a price prediction of $550 to $600 by the end of the year, and +$700 by July 2026.
Let me know your thoughts.
TL0 trade ideas

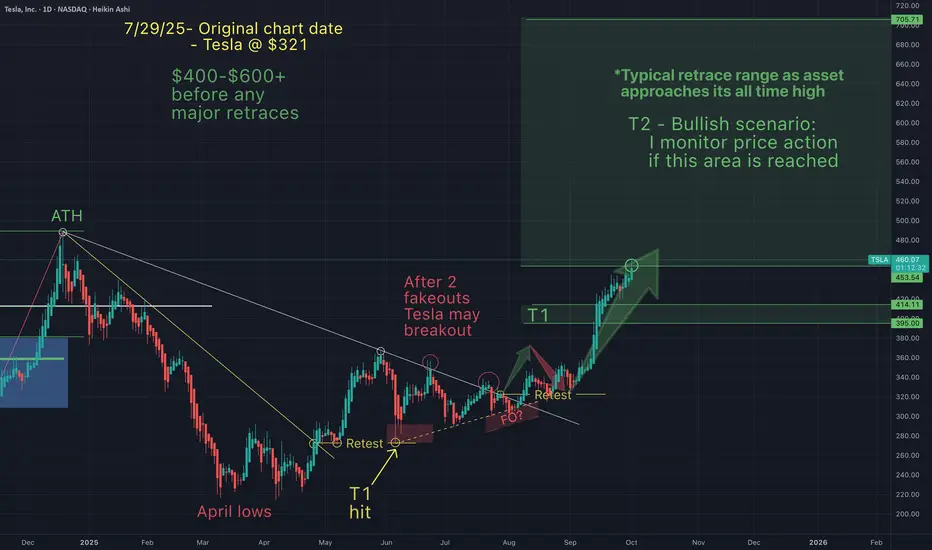
Tesla - NEW ALL TIME HIGH INCOMING (small pullback first?)On July 29th Tesla was around $320 and I suggested that after a long downtrend, Tesla would breakout, retest and continue up ("without any major retraces)", to between $400-$600.
Tesla has now hit my T2 (currently $460) and I am anticipating a small retest before new all time highs in the near term.
Congrats to all of you who have made gains from my charts.
May the trends (continue) to be with you.
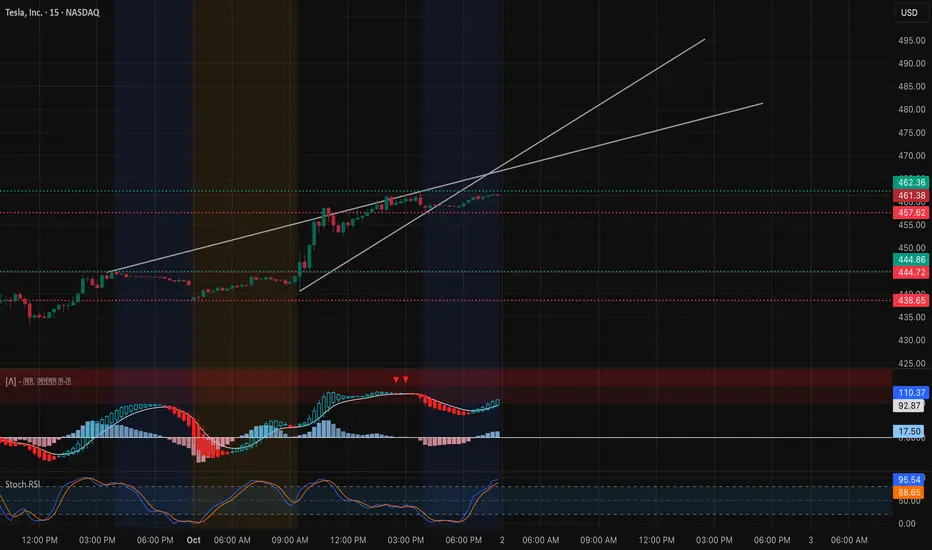
TSLA Testing $462 – Gamma Ceiling or Breakout? (Oct 2)Intraday (15-Min Chart)
Tesla has pushed strongly into the $461–$462 zone, where sellers are starting to show up. On the 15-min chart, price is hugging the upper trendline of the short-term channel. Momentum is extended, but both MACD and Stoch RSI suggest buyers are still pressing their advantage.
* Support levels: $457.5 (near-term pivot) and $452 (channel base).
* Upside trigger: If bulls clear $462.5 with conviction, next upside targets open toward 465–468 intraday.
* Downside risk: Failure to hold $457 risks a pullback to 452–445, where dip-buyers may look to reload.
Bias intraday stays bullish above 457, but stretched oscillators warn of potential rejection if $462 caps the move too strongly.
Options / GEX (1-Hour Chart)
Gamma exposure provides a clear map of where TSLA could move next.
* Call walls: Heavy concentrations sit at 465–470, with $470 acting as the largest resistance zone (gamma ceiling).
* Put walls: Anchored around 432–425, setting downside boundaries.
* Sentiment: Call flow dominates (≈74% bullish options positioning), aligning with recent price momentum.
This paints a classic setup: TSLA is coiling directly beneath the $470 gamma wall. A breakout through 470 could trigger a gamma squeeze toward 475–480, but repeated rejections here trap longs and drag price back into mid-450s.
My Thoughts
For Oct 2, TSLA is at an inflection. I’d favor scalps on dips above $457 targeting 465+ with stops tight under $452. For options traders, a 465–470 call spread lines up well with the gamma map, offering defined risk into resistance. Conversely, if $457 fails, short-term puts targeting 445–448 provide hedge coverage.
Bias: Bullish above 457, but watching $470 as the true breakout line that decides whether momentum continues or stalls.
TSLA – Watching for Wave 3 Extension Toward 455–460 Zone Tesla (TSLA) is completing a contracting triangle (ABCDE) as wave (iv), setting up for a potential wave (v) of 3. With delivery numbers scheduled for Thursday, momentum could build into the report, creating a rally toward the 455–460 zone, which also aligns with channel resistance and the 1.618 extension. This would complete a ABCD harmonic pattern.

Is the wait over?Time to rise and shine off the couch? Cup and handle will hopefully be complete soon.
Preferably want to see the price above 370 for it to be valid.
But already at 340 it’s a mini buy signal.
We’ll see what the future brings us.
☀️🫶
Tesla's New Range. Hello I am the Cafe Trader.
Today we are revisiting Tesla (TSLA).
Last article we identified the Key seller before this big extension. Today I have identified the last key seller, and how you can capitalize.
Price has now entered into the Light Supply Zone , a place where sellers will try to slow things down.
It is likely that you will want to play TSLA at the Extremes. Strong Supply , and Strong Demand levels are going to give you the best chance at a stronger reaction. So if you are playing the short term, These two plays marked on the chart will be your best bet.
If the Strong Buyers hold at around 417, This will put a lot of pressure on that last strong seller at 461. A push through them should see you ATH's (not without a strong reaction from the Strong Supply first).
Missed out on the move and want to add TSLA to your long term?
Long Term
These Prices should match your conviction on TSLA:
Aggressive : 409 - 419.50 (Top of Demand, even better if you get into those strong buyers)
Value : 333-344
Extreme Value : 288-294 or the Conservative Trendline.
Expect big things from TSLA in the coming years. I would not be surprised to see TSLA reach over 1,000 again.
Happy Trading,
@thecafetrader

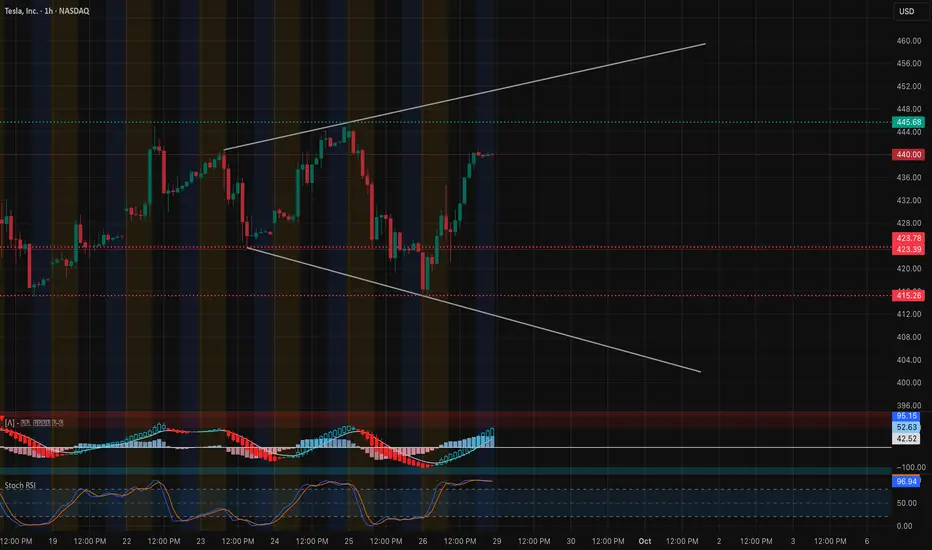
TSLA – Bulls Eye a Breakout While Gamma Maps the Path 🚀 1-Hour Technical Outlook
Tesla is pressing the upper boundary of a rising wedge that’s been developing since mid-September. Friday’s strong bounce off the $415–$420 demand zone reclaimed key hourly EMAs and has price rotating around $440. The MACD histogram just flipped positive and the Stoch RSI is still rising—momentum favors the bulls in the near term.
Key resistance sits at $445.7 (recent swing high) and the wedge top near $448–$450. A sustained hourly close above $450 would invalidate the wedge’s bearish bias and open room toward $455 and $460. On the downside, first support is $432–$430, then $423 and the critical $415 zone.
2-Gamma Exposure (GEX) Confirmation
Today’s GEX map backs the bullish case:
* Largest Call Wall / Max positive GEX is concentrated at $450 (≈73% call concentration).
* Next meaningful upside GEX cluster is $455 with ≈19% call flow.
* Put support is layered at $430 / $425 where negative gamma thins out.
This tells us market-makers will hedge by buying if price pushes above $450, amplifying a breakout. Conversely, a drop through $430 could accelerate hedging pressure lower.
3-Trade Ideas & Option Plays for This Week
* Aggressive Bullish Play: Hourly close above $445.7 and strong volume → Consider short-dated 0DTE/2DTE calls targeting $450–$455. Stop-loss below $440.
* Measured Bullish Play: Wait for clean breakout over $450 → 1-week 450 or 455 calls, or debit spreads like 445/455 to reduce premium.
* Protective Hedge: If TSLA loses $430 with momentum, quick puts to $425/$420 can work as insurance.
With IVR at ~25 and IVx near 64, premiums are not overly inflated, offering a decent risk/reward window for spreads.
My Take
TSLA is in a constructive hourly up-move that can quickly accelerate if $450 flips to support. Gamma positioning and fresh momentum give the bulls an edge, but the wedge pattern warns that a fake-out is possible. Keep stops tight and respect $430 as the line in the sand.
Disclaimer: This analysis is for educational purposes only and does not constitute financial advice. Always do your own research and manage risk before trading.
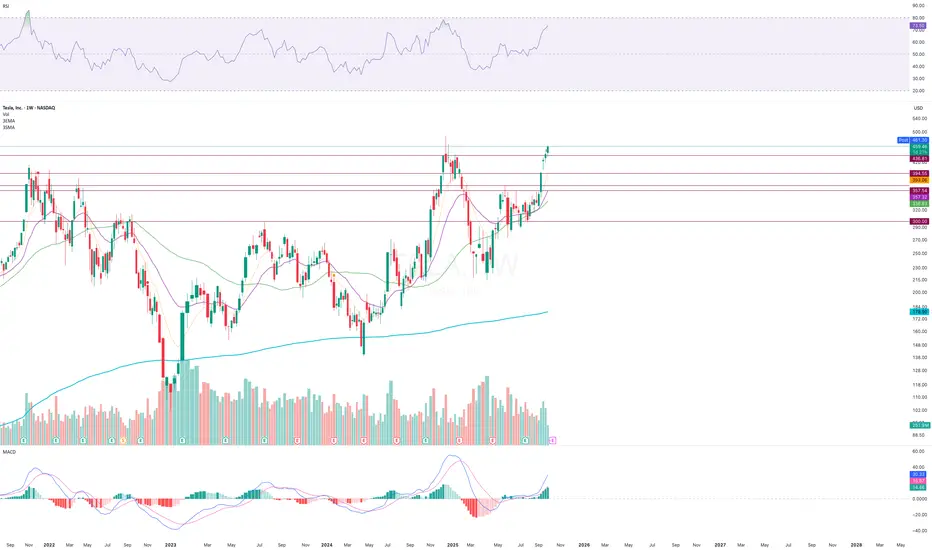
$TSLA: Let The Rally Speak For Itself - 9/16/2025Based on the analysis, it’s confirmed that NASDAQ:TSLA has initiated a new rally following the completion of a lengthy and complex corrective structure at $288.
The stock bounced twice off the 50-week moving average, signaling strong support as the correction neared its end.
Due to the depth and complexity of the structure, Wave 3 is expected to unfold with high momentum, potentially delivering an explosive rally. Key upside targets are displayed in the chart — we’ll be watching closely to see how price reacts at those levels.
📚 Note: The internal structure and labeling were intentionally left visible in the chart for educational purposes. This is especially useful for traders interested in Modern Trading Algorithms and their structural variations.
Happy Trading, and let the rally speak for itself. 🚀

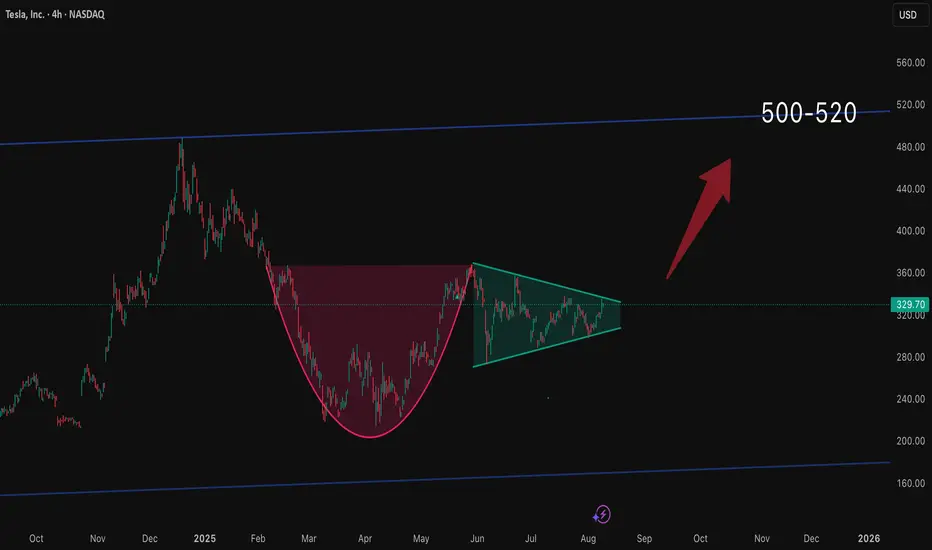
Tesla - Here we goooooo!🚗Tesla ( NASDAQ:TSLA ) is finally breaking out:
🔎Analysis summary:
Finally, after a consolidation of four years, Tesla is attempting another all time high breakout. With the bullish triangle coming to an end, bulls are dominating this stock. It just comes down to the next couple of months but a triangle breakout remains far more likely.
📝Levels to watch:
$400
SwingTraderPhil
SwingTrading.Simplified. | Investing.Simplified. | #LONGTERMVISION

$TSLA Fake out Cleared out my Calls this morning in the spike before the drop. Now downside is looking good. Waiting for a quick bounce before jumping in possibly. NASDAQ:TSLA

TSLA eyes on $409.56: Golden Genesis fib to hold "High Ground"TSLA has been surging based on various news.
Now retracing towards a Genesis fib at $409.56
Clean bounce would indicate very strong trend.
Golden Genesis fibs are important milestones.
High gravity fibs can capture price into orbit.
Expect consolidation around it then sling shot.
.
Previous analysis that caught a PERFECT BOTTOM:
Hit BOOST and FOLLOW for more such PRECISE and TIMELY charts.
========================================================
.

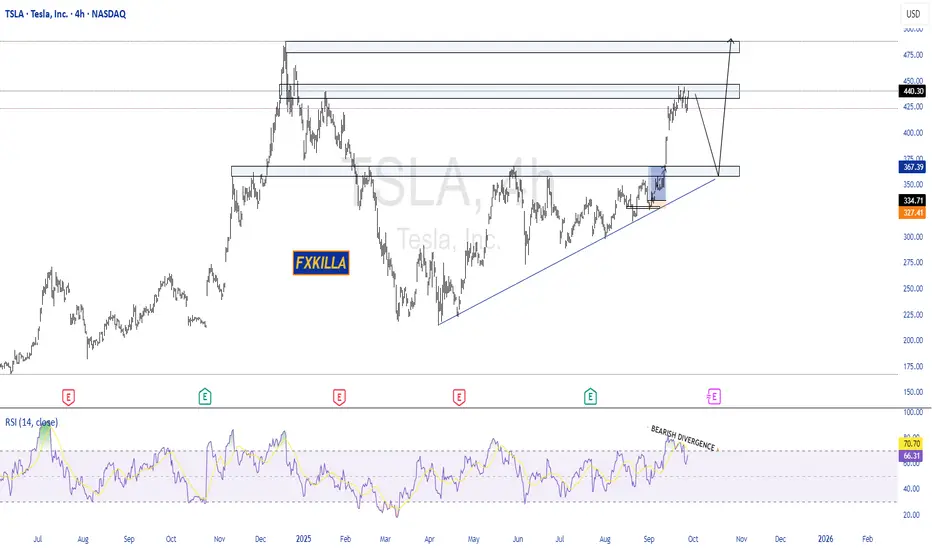
TESLA HIGH PROBABILITY SETUPS SOON!!!🚨 TESLA HIGH PROBABILITY SETUPS 🚨
* Here We Can See The Next Potential Moves For TSLA Coming Hours/Days.
* Keep Your Eyes Close On Your Trading Positions.
* Happy PIP Hunting Traders.
FXKILLA.
TSLA TeslaToday’s session printed a dark candle with heavy pressure and big price action — not the best look from a candlestick perspective. The immediate support sits at the uptrend line near 433. If price can hold that level tomorrow, the uptrend remains intact. But if we get a decisive close below, expect a sharper drop. First downside target would be 405, and if that fails, we could see an extension toward 370–360, lining up with the previous lower uptrend line. Tomorrow’s price action at that 433 support is critical — watch it closely. follow me on X Enginv777

TSLA testInvestment Strategy: Rebalances quarterly to maintain exposure to high-momentum stocks while capping individual holdings at ~5% to manage risk. This factor-based approach aims to outperform the broader S&P 500 over the long term by riding momentum wav
$TSLA to $5,000 #CathiesBack!!! #Bullflag #AlwaysHasBeenSome Bull #corn for the PermaBulls out there after this V recoVery on Indices...
Just some log scale mathematical measurements from one flagpole to the next...
#AnythingIsPossible if Physics allows... Tesla at 5k is simply tesla at 5Trillion valuation... once self driving fulfilled? Odds increasing with GPU/AI capabilities...
NASDAQ:NVDA should be a major green light for the next leg up in markets or rejection... definitely leaning bullish still after V , dips to be bought in this environment...

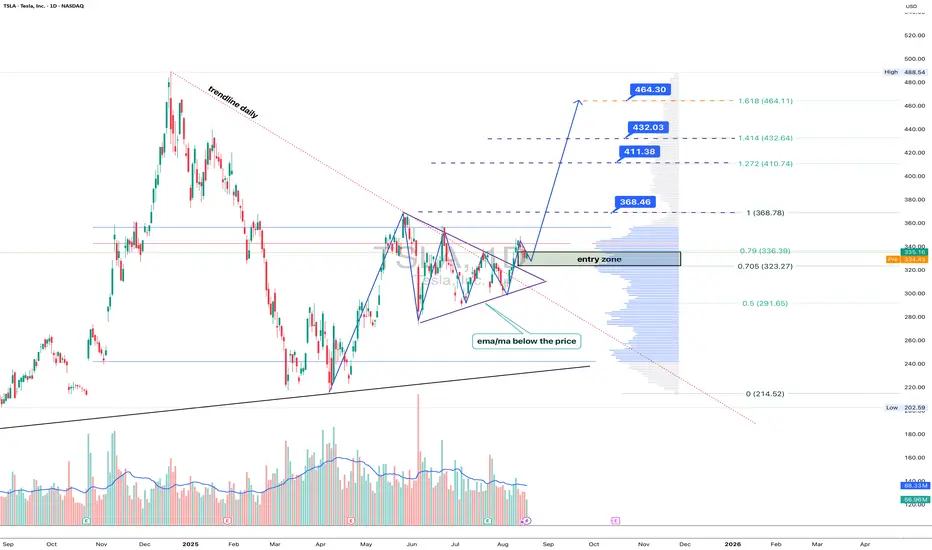
Tesla: breakout mode, Elon’s rocket fuel for the chartTechnically , Tesla broke out of a symmetrical triangle while holding above EMA/MA supports, which confirms bullish control. The breakout unlocks targets at 368.46 (Fibo 1), followed by 411.38, 432.03, and the 1.618 extension at 464.30. Volume profile confirms strong accumulation below, leaving the upside path less crowded.
Fundamentally , Tesla keeps investor attention alive. EV sales stabilized, but the focus has shifted to AI and robotaxi — Musk’s latest promises of disruption. With Fed rates peaking and yields easing, growth stocks regain momentum. Risks remain from Chinese competitors, yet Tesla’s margins are still leading the industry.
Tactical plan : entry zone stands at 323–336. As long as price holds above it, buyers target 368.46 → 411.38 → 464.30. A break below 323 would flip the bias back toward 291.
Bottom line: Tesla’s chart looks ready for lift-off. Musk might be dreaming of Mars, but for now, bulls are happy if he just launches the stock a few hundred dollars higher.
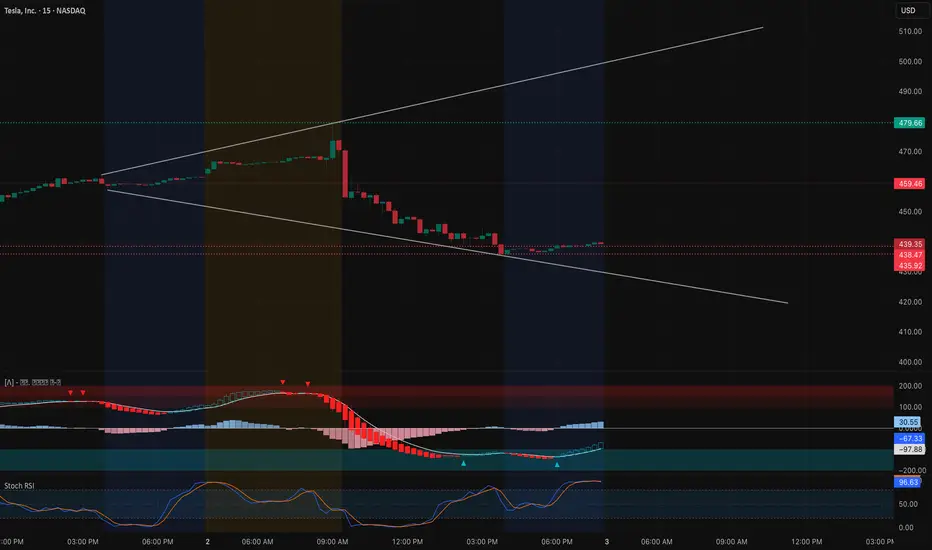
TSLA At a Crossroads: Bounce or Breakdown for Oct 3? Intraday Technical Outlook (15m Chart)
Tesla (TSLA) saw a sharp selloff, sliding from the mid-$470s to close near $439.35. On the 15-minute chart, the structure is now hugging a descending support line:
* MACD: Still deep in bearish territory but showing early signs of momentum cooling as histogram bars lighten.
* Stoch RSI: Reset from extreme oversold levels, suggesting potential for a relief bounce.
* Key Levels: Immediate support rests around $435–432, with a breakdown exposing $425–420. On the upside, first resistance is $445, followed by a more critical level at $452.5.
Intraday takeaway: Short-term traders should watch if TSLA holds above $435. A sustained bounce can spark a retrace to $445–452, while failure risks another leg lower toward $425.
Options Sentiment & GEX Outlook (1H Chart)
The 1-hour GEX map paints a decisive risk zone for tomorrow’s trade:
* Gamma Walls:
* $452.5–460: Strong call resistance cluster, where sellers likely re-emerge.
* $439.5: Key gamma pivot — trading below this opens up bearish flows.
* $432 / $425 / $420: Heavy put walls acting as magnets if weakness persists.
* Implications:
* Holding above $439.5 can squeeze shorts toward $445–452.5, offering upside for quick calls.
* Losing $435 confirms dealer hedging pressure lower, opening room to $425–420, favoring puts.
* Volatility Context: IVR at 26.9 vs IVx avg 65.2 shows premiums are mid-range but still elevated. This means intraday traders may prefer spreads over outright calls/puts to balance risk/reward.
My Thoughts & Recommendation
For Oct 3 trading, Tesla is sitting right at a critical gamma pivot.
* Intraday (scalping/trading): Look for a bounce play off $435, with upside targets at $445–452 if momentum aligns. A breakdown below $432 favors continuation toward $425–420.
* Options trading (swing/0DTE): Call positions only make sense above $439.5, with tight stops and targets capped near $452. Put strategies (vertical spreads or debit puts) look stronger if price fails at $439.5 and rolls back toward $425.
Bias heading into Oct 3: Cautiously bearish unless $439.5 is reclaimed with volume.
Disclaimer:
This analysis is for educational purposes only and does not constitute financial advice. Always conduct your own research and manage risk before trading.
Tesla (TSLA) Share Price Rises Ahead of Earnings ReportTesla (TSLA) Share Price Rises Ahead of Earnings Report
On 16 September, we noted signs of a strong market for Tesla (TSLA) shares, including:
→ The price remaining above the psychological level of $400;
→ Reaching the highest levels since late January.
We also identified an ascending channel and suggested that the long-term outlook remained optimistic, although a correction could not be ruled out.
Since then, TSLA shares have stabilised near the upper boundary of the channel, holding above the $400 level. On Friday, they were among the market leaders, rising by more than 4%. This brings the gain since the start of September to around +30%.
Why Are TSLA Shares Rising?
Key factors supporting a bullish outlook include:
→ Sentiment ahead of the quarterly Production and Deliveries report, expected this week. According to recent forecasts, actual figures could exceed expectations (although still showing a decline compared to the previous year).
→ Target price upgrades. Dan Ives of Wedbush, one of Tesla’s most prominent bulls, last week raised his target price to $600 — the highest on Wall Street — citing substantial potential in AI and robotaxi development.
→ The “Musk factor”: Discussions around Elon Musk stepping away from politics are seen as a long-term positive driver.
Technical Analysis of TSLA Shares
The ascending channel remains intact. However, the chart suggests that the upper boundary now acts as resistance — unsurprising given the exceptional gains in September (noting that TSLA’s price has doubled since its yearly low). A slowdown in momentum is signalled by a bearish divergence on the RSI indicator.
Resistance at the upper boundary is further reinforced by a strong bearish reversal from late 2024. A similar pattern was recently observed when the price struggled to break above the bearish reversal zone at $345–355, resulting in an extended sideways movement in August and early September.
By analogy, the $445–465 zone may also act as resistance — meaning a correction remains a plausible scenario. For example, TSLA stock price could pull back to test the psychological $400 level, which is supported by the median of the current channel.
This article represents the opinion of the Companies operating under the FXOpen brand only. It is not to be construed as an offer, solicitation, or recommendation with respect to products and services provided by the Companies operating under the FXOpen brand, nor is it to be considered financial advice.

Long trade Trade Journal Entry
Pair/Asset: TSLA (Tesla Inc.)
Trade Type: Buyside trade
Date: Friday, 26th Sept 2025
Session: London to New York Session AM (11:00 AM)
Trade Details
Entry: 427.51
Profit Level (TP): 465.20 (+8.82%)
Stop Level (SL): 425.82 (-0.40%)
Risk–Reward (RR): 22.3
Technical Narrative
Pre-Trade Context:
The price consolidated above a demand zone at 423–427, which coincided with the origin of a prior order block. Inducement & BOS (Break of Structure) confirmed bullish intent.
Several fair value gaps (FVGs) were present on the climb, supporting bullish continuation.
Entry Justification:
*Entry at 427.51 aligns with the mitigation of the demand zone and FVG fill.
*The structure flipped bullish after the sweep of local lows, setting the stage for an upside liquidity grab.
Target Rationale:
*TP aimed at 465.20, aligning with the previous swing high and liquidity above.
*Clean imbalances left on the rally offer magnets for price.
Risk Management:
Tight SL at 425.82, just below the demand origin to invalidate trade if broken.
Observations & Notes
The accumulation structure within demand was well-formed before the breakout.
Entry captured an early move with FVG alignment + inducement sweep.
Monitor for potential rejection near 448.96 (intermediate resistance) before TP.

Gold extensions10 1 2005 I am really happy with this video because it did so many things that could have been helpful to your trade looking at the market the way we've been looking at it for a long time. The tools that I look at work. The only thing that concerns me is that I told you how you could have made money on gold by shorting it and then when it came back to support you could have made money on gold in both directions and each Direction was nearly 3000,,, so in 2 4-hour periods of time you could have made over $6000..... But I would guess that at the beginning Trader is going to get in trouble with this without some more screen time and observation if your trades at the end of the day when you start doing an analysis from early that day. Actually on today you could have been long then short then long and it looks obvious it is very stressful trading that way. So look at it, get a feel and whenever you do don't over trade it's very important to avoid drawdowns because if you are starting and you try to train hot markets that are going to trade in both directions and you blow it and you get an 8000 drawdown... You will never appreciate the attributes of the market because it's very difficult to get back and trade when you're not prepared for the volatility. And it's very hard psychologically to go long and then go short and vice versa... But the patterns the market. And all the reversals would have minimal drawdowns and none of them would have been touched in this particular Market earlier today.

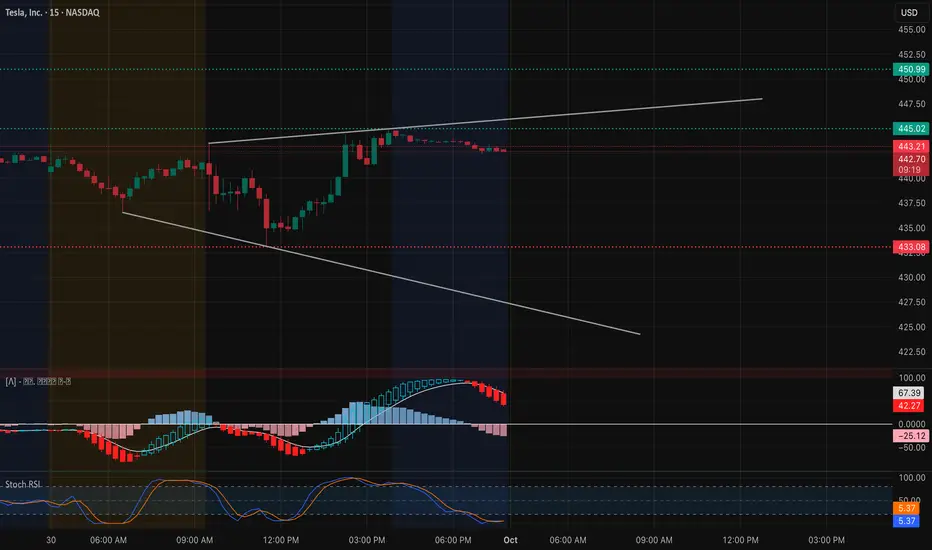
TSLA Oct. 1 – Eyeing the $450 Breakout Zone! 🚀Intraday View (15-Min Chart)
TSLA rebounded sharply intraday and is now consolidating around $443–$444 just under key resistance. Price action has formed a rising channel, but momentum is stalling.
* Support Levels: $442.20, $438.60, $433.08
* Resistance Levels: $445.00, $450.99, $452.50
* Indicators: MACD histogram rolling red, showing fading momentum. Stoch RSI sitting low, suggesting room for a relief bounce.
📌 Intraday Thought (Oct. 1): If $442 holds, expect attempts to push into $445–$450. A breakdown below $442 could trigger a move back toward $438 and $433. Scalpers can play long near $442 support with tight risk, or fade $450 resistance if tested and rejected.
Options & Swing View (1H + GEX)
Gamma exposure shows critical levels:
* Upside: Heavy call wall at $450–$452.5, with more stacked toward $465–$470.
* Downside: Strong put support near $432–$425, deeper wall at $417.5.
This suggests TSLA is coiling between $432–$450. A breakout over $450 could ignite momentum into $465–$470, while losing $432 risks a slide back to $425.
* Bullish Play (Oct. 1): Calls or debit spreads targeting $450 → $465 if price breaks $445 with volume.
* Bearish Hedge: Puts toward $432 → $425 if $442 breaks down.
* Neutral Play: Iron condor between $432–$452 to capture premium during consolidation.
My Thoughts (Oct. 1)
TSLA is parked right below a heavy $450 gamma wall. If bulls clear $445 and sustain, we could see an explosive push toward $465+. But failure to hold $442 opens the door to retesting $432 quickly. For now, this is a make-or-break level, and I’d keep risk management tight with options plays centered around the $450 breakout.
Disclaimer: This analysis is for educational purposes only and does not constitute financial advice. Always do your own research and manage risk before trading.
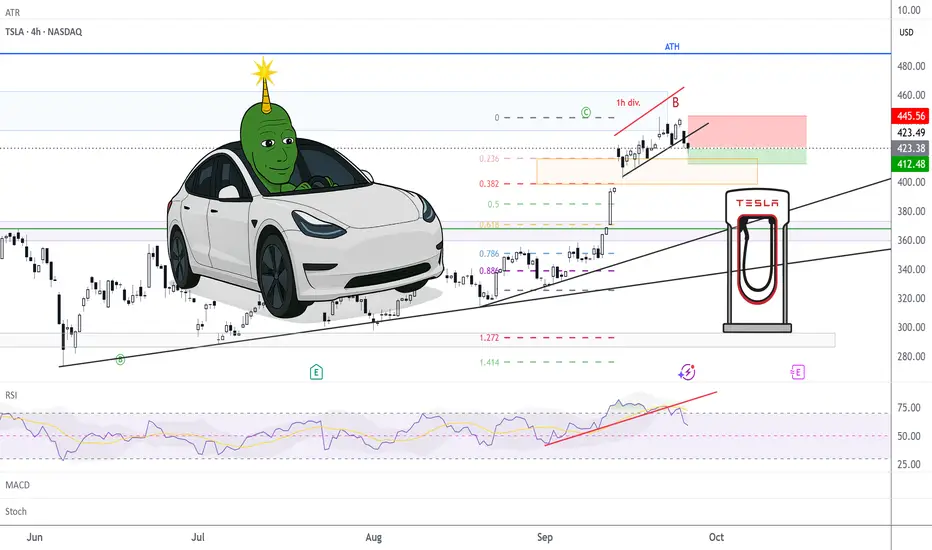
TSLA: Battery Low, Time to Recharge?After reaching the all-time high area again with Elliott Wave C on the daily chart, a downside retracement looks likely. There are still gaps below to be filled, along with key Fibonacci levels yet to be tested. This creates a solid opportunity for a 1 ATR short trade, with the first target set at $412.
On the 1-hour chart, RSI, MACD, and Stochastic oscillators are all showing divergences, suggesting a potential break in the uptrend. The upward trendline has also been broken on the 1-hour timeframe, adding further confirmation for the short setup. On the 4-hour chart, ATR is currently 11, which puts a 2 ATR stop slightly above the recent highs, offering protection for the trade. If this level is invalidated, the short idea is likely premature.
This setup is quite similar to the Oracle move, where price gapped up to all-time highs before retracing:
Disclaimer: This idea is for educational purposes only. Please do not place trades solely based on this setup.
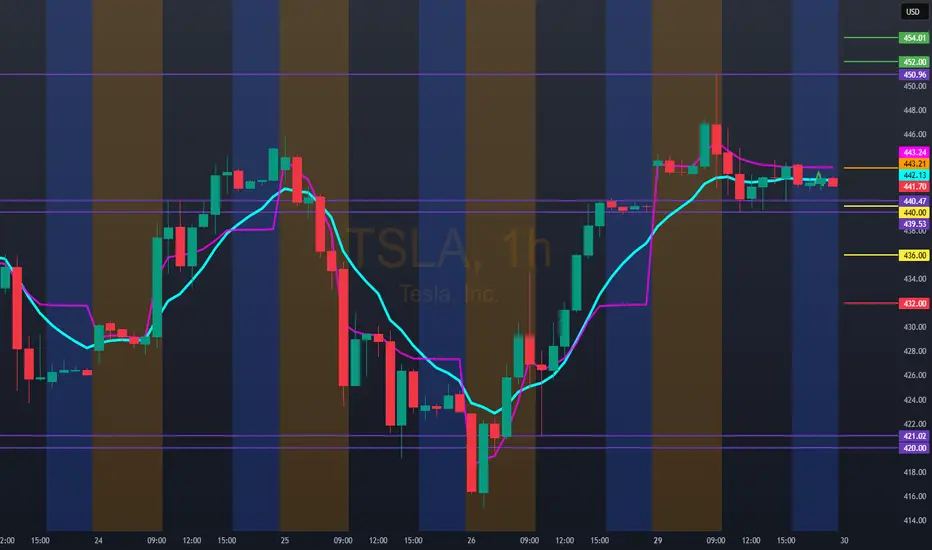
Hello trader, for tomorrow, 9/30/25, TSLA: 443.21Bullish entry above 454.00 with possible upside projection to 488.54, stop below vwap
Bearish entry only below 432.00. We could experiment with a rebound zone at 440.00/436.00, stop above vwap