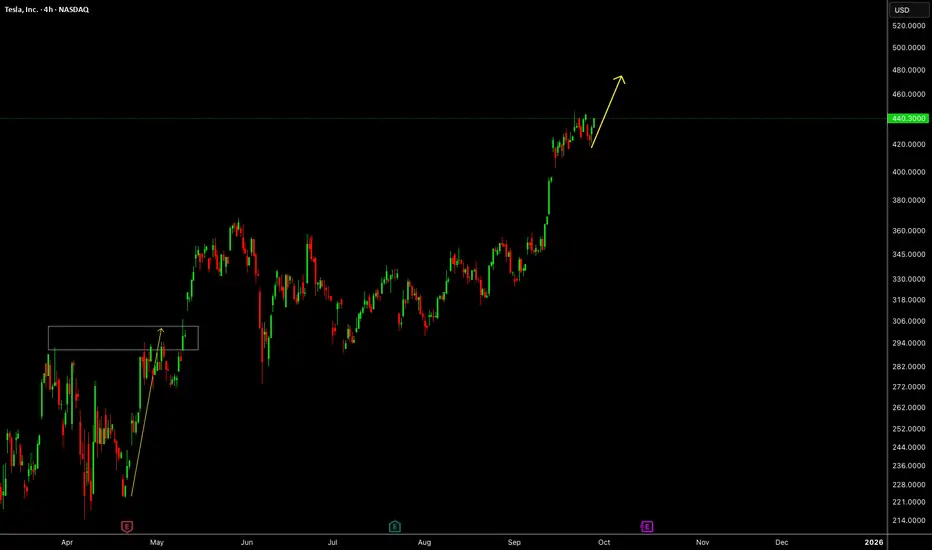
TSLATESLA looks bullish early part of this week, 470+ is the target level.
Disclosure: We are part of Trade Nation's Influencer program and receive a monthly fee for using their TradingView charts in our analysis.
TL0 trade ideas
TESLA: Short Trading Opportunity
TESLA
- Classic bearish formation
- Our team expects pullback
SUGGESTED TRADE:
Swing Trade
Short TESLA
Entry - 440.32
Sl - 443.84
Tp - 432.53
Our Risk - 1%
Start protection of your profits from lower levels
Disclosure: I am part of Trade Nation's Influencer program and receive a monthly fee for using their TradingView charts in my analysis.
❤️ Please, support our work with like & comment! ❤️

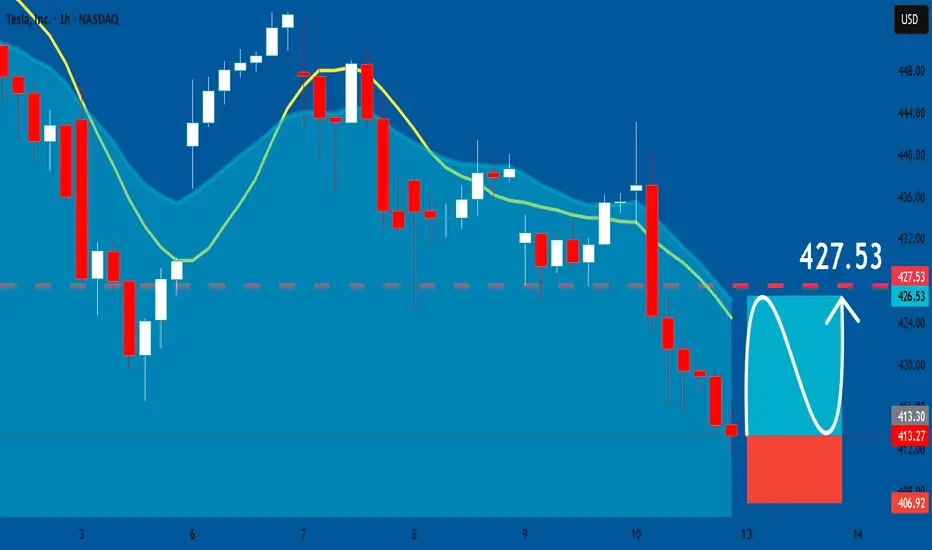
TESLA: Long Signal Explained
TESLA
- Classic bullish formation
- Our team expects pullback
SUGGESTED TRADE:
Swing Trade
Long TESLA
Entry - 413.27
Sl - 406.92
Tp - 427.53
Our Risk - 1%
Start protection of your profits from lower levels
Disclosure: I am part of Trade Nation's Influencer program and receive a monthly fee for using their TradingView charts in my analysis.
❤️ Please, support our work with like & comment! ❤️
Tesla (TSLA) - Weekly Battle Before The BreakoutTicker : NASDAQ:TSLA
Timeframe : Weekly
Bias : Neutral (Awaiting breakout confirmation)
Range : $410 - $470
🧠 MARKET CONTEXT
Tesla is stuck in a wide weekly range as macro uncertainty and earnings expectations collide.
Buyers defend the $410 zone while Sellers keep rejecting $470 - a classic coiling phase before expansion.
🔎 TECHNICAL OVERVIEW
* Structure: Choppy / Distribution phase ( failed breakouts, heavy wicks, indecision )
* Resistance Zone: $465-$475 ( needs clean close above for breakout confirmation )
* Support Zone: $410-$425 ( critical area maintaining bullish structure )
* Major Support Below: $320-$360 ( long term value area where buyers historically stepped in )
📈 SCENARIOS
🟢 Bullish Case:
* Weekly close above $470 with strong volume = breakout signal.
* Targets : $500+ zone, potential retest of 2024 highs.
🔴 Bearish Case:
* Weekly close below $410 = structure break.
* Targets : $360 - $320 zone.
⚪ Neutral / Range Play:
* Between $410 - $470, range strategies work best (fade extremes, tight risk).
🌍 MACRO CONTEXT
* The FED's higher-for-longer stance keeps pressure on growth stocks.
* Q3 deliveries were strong, supporting long term sentiment.
* Competition & margin compression (China & Europe) remain risk factors.
* Tech sector volatility + geopolitical headlines amplify TSLA's swings.
📊 WEEKLY OUTLOOK SUMMARY
* Short Term (2-4 weeks) : range bound between $410-$470 - watch for volume spikes / breakout confirmation.
* Medium Term (1-3 months) : direction depends on Fed & earnings - macro + delivery data key catalysts.
* Long Term (Q1 2026+) : bullish bias intact if fundamentals hold - expect volatility during macro tightening.
💬 FINAL TAKE
Tesla is coiling between $410 and $470. Whichever side breaks first will likely define Q4's direction. Watch weekly closes and volume confirmation - "The Big Move Is Loading"
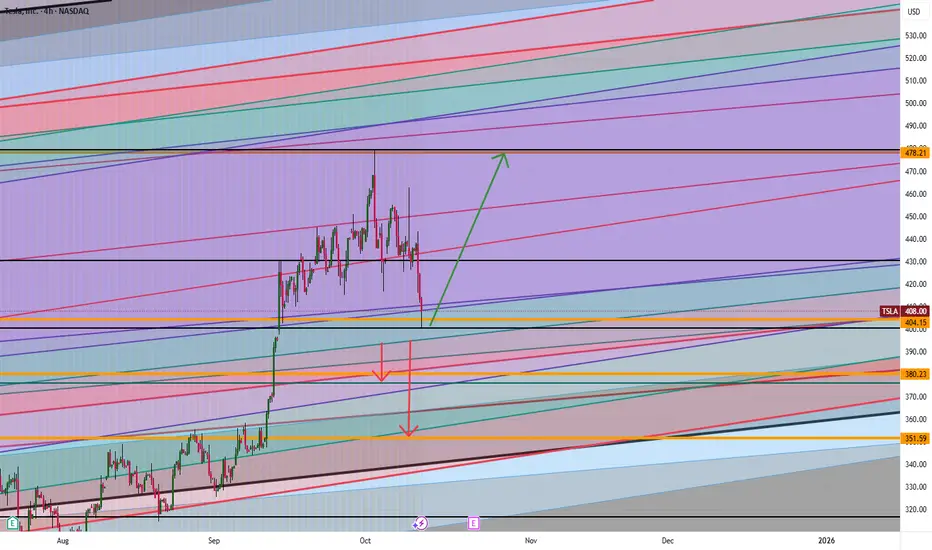
Tesla: Will It Blast Off or Fall Fast? The $404 Level Is the KeyTesla is at a big “make or break” point. If the price stays higher than $404, it could blast up to $437 or maybe even $478. But if Tesla drops below $404, watch out! It could fall down to $380 or even as low as $351.
Think about it:
What would you do if Tesla started moving toward those numbers? Do you think it will go up or will it go down?
If you’re not sure or have a question, send me a message! Sometimes asking one good question can help you make a smarter trade. What do you want to know about Tesla right now?
Mindbloome Exchange
$TSLA Bearish batReached target (0.886 fib level) after breaking out from B point of the pattern. will wait for price to go down further and consolidate.

TSLA Oct. 9 — Bulls Defending $430 Zone, Eyeing Break Above $444Tesla (TSLA) has been forming a constructive base near the $430 zone after reclaiming momentum from its recent dip. On the 15-minute chart, structure shows a clean BOS (Break of Structure) followed by a minor CHoCH around $437–$438 — indicating consolidation before a possible continuation move. The ascending intraday trendline remains intact, and price is currently holding above short-term liquidity levels.
MACD is curling upward again with momentum building, while the Stoch RSI has reset near the mid-zone and looks ready to push higher — signs that a bullish continuation could resume if TSLA maintains above $433.
On the 1-hour chart, the key HVL sits around $425, which also aligns with gamma support. Above, there’s a visible stack of gamma resistance layers between $442.5 and $452.5, topped by a major call wall near $457.5–$460. This range defines the next battleground for directional momentum.
Support and Resistance Levels:
* Immediate Resistance: $441.33 → $444.0
* Major Resistance (Gamma Wall): $452.5 → $457.5
* Immediate Support: $433.09 → $430.0
* Key Support Zone: $425 → $422
GEX & Options Sentiment (1H GEX Chart):
* The highest positive Call Gamma lies between $444–$457.5, suggesting an upside magnet if TSLA maintains strength.
* Strong Put Support sits at $425–$420, reinforcing the bullish floor from the recent rebound.
* IVR is low (27) and Calls dominate at 62%, indicating bullish skew but with room for volatility expansion if breakout volume increases.
* Gamma exposure shows positive slope above $440, meaning dealer hedging could amplify upside moves once that zone clears.
Trade Scenarios:
Bullish Setup:
* Entry: Above $441.5 breakout confirmation
* Target 1: $448
* Target 2: $452.5
* Stop-Loss: Below $432
* Rationale: Holding above $433 with bullish MACD and rising GEX bias confirms continuation toward $450 zone.
Bearish Setup:
* Entry: Below $430 breakdown
* Target 1: $425
* Target 2: $420
* Stop-Loss: Above $435
* Rationale: A failed retest at $438–$440 with divergence could trigger a short-term retrace to retest gamma support.
TSLA is in a critical consolidation phase. A break above $441.5 could trigger a bullish leg toward $450+, while losing $430 could open a short-term fade to $425. Bulls are defending key ground — but watch for volume confirmation before entering.
Disclaimer:
This analysis is for educational purposes only and does not constitute financial advice. Always do your own research and manage your risk before trading.
If anyone needs me to TA any stock, PM me.

TESLA LONGSLooking for price to sell off to price low of 152. If price shows bullish price action after liquidating low ( MSS+ retracement into FVG or ICT Breaker) i will be buying in. Alternative setup would be the same if price decides to sell off to the marked 2023 low.
Initial price targets will be Highs marked at 300$.

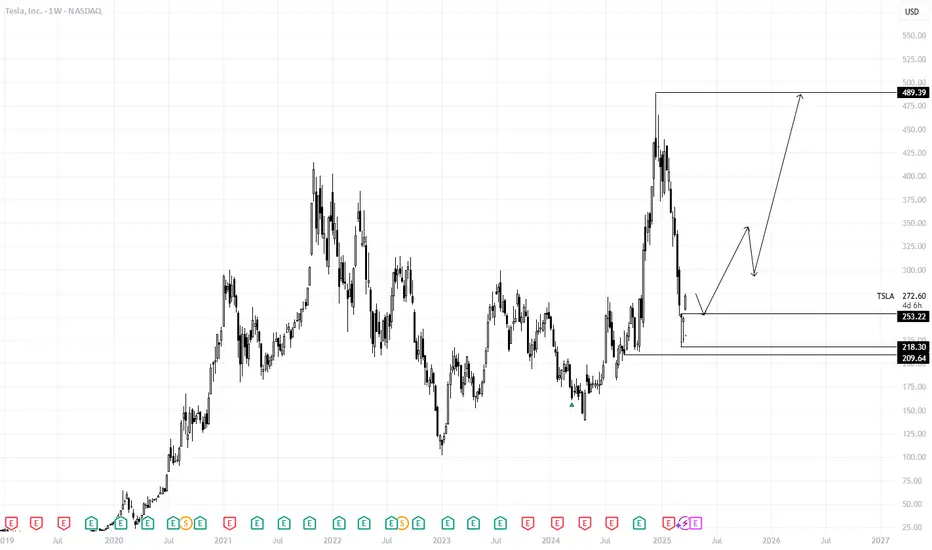
TESLA LONG JHON SILVERSLong on Tesla at these prices. Can see a retracement to 250$. Overall Bullish on Tesla. Worst case scenario we can see a short into sub-220$ region.
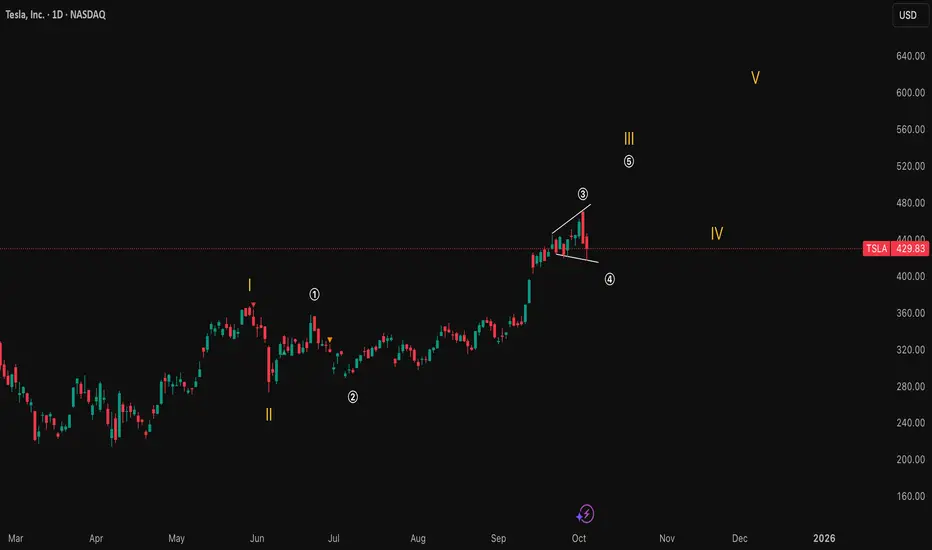
TSLA: A Disciplined MoverHello,
Tesla dances to a disciplined rhythm, and I can't get enough of it.
Target of wave 5 is typically between (570-630)$, and it is a profit-taking zone.
Happy trading.

This happened today TSLA 453.25 Bullish entry above 456.00/460.00 if the open is in this area. If the open is below 452.00, we can expect this to be the 440.00 area with a possible rebound, providing an upside opportunity. If the 440.00 level is lost, we can only enter bearishly below 436.00/432.00 (a possible downside target of 419.00) (a possible upside target of 488.54)
www.tradingview.com

This happened today TSLA 453.25www.tradingview.com
Bullish entry above 456.00/460.00 if the open is in this area. If the open is below 452.00, we can expect this to be the 440.00 area with a possible rebound, providing an upside opportunity. If the 440.00 level is lost, we can only enter bearishly below 436.00/432.00 (a possible downside target of 419.00) (a possible upside target of 488.54)

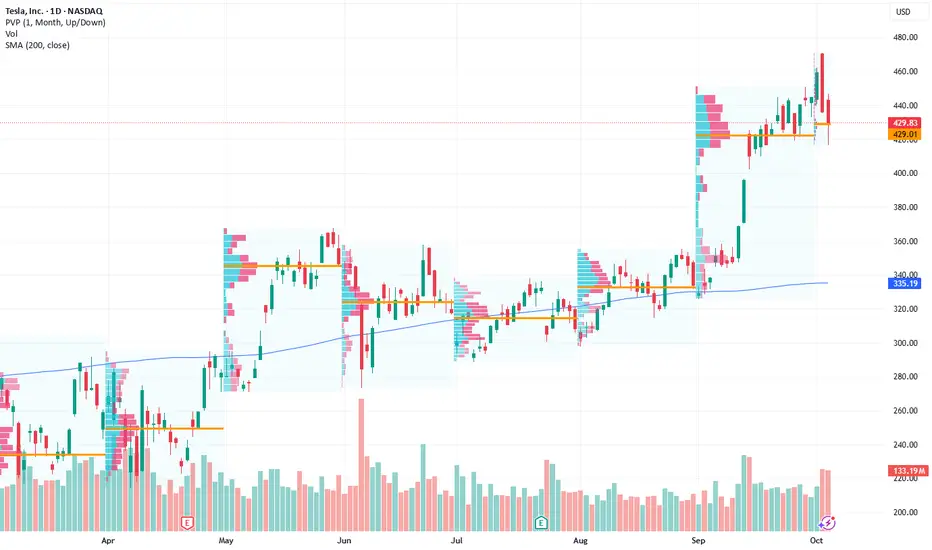
Tesla Approaching Key Resistance: Time to Position for a BreakouCurrent Price: $429.83
Direction: LONG
Targets:
- T1 = $445.50
- T2 = $460.00
Stop Levels:
- S1 = $420.00
- S2 = $410.00
**Wisdom of Professional Traders:**
This analysis synthesizes insights from thousands of professional traders and market experts, leveraging collective intelligence to identify high-probability trade setups. The wisdom of crowds principle suggests that aggregated market perspectives from experienced professionals often outperform individual forecasts, reducing cognitive biases and highlighting consensus opportunities in Tesla.
**Key Insights:**
Tesla continues to dominate the EV (electric vehicle) market with innovations in autonomous driving and battery technology. Analysts are focusing on the recent announcements about significant manufacturing cost reductions and Tesla's newly introduced Cybertruck deliveries, which are expected in Q4 2025. These developments solidify its position as a leader and provide a catalyst for improving margins. Furthermore, the continued expansion into the energy storage market will diversify revenue streams, offering resilience to economic variations.
From a technical perspective, Tesla is approaching a critical resistance level near $435. If broken, this level could trigger a significant upward momentum as bullish sentiment builds. The recent holding of support above $420 suggests strong institutional confidence in Tesla’s upward potential.
**Recent Performance:**
Tesla’s stock has risen approximately 15% over the last three months, recovering from a dip earlier this year when macroeconomic uncertainty temporarily pressured high-growth tech firms. The stock has shown consistent strength as it rebounded from the $380 level after weaker-than-expected Q2 earnings but has since been buoyed by a positive outlook for Q4. Tesla has seen increased volume in recent weeks, signaling growing trader attention.
**Expert Analysis:**
Many equity analysts remain bullish on Tesla's mid-term trajectory. The company’s recent Q3 earnings report (released last month) revealed impressive year-over-year growth in energy division revenues, while automotive gross margins remained steady despite pricing pressures in China. Technical strategists view the current consolidation just below $435 as preparation for the next leg upwards. Tesla's RSI (Relative Strength Index) remains below overbought levels, leaving room for additional bullish momentum.
**News Impact:**
The announcement of Tesla's advancements in Full Self-Driving (FSD) technology has renewed market interest. Achieving regulatory approval for autonomous driving in key markets like Europe and the U.S. could dramatically expand Tesla's total addressable market. Meanwhile, Elon Musk’s comments on Tesla’s potential new factory locations have reignited speculation about the company’s growth strategy, fueling optimism among investors.
**Trading Recommendation:**
Given Tesla’s strong fundamentals, positive technical setup, and upside potential, initiating a long position at current levels may lead to substantial gains. Traders should watch for a break above $435, which could pave the way for a move to $445.50 (T1) and possibly $460 (T2). Use stops at $420 (S1) and $410 (S2) to manage downside risk effectively. Tesla's position as a market leader, combined with its technical momentum, makes this an attractive opportunity for the current trading window.
Do you want to save hours every week? Register for the free weekly update in your language!
TSLA - False breakout?TSLA back in the april channel.
In this market everything is anchored from low of April I feel and I have drawn a vwap band from the April lows which spans from 316-333 which can be the next bounce zone in case price pulls back , this is where TSLA made base before the next leg up.
Most likely price may revisit $400 area to gap fill and also has a anchored vwap from last swing low around 405.
So far seems like a false breakout from the channel and volume has really picked up to the downside in recent days. New base can be formed around 400 mark if thing stabalize for next leg up in coming days, lets see as its tsla.
For more chart requests please ping me on X - vickg81.

TSLA: Last chance under $500, $400Nice run up. We're still in a overall bull market, which Tesla has only started becoming a part of.
We could see a gap fill (seen on the daily and weekly chart) at ~$395. Potentially even a retracement to ~$350.
However, we'll eventually see the stock above 600 in the next year or more. Don't know when.... Could ltake more time, but I think the "more affordable" Model Y will be the first catalyst before any Robotaxi revenue comes in.
Strategically it makes sense to release the more affordable EV after the tax credits go away. No other EV manufacturer OR legacy auto company can produce and sell vehicles as cheaply as Tesla without it.
Haters truly will hate it.

wave 4 in a wave 3 I’m predicting this path for Tesla — we’re in wave 4 of a larger wave 3, so it might get a bit volatile before continuing upward toward 500–520 . We’ll see what happens ☀️
"old" news on $TSLA keep recycled ...I draw to establish various trading hypotheses!
bull support: $420
greedy target: $550
--------------------------------------
Tesla news this week centers around record vehicle deliveries spurred by a last-minute rush to claim the $7,500 U.S. EV tax credit before its expiration, surging share prices, and anticipation for the unveiling of Tesla's robotaxi next week. Momentum is strong in some European markets due to Model Y updates, but overall global deliveries and profit margins remain challenged by competition and the end of EV incentives.
### Upcoming Catalyst Events
- Tesla will announce Q3 delivery figures on October 2. The results will set the tone for year-end and investor sentiment.
- The official unveiling of Tesla’s robotaxi is scheduled for October 10, positioned as a major innovation for 2026. Production lines for new affordable models are also expected to be discussed soon.
- Ongoing debates continue about Musk’s trillion-dollar compensation package, to be voted on by shareholders in November.
### Product and Market Developments
- The facelifted Model Y Performance launched in select regions with significant upgrades, but the refreshed model is not yet in the U.S. market.
- Tesla’s next major move involves scaling production of cybercab robotaxis and further advancing self-driving technology amid increasing regulatory scrutiny.
Tesla’s record delivery boost from U.S. incentives may be short-lived as competition and regulatory changes mount, but anticipation for new products and technology keeps shares strong and investors alert for next week’s pivotal announcements.

Did your Furu have this one? #DIAMOND #Island #WhiteBoySummerHighlighted the diamond for clarity in case anyone had doubts ;)
Last post of June, need 1k followers to come back.
200C 7/19 = Free Vacation
- Prophecies


Take a bullish position on Tesla as price action shows upside moCurrent Price: $440.4
Direction: LONG
Targets:
- T1 = $470.5
- T2 = $495.0
Stop Levels:
- S1 = $423.0
- S2 = $410.5
**Wisdom of Professional Traders:**
This analysis synthesizes insights from thousands of professional traders and market experts, leveraging collective intelligence to identify high-probability trade setups. The wisdom of crowds principle suggests that aggregated market perspectives from experienced professionals often outperform individual forecasts, reducing cognitive biases and highlighting consensus opportunities in Tesla.
**Key Insights:**
Tesla has consistently shown resilience in its stock movements, benefiting from broad technological integration, market-leading innovation, and strong consumer demand for its electric vehicles. As we approach Q4 2025, the company has capitalized on expanding production capabilities in key markets, including North America and Europe, which have bolstered its outlook despite economic headwinds. Specifically, Tesla’s recent advancements in AI-driven vehicle automation and energy storage solutions have continued to sustain its competitive edge in emerging industries.
Tesla also remains a key beneficiary of government incentives related to renewable energy transformation and electric vehicle adoption. Institutions are closely monitoring Tesla’s ability to expand its gross profit margins, which could justify the current valuation and enable further upside.
In the coming months, traders anticipate significant M&A activity in the renewable energy sector, a move that could indirectly benefit Tesla’s energy ventures. These factors, combined with its proven ability to scale efficiently, suggest strong potential for further growth in its share price.
**Recent Performance:**
Tesla’s market price has climbed steadily in recent weeks, reaching $440.4 at the close on September 29, 2025. The stock saw a rally earlier in September, driven by positive earnings guidance and favorable macroeconomic conditions. Tesla’s recent ability to break above a key resistance level of $430 confirms a bullish trend and supports the outlook for achieving higher price targets. Notably, trading volume continues to increase following last week’s bullish breakout, underscoring robust investor interest.
**Expert Analysis:**
Experts emphasize Tesla’s technical setup, with key indicators such as the Relative Strength Index (RSI) showing momentum in favor of a continued uptrend. The RSI currently sits at 58, approaching overbought territory but indicating sufficient upside before major resistance constrains the movement. Analysts are also optimistic about Tesla’s expanding margins as long-term megatrends favor electric vehicle adoption and clean energy solutions.
From a technical perspective, Tesla has formed higher lows and higher highs on its daily chart, demonstrating a bullish market structure. The stock’s MACD crossover signal earlier this month supports upward momentum, while the 200-day moving average at $419 signals additional support if a pullback occurs.
**News Impact:**
Recent announcements regarding Tesla’s AI initiatives, including progress in Optimus humanoid robot development, have created a positive narrative about its technological leadership. Additionally, the opening of Tesla’s new gigafactory in Canada, focused on commercial energy storage solutions, is expected to contribute strongly to revenue growth in 2025 and beyond. The broader market’s reaction to these developments has been optimistic, further supporting the bullish sentiment. Furthermore, Tesla’s recent focus on cost control and production efficiency as shared during the Q3 earnings call has been well-received by analysts.
**Trading Recommendation:**
Given Tesla’s bullish price action, market positioning, and favorable macroeconomic environment, this is a strong opportunity for traders to take a long position. The stock’s break above $430 and recent news catalysts provide confidence in the short-term price targets of $470.5 and $495.0. While caution should be maintained due to potential volatility, the clear upward trajectory signals robust buy-side demand. Positioning with appropriate stop-loss levels at $423 and $410.5 ensures risk control, making this set-up appealing to both retail and institutional investors.
Do you want to save hours every week? Register for the free weekly update in your language!
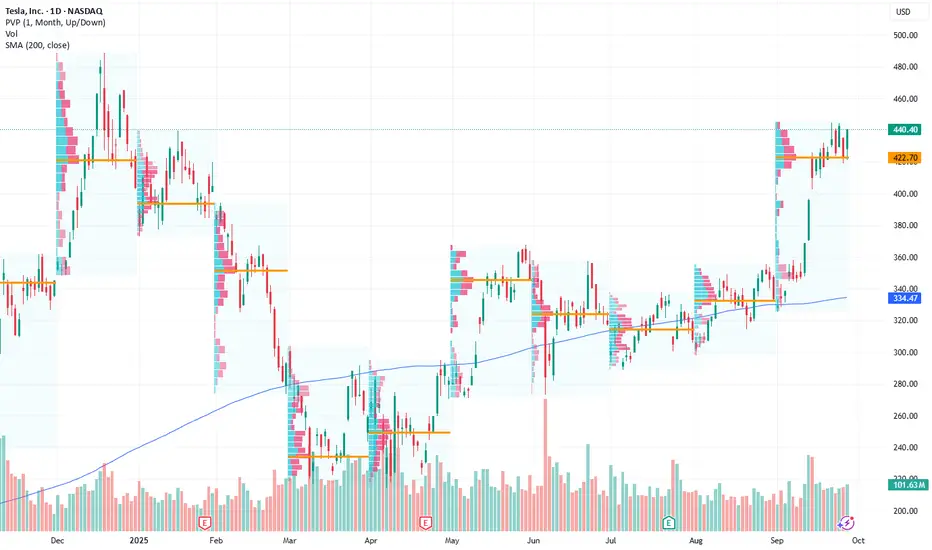
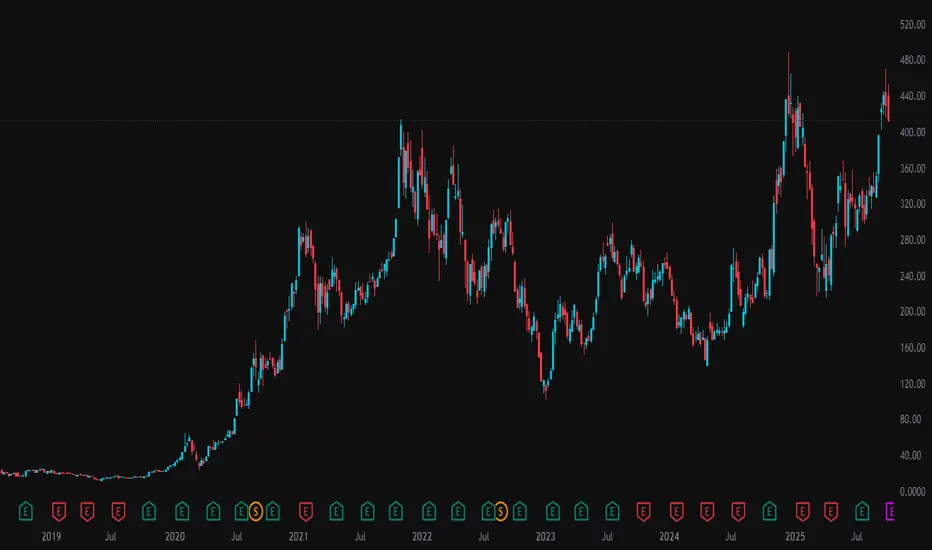
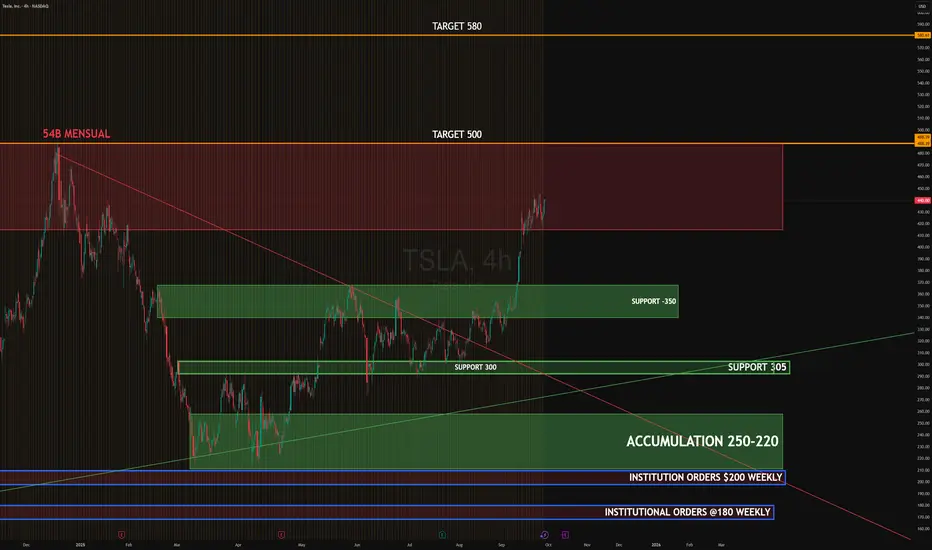
TSLA SEP - OCT 2025TSLA is consolidating below a major supply zone near 450, showing signs of distribution after the recent rally. Strong supports remain at 350 and 305, with a broader accumulation area between 250–220 tied to institutional orders. Price action suggests buyers remain in control unless 350 breaks.
Upside target: 500, with extension to 580 if momentum continues
Downside target: 350, then 305 if pressure builds
#TSLA #globaltrade #investment #investing #stockmarket #wealth #realestate #markets #economy #finance #money #forex #trading #price #business #currency #blockchain #crypto #cryptocurrency #airdrop #btc #ethereum #ico #altcoin #cryptonews #Bitcoin #ipo
Tesla bullish 📊 NASDAQ:TSLA Weekly Chart – Sept 27, 2025
Tesla is pushing higher, now trading at $440.40 (+4.02%), challenging major resistance levels.
🔴 Key Resistance Zones:
$488–$495 → Multi-top rejection zone
$580 → Macro resistance (2021 highs)
Watch for potential rejection unless strong volume confirms breakout
🟢 Strong Support Levels:
$420 / $400 / $390 → Key short-term demand
$332 / $322 → Previous resistance flipped to support
$288 / $259 / $247 → High confluence support cluster
Long-term trendline still intact (white diagonal line)
⚠️ If $488 breaks, TSLA could revisit $580
✅ Holding $420–$400 keeps bulls in control
📉 Below $332 could trigger broader pullback
#TSLA #Tesla #Stocks #Trading #TechnicalAnalysis #Investing #NASDAQ

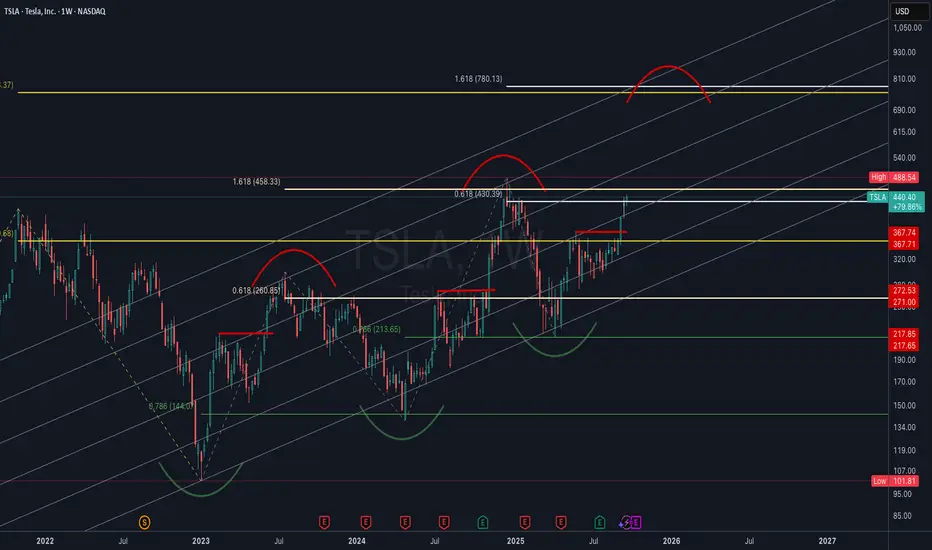
TSLA Weekly | Log Channel Analysis with Fibonacci ConfluenceThis chart presents Tesla (TSLA) on the weekly timeframe, plotted in logarithmic scale using a custom trend channel (not a pitchfork). The analysis combines price structure with key Fibonacci retracement and extension levels to highlight major inflection points in Tesla’s long-term trend.
Channel Structure: The log channel has consistently guided price swings, showing respect for both upper and lower boundaries across multiple cycles. This provides a framework for projecting potential tops and bottoms.
Fibonacci Confluence:
• Price is currently reacting around the 0.618 retracement ($430) from the previous major swing, a historically significant level for Tesla.
• Upside targets align with the 1.618 extensions ($753–$780), creating a strong confluence zone for a potential long-term resistance.
• Key downside supports sit at $367, $272, and $218, each coinciding with fib retracements and historical pivot zones.
Market Structure: The chart highlights repeating rounded top and bottom formations, suggesting cyclical behavior in Tesla’s price action. Rounded bottoms have historically marked accumulation zones, while rounded tops have aligned with distribution phases.
Current Outlook: After reclaiming the mid-channel region and pushing through significant resistance, Tesla is now at a pivotal stage. A confirmed breakout above $488 could open the path toward the higher channel range and eventual fib targets. Failure to hold $430, however, risks a retrace back to $367 or lower channel support.