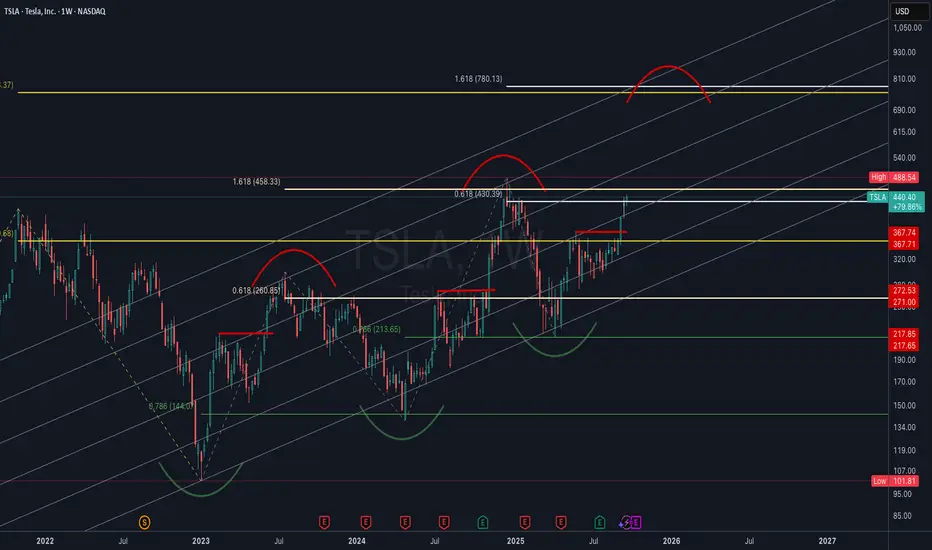
TSLA Weekly | Log Channel Analysis with Fibonacci ConfluenceThis chart presents Tesla (TSLA) on the weekly timeframe, plotted in logarithmic scale using a custom trend channel (not a pitchfork). The analysis combines price structure with key Fibonacci retracement and extension levels to highlight major inflection points in Tesla’s long-term trend.
Channel Structure: The log channel has consistently guided price swings, showing respect for both upper and lower boundaries across multiple cycles. This provides a framework for projecting potential tops and bottoms.
Fibonacci Confluence:
• Price is currently reacting around the 0.618 retracement ($430) from the previous major swing, a historically significant level for Tesla.
• Upside targets align with the 1.618 extensions ($753–$780), creating a strong confluence zone for a potential long-term resistance.
• Key downside supports sit at $367, $272, and $218, each coinciding with fib retracements and historical pivot zones.
Market Structure: The chart highlights repeating rounded top and bottom formations, suggesting cyclical behavior in Tesla’s price action. Rounded bottoms have historically marked accumulation zones, while rounded tops have aligned with distribution phases.
Current Outlook: After reclaiming the mid-channel region and pushing through significant resistance, Tesla is now at a pivotal stage. A confirmed breakout above $488 could open the path toward the higher channel range and eventual fib targets. Failure to hold $430, however, risks a retrace back to $367 or lower channel support.
TL0 trade ideas
I know you dont like me but..but... the whole universe is a huge fractal. Repetition inside a repetition repeated over time. Trading and investing is not far away from philosophy.
Look ar my BTC fractal prediction. its simple on point week by week.
Not an investment advice. Go to meditate.
Elon rules.

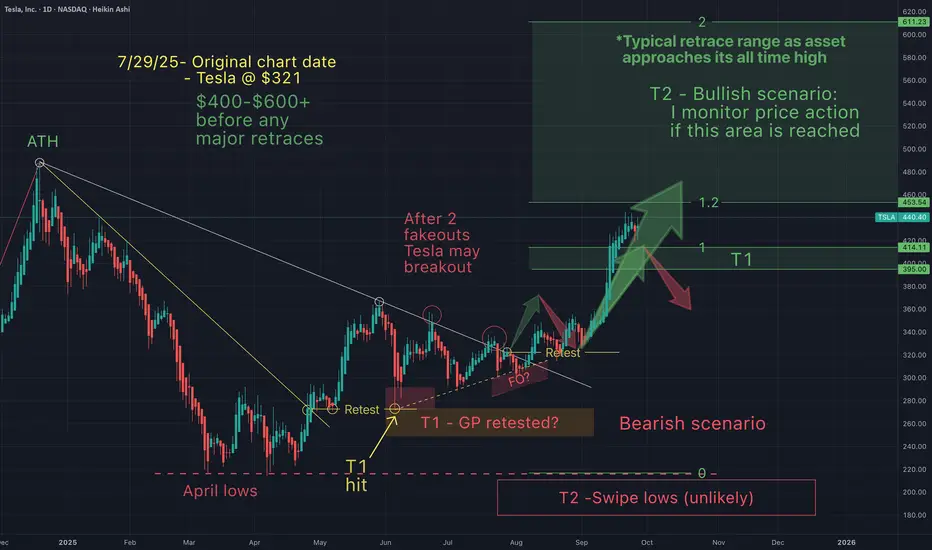
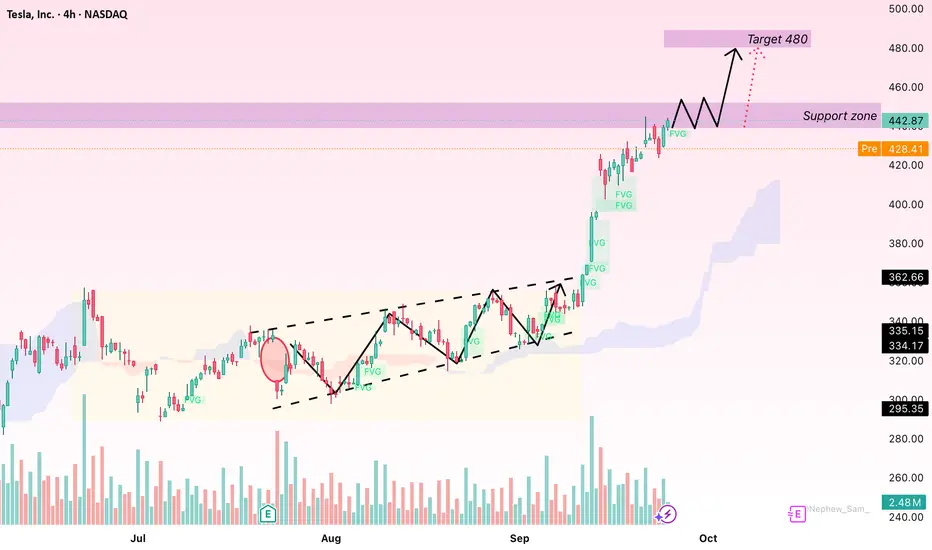
You will ask yourself "how did he know Tesla would do that"?On July 29th Tesla was $321 and I suggested (after a breakout & retest) Tesla would pump straight to low $400s (without any retraces). Now that the trading week has closed here's an update:
Things are still going according to what I expected. But how is this possible...I don't have a crystal ball! How could I have predicted this even *before Elon claimed to have invested 1B into Tesla?
Did Elon know something that we didn't or did I know something you didn't?
Is it the "narative" or the ongoing, repeating, predicable chart patterns?
TA works!
TSLA looking for rejection around 200HMASo, I've been bearish on TSLA around that $400 mark and was waiting for more PA to evolve before calling the shots. It broke down. Quite rapidly actually. Currently looking to see what happens when price floats around that 200HMA in red. Also looking at weekly RSI that broke down the centre of the channel. If RSI on weekly cannot reclaim above centra at 50 and price has a hard time returning above 200HMA, I'll be looking for another leg down on HTF. I'm looking at weekly timeframe here so be mindful about that. I'm fluid. For me, price doesn't have to get a clean rejection for me to make up my mind. Although, that would make life easier, I'll also look at how price behaves around a certain price level. What I mean by that is: I don't care whether the price will go higher than that 200HMA in daily candles. I care about weekly closes and formations around that area.

TESLA Set To Fall! SELL!
My dear friends,
TESLA looks like it will make a good move, and here are the details:
The market is trading on 440.30 pivot level.
Bias - Bearish
Technical Indicators: Supper Trend generates a clear short signal while Pivot Point HL is currently determining the overall Bearish trend of the market.
Goal - 432.72
Recommended Stop Loss - 444.15
About Used Indicators:
Pivot points are a great way to identify areas of support and resistance, but they work best when combined with other kinds of technical analysis
Disclosure: I am part of Trade Nation's Influencer program and receive a monthly fee for using their TradingView charts in my analysis.
———————————
WISH YOU ALL LUCK

TESLA WEEKLY STOCKSTESLA STOCK TO THE moon again ,if we get a pull back into 389-390 zone and stop loss will be 350$ then go long and target 540$ supply roof or more .
nice risk to reward.
#tesla #stocks #shares #bonds

$TSLA: Sierpinski Fibs (RAW)Documenting in interactive the geometry of movements for research purposes to learn how future outcomes deviates in respect to angles from original measurements. Since the periods are vast, the corresponding price axis also spans large magnitudes. This uncovers the long-term confluence points and provides basic texture of systemic behavior.

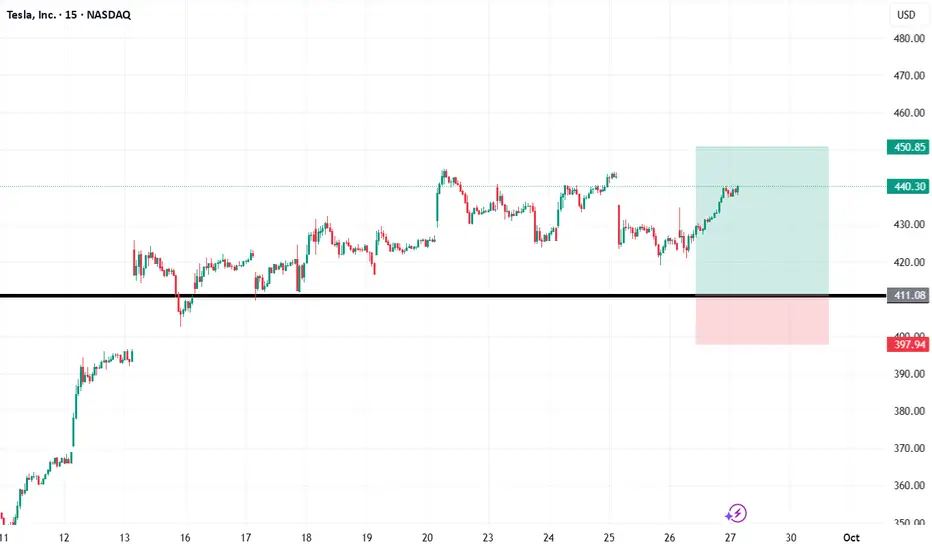
TSLA Long Idea: Testing Key Support at $411Hello, fellow traders,
This is a technical analysis of Tesla (TSLA) on the 15-minute chart. The purpose of this post is to outline a potential trading setup based on price action and key technical levels.
Analysis:
We can observe a clear horizontal support level forming around the $411.00 area. This level has been a significant pivot point in the recent past, with the price showing a strong reaction after testing it. The presence of such a support level suggests a potential area where buying interest may step in, providing a foundation for a possible move higher.
The chart displays a hypothetical long trade setup originating from this support zone, illustrating a practical application of this analysis.
Potential Trade Plan:
Entry: An entry is considered around $411.08, anticipating a bounce from the retest of the established support.
Stop Loss: A stop loss is placed at approximately $397.94. This level is positioned below the support zone and a recent swing low to manage risk should the support level fail to hold.
Take Profit: The profit target is set near $450.85. This level could act as resistance and represents a logical area to take profits.
This setup provides a favorable risk-to-reward ratio of approximately 3:1, which is a key component of a sound risk management strategy.
Disclaimer: This is not financial advice. The information and analysis provided are for educational and informational purposes only. Trading involves significant risk, and you should always conduct your own research and analysis before making any investment decisions. Trade responsibly.
TSLA: Likely to Continue Rising if Holding Above $440Hello everyone,
Today, Tesla (TSLA) shares are trading at $442.87, up 0.77% from the previous close. After a strong rally recently, the market is closely watching whether TSLA can sustain its upward momentum or if a short-term pullback may occur.
The slight retreat in recent sessions mainly stems from profit-taking as the stock approached the $450 mark, creating temporary selling pressure. However, Fair Value Gaps (FVGs) formed during prior rallies are providing important support zones. These levels could serve as potential entry points if the price tests them again.
Trading volume has increased significantly in recent sessions, indicating strong participation from large investors and reflecting long-term confidence in Tesla. As long as the stock holds above the $440 support level, there is a good chance it could rebound to $450 and potentially reach $460 in the coming sessions.
Technical factors such as the Ichimoku cloud structure, combined with support from FVG zones, reinforce the bullish trend. On the macro side, although the Fed maintains a tight monetary policy, current interest rates still provide a favorable environment for tech stocks. Expectations of possible rate cuts in the future are adding further support for TSLA.
In the electric vehicle sector, Tesla continues to lead with production expansion, technology upgrades, and new product launches. News related to these developments often directly impacts the stock price, driving further gains.
Strong inflows from major investors, along with market attention on sales reports and technological progress, continue to support a positive short-term outlook for TSLA.
What’s your view on Tesla’s stock in the coming days? Share your thoughts below!
Can $TSLA push to new highs?TSLA looks like it's still bullish as it retested this support level and is now pushing back above it.
I think it's possible that we see a large move, potentially up to the $600 levels, but I've marked off key resistances to the upside as well incase we stop before that.
Let's see how it plays out over the coming weeks.

what is market needs ?market need a huge money to move < money will pass in market pocket to pocket.
each move is not same profit for them they also does not know how much they can earn so to minimize their loss they go for test .in test they have a pool we call it range/side. they feed small institute. they will help them with hedge funds in sharp move /.
when you want to trade . trust in just one trend do not trade by whole moves .

TESLA - Expected drop to 350 area following newswassup guys its Tommy here, its been a while i know.
With less time on my hands to scalp gold as i did, i have been looking at stocks and applying my skills in different areas like swing trading and investing short and long term.
Its easier on the mind for me as i can research in my own time and not a slave to the charts as i once was.
Tesla has faced some news today of the new model Y problems and falling of european sales, along with hitting major resistance, i think we can come down to lower prices.
I have shares in tesla that i will be selling at this price and leaving the majority in just in case.
Should we get the pull back to 350 i will buy again.
Hope you're all good out there my beloved gold gang! im coming back for you soon
Tommy <3

TSLA LONG SWING READ NOTES 25 SEP 2025I have bought some Tesla stocks now around $424 for swings. I know market is all time high & Tsla can do $450 here. I am just taking market over all support which is again very poor.
This is an average trade
If you are not confident dont trade.
I have gone long with stocks only

Tesla - SHOW ME THE CHART AND I WILL TELL YOU THE NEWS!Back in June and July, Elon and Tesla were STILL getting a lot of bad press (Elon fighting with President Trump, people burning Tesla cars etc). Those that follow me may recall on July 29th I wrote the following:
"Tesla just needs a narrative shift (ie -new invention etc), & price action changes in a heart beat.
Yet, price action really has less to do with the news making Elon a hero, then a villain and then back and forth...but moreso to do with price action patterns that just keep repeating".
And you'll note that my July chart suggested that the huge pump to $400+ would begin around Sept 1st (Huge green arrow after the retest). What a coincidence that 2 weeks later Elon announces a $1Billion dollar Tesla stock buy (the new anticipated "narrative"). My huge green arrow was there many weeks before this "news". How could I have known?
SHOW ME THE CHART AND I WILL TELL YOU THE NEWS.
On July 29th Tesla was $321 and I suggested that Tesla was about to have a major breakout to at least $400 "with no major retraces". That target has now been hit. Is it because of the news or is it the patterns that just keep repeating?
My T1 targets are probable targets, so I anticipate them almost always getting hit. My ideal buy and sell targets are T2. Tesla now appears to be headed into my T2 target, so it's time to start monitoring price action closely.

Major Global Shipping Hubs and Ports1. The Importance of Global Shipping Hubs
1.1 Gateways of Trade
Ports act as gateways for imports and exports, handling goods ranging from crude oil, grains, and automobiles to high-value electronics.
1.2 Nodes in Global Supply Chains
They serve as critical nodes in intermodal logistics, linking ships, railways, and trucking systems.
1.3 Economic Drivers
Ports stimulate economic growth by creating jobs, attracting industries, and boosting regional trade.
1.4 Strategic Geopolitical Assets
Some ports lie at chokepoints like the Strait of Malacca or the Suez Canal, giving them immense geopolitical significance.
2. Criteria for a Global Shipping Hub
A shipping hub is not just a large port—it must have:
High throughput capacity (container traffic measured in TEUs).
Strategic geographic location (close to major trade routes).
Connectivity (shipping alliances, inland transport, and logistics networks).
Advanced technology (automation, digital tracking, AI logistics).
Economic and geopolitical stability.
3. Asia: The Heart of Global Shipping
Asia dominates maritime trade, hosting the world’s busiest container ports due to its role as the global manufacturing hub.
3.1 Port of Shanghai, China
World’s busiest port since 2010.
Handles over 47 million TEUs annually.
Located at the Yangtze River Delta, serving China’s industrial powerhouse.
Features automated terminals and deep-water berths at Yangshan.
Connects to Europe, North America, and Asia-Pacific markets.
3.2 Port of Singapore
Often called the “World’s Busiest Transshipment Hub.”
Handles around 37 million TEUs per year.
Strategic position on the Strait of Malacca, linking East Asia with Europe, Middle East, and Africa.
Known for world-class efficiency, automation, and innovation.
PSA Singapore is building the Tuas Mega Port, which will consolidate all terminals by 2040.
3.3 Port of Ningbo-Zhoushan, China
Largest in terms of cargo tonnage (not just containers).
Integrates industrial hinterlands of Zhejiang province.
Strong in handling bulk commodities like coal, iron ore, and crude oil.
3.4 Port of Shenzhen, China
Adjacent to Hong Kong, serving Guangdong’s manufacturing hubs.
One of the fastest-growing container ports, with multiple terminals run by different operators.
3.5 Port of Hong Kong
Once the busiest port in the world, now overshadowed by mainland Chinese ports.
Still an important transshipment hub due to free port policies.
3.6 Busan Port, South Korea
Northeast Asia’s major transshipment hub.
Handles over 22 million TEUs annually.
Connects Korean industries with China, Japan, and global markets.
3.7 Port of Dubai (Jebel Ali), UAE
The largest port in the Middle East.
Gateway for trade between Asia, Africa, and Europe.
Known for logistics free zones, attracting multinational companies.
4. Europe: The Gateway Between East and West
Europe’s ports are essential for connecting Asia with the Atlantic economies.
4.1 Port of Rotterdam, Netherlands
Europe’s largest port, handling over 14 million TEUs annually.
Strategic location on the Rhine-Meuse-Scheldt Delta, providing inland access to Germany, France, and Central Europe.
Famous for automation, deep-water berths, and large oil refineries.
4.2 Port of Antwerp-Bruges, Belgium
Europe’s second-largest port.
Strong in handling chemicals, breakbulk, and containers.
Proximity to Rotterdam creates a Northern Range cluster.
4.3 Port of Hamburg, Germany
Germany’s largest port and Europe’s “Gateway to the East.”
Plays a major role in trade with China and Eastern Europe.
4.4 Port of Valencia, Spain
Spain’s busiest container port, serving as a hub for Mediterranean shipping.
Strong links to Latin America and North Africa.
4.5 Port of Piraeus, Greece
Acquired majority stake by China’s COSCO Shipping.
Serves as China’s gateway into Europe via the Belt and Road Initiative.
5. North America: Trade Powerhouses
5.1 Port of Los Angeles, USA
Largest container port in the U.S., handling 9–10 million TEUs annually.
Works in tandem with Port of Long Beach, forming the San Pedro Bay Port Complex.
Gateway for U.S.–Asia trade.
5.2 Port of Long Beach, USA
Known for green initiatives like electrified cranes and low-emission operations.
Together with LA, handles nearly 40% of U.S. imports.
5.3 Port of New York and New Jersey, USA
Largest East Coast port, handling cargo for the dense Northeast market.
Strong in logistics connectivity via rail and trucking.
5.4 Port of Savannah, USA
Fastest-growing U.S. container port.
Investment in deepening channels and expanding terminals.
5.5 Port of Vancouver, Canada
Canada’s largest port, linking Asian imports with North America.
Handles bulk commodities like grain, coal, and potash.
6. Latin America and Africa
6.1 Port of Santos, Brazil
Largest port in South America.
Handles Brazil’s soybean, sugar, and coffee exports.
6.2 Port of Colon, Panama
Located near the Panama Canal, serving as a key transshipment hub.
6.3 Port of Durban, South Africa
Africa’s busiest port.
Handles automotive exports and imports.
6.4 Port of Tanger Med, Morocco
One of Africa’s fastest-growing ports.
Strategic position near the Strait of Gibraltar, linking Europe and Africa.
7. Strategic Chokepoints and Their Ports
Some hubs gain importance due to chokepoints in global trade routes:
Suez Canal (Egypt): Port Said and Port Suez.
Panama Canal (Panama): Colon and Balboa.
Strait of Malacca: Singapore and Port Klang.
Gibraltar: Tanger Med.
These chokepoints are critical because blockages (like the Ever Given incident in the Suez Canal) can disrupt global supply chains.
8. Emerging Mega-Ports
8.1 Tuas Mega Port, Singapore
Will be the largest fully automated port by 2040.
8.2 Gwadar Port, Pakistan
Part of China-Pakistan Economic Corridor (CPEC).
Provides China direct access to the Arabian Sea.
8.3 Chabahar Port, Iran
Supported by India to bypass Pakistan for trade with Afghanistan and Central Asia.
9. Challenges Facing Global Ports
9.1 Congestion
Ports like Los Angeles and Shanghai often face severe backlogs, causing delays.
9.2 Environmental Concerns
Pressure to adopt green shipping practices and reduce emissions.
9.3 Geopolitical Tensions
Trade wars, sanctions, and conflicts can disrupt port operations.
9.4 Infrastructure Strain
Need for constant upgrades to handle growing container sizes (mega-ships with 24,000+ TEU capacity).
9.5 Digital Transformation
Integration of AI, blockchain, and IoT to streamline operations.
10. The Future of Global Shipping Hubs
Automation & Smart Ports: Drones, AI, and autonomous cranes.
Sustainability: Green hydrogen, shore power, and emission-free logistics.
Resilience: Ports diversifying supply chains to reduce risks from disruptions.
Regional Growth: Africa and South Asia may emerge as new port powerhouses.
Conclusion
Major global shipping hubs and ports are the lifelines of world trade, connecting producers and consumers across oceans. Asia dominates container handling, Europe acts as the West’s gateway, and the Americas provide vital import-export channels. Meanwhile, Africa and the Middle East are rising as strategic hubs.
These ports are not just infrastructure—they are economic engines, geopolitical assets, and technological pioneers. As global trade evolves, these hubs will adapt, expand, and innovate, ensuring the continuous flow of goods that sustains modern economies.
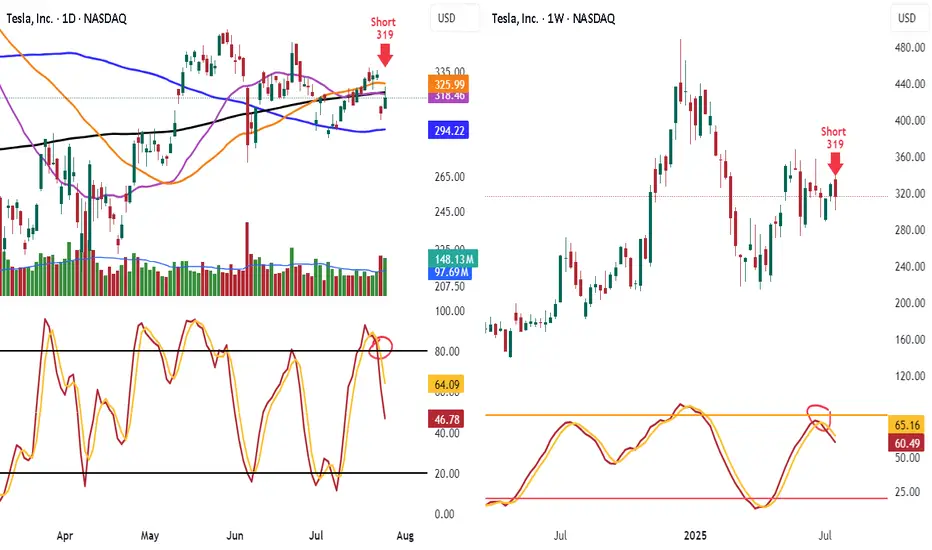
Shorted TSLA 319 Look at TSLA hit 50 day and 200 day MA and failed and know under them
Look at the lower highs and see the stoch heading down
Know lets look weekly stoch heading down and lower highs
Target is 100 day ma 294.22 take some off. When it breaks will add back on
Have trailing stop in place
TESLA Wave Analysis – 24 September 2025
- TESLA rising inside impulse wave iii
- Likely to reach resistance level 460.00
TESLA has been rising in the last few trading sessions inside the sharp upward impulse wave iii – which belongs to the intermediate impulse wave C from June.
The price earlier broke above the round resistance level 400.00 - which strengthened the bullish pressure on TESLA.
Given the clear daily uptrend, TESLA can be expected to rise further in the active impulse wave iii toward the next resistance level 460.00 (target price for the completion of the active impulse wave iii).
$TSLA ATH BREAK SOONTons of NASDAQ:TSLA otm puts were sold at the open today.
$5.6 million 370p 10/31
$6.1 million 430p 10/3
$5 million 370p 11/21
$5.2 million 370p 11/21
Also otm calls were bought
$8.5 million 550c 11/21
$3.3 million 500c 11/21

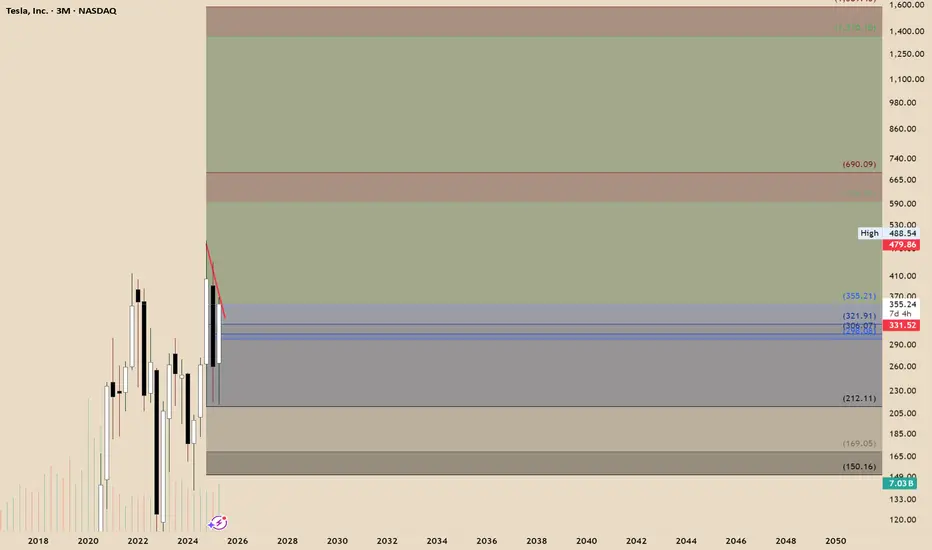
A Bullish Long-Term Outlook Tesla continues to present a compelling case for long-term investors, underpinned by its innovation-led growth trajectory and emerging dominance in autonomous mobility. Technically, recent market structure reveals an imbalance within a quarterly bullish breaker, suggesting further price expansion. If macroeconomic conditions remain favorable, the next algorithmic target zones fall between $594 and $690, signaling potential upside.
On the fundamental front, Tesla’s recent moves—particularly its rollout of the robotaxi network—have ignited fresh investor optimism. Analysts now estimate that autonomous driving could account for a substantial portion of Tesla’s future valuation, with some long-range forecasts placing the stock above $2,000 within the next several years.
While short-term pressures such as softening EV demand and regulatory barriers persist, Tesla’s consistent execution on AI-driven mobility may unlock new valuation territory.
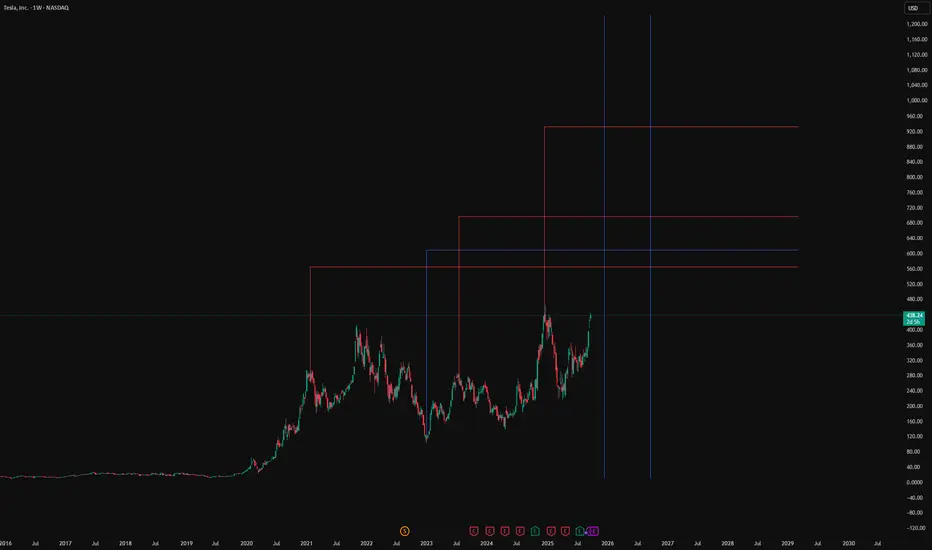
LevelsHere are some future levels of significance for Tesla in its uptrend - there should be significant reactions at these levels.
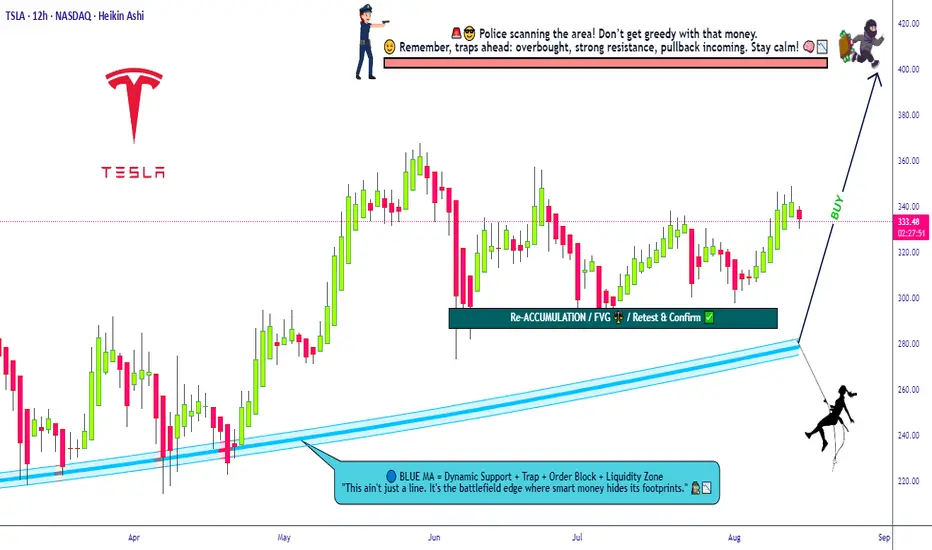
Bullish Tesla Mission Activated – Grab the Loot Now!💎🚨 TESLA STOCK MARKET HEIST PLAN 🚨💎
🕵️♂️ Attention All Thief OG’s, Chart Ninjas & Wall Street Pickpockets!
We’re gearing up for a full-blown Tesla loot mission — bullish, layered, and locked on target! 📈💰
🎯 Plan:
Bullish Layered Entry Strategy 🤑
We’re stacking multiple BUY LIMIT layers like a pro bank job:
💵 (330.00) | 💵 (320.00) | 💵 (310.00) | 💵 (300.00)
(You can add more layers if you want to steal bigger)
🛑 Stop Loss:
The Thief’s SL @ 280.00 💣
📌 Adjust to your own risk — every crew member knows their escape route!
Remember: A good thief never leaves fingerprints, only profits.
🏆 Target:
🚓 Police barricade at 420.00 — better vanish before the sirens!
🎯 Secure the main loot at 400.00 before making a clean getaway.
💡 Thief Strategy Tip:
Layering lets you grab more loot if price dips — like breaking into multiple vaults.
Keep your disguise on and watch the charts — Wall Street guards are always watching. 👀🖤
⚠️ Warning for the Crew:
Major news drops = cops on every corner.
Stay hidden, trail your stops, and protect the stash.
💥 Smash the ❤️ LIKE button if you’re in for this Tesla mission!
📌 Follow the crew for more Thief Trader blueprints — next heist drops soon!
Will Tesla's stock price reach $600? Yes!
Hi my dears
I am at your service with Tesla stock analysis. This year and the following years, the stock growth trend will continue.
If you want to make big profits from the market, just follow my analysis.

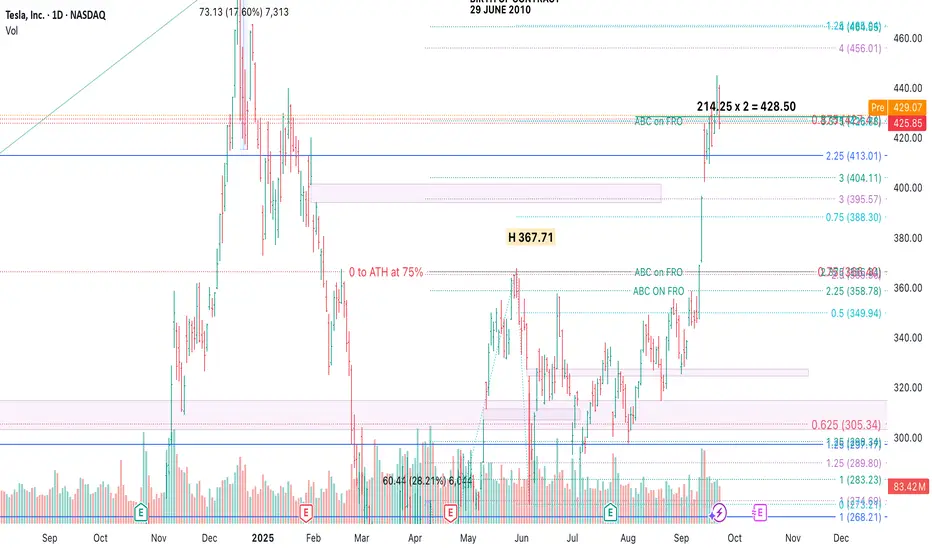
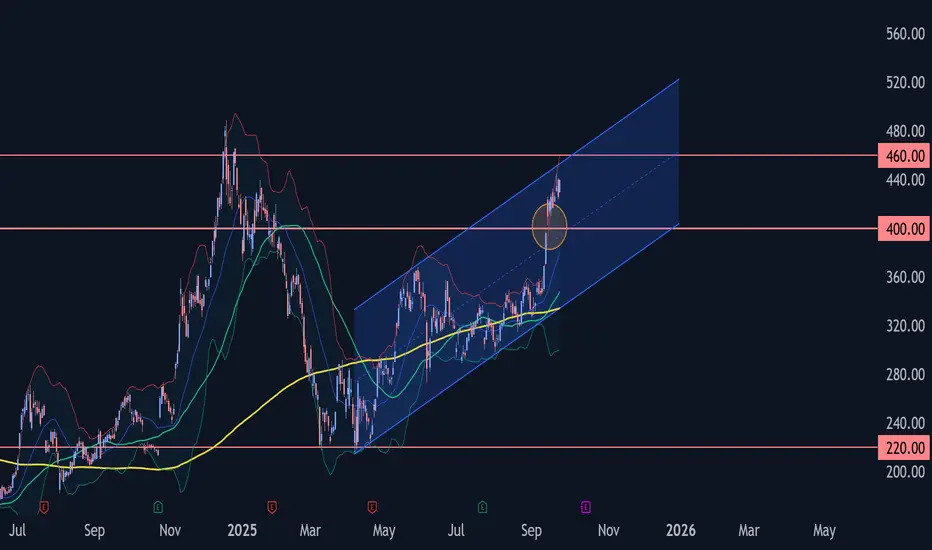
TSLA – Time & Price Relationships with ABC SetupThis chart highlights Tesla's price action through a potential ABC pattern, measured time cycles, and trend angles. The move from the April 2025 low to the recent September 2025 high spans 110 calendar days, mirroring a prior 110-day downswing — indicating possible time balance. Volume expansion supports the current uptrend, and we may be approaching a critical price/time resistance area. Watching for confirmation or reversal.