The Options Mirage: The Jackpot That’s Rigged Against YouMost retail traders fall in love with options because they seem to offer the impossible: with just a few hundred dollars you can dream of outsized returns. Fast money, easy money—at least that’s the story. With the right broker account and a handful of trades, the dream of becoming rich feels just around the corner.
What you’re not told—and what few truly understand given the complexity of the product—is that the “explosive payout” is not an opportunity. It’s a price. A very high one. And often inflated by the industry itself, knowing that the average investor (or rather, gambler) has no real way to calculate what they’re actually paying for. What you’re really buying is access to an extremely low probability of success, dressed up as a sophisticated strategy.
Yes, it’s the same psychology that drives lotteries and sports betting. And in finance, the odds aren’t any kinder.
The Baseline: the Where
At its simplest, speculation is about anticipating an up or down move in price.
Think it’s going up? Buy and aim to sell higher.
Think it’s going down? Sell and aim to buy back lower.
It sounds simple, but anyone with more than a month of trading experience can tell you it’s anything but. No one can predict the future with certainty. Still, this is at least a binary game: two mutually exclusive outcomes, like flipping a coin.
In technical terms, the market starts as a 50/50 distribution. With skill, analysis, and discipline, you might bias those odds slightly—say, 60/40 in your favor. That bias, repeated consistently, is what we call an edge. And with an edge, the path to long-term success is paved.
The Illusion of Acceleration
But let’s be honest: who wants to grind out a 60/40 edge slowly? We’re here for the Lamborghini, right? And the sooner the better.
That’s where the industry steps in with its “solution”: options. The promise is seductive—leverage the process, accelerate the outcome. With little money down, you can aim for massive returns. What’s not to like?
The problem is that the acceleration doesn’t come for free. To deliver those explosive payouts, the game adds layers of complexity.
From Where… to How and When
In options, you don’t just need to be right about where price is going.
You also need to be right about how it moves. That’s volatility—the speed and amplitude of the move. Even if you guess the direction correctly, if the move isn’t strong enough to beat strike + premium, you lose.
And then comes the when. Options expire. Time works against you. With the rise of 0DTE options, this window has shrunk to a single day. You might be perfectly right on direction and volatility—but if it happens tomorrow instead of today, your trade is worthless.
Now here’s the key point: this isn’t additive complexity. It’s multiplicative. Each layer collapses your probability of success exponentially. Even though the mathematical proof could be enlightening, I have promised not to use heavy math in this blog. All you need to know is this: in the majority of cases, that collapse in probability is not evenly compensated by the outsized payout. And this is exactly what most retail traders fail to perceive.
It’s not just that you’re playing a harder game—it’s that you’re playing a biased one, where the odds are stacked even further against you.
The Lottery Bias: The Cognitive Trap
Here’s where psychology plays its cruelest trick. The lower the probability of success, the higher the payout offered. In fact, it’s not even the full payout you deserve—it’s a discounted, haircut payout, cleverly packaged so you don’t notice because the potential number is so large. And that number lights up the brain like a jackpot.
The industry knows this. It builds its business on the fact that humans systematically overestimate tiny probabilities and underestimate the certainty of losing. Retail traders convince themselves they’re being clever: risking little for the chance at something huge. But the math is merciless—the expected value is brutally negative.
The market is not handing you an edge. It’s dismantling any possibility you had of one. That giant payout you see? It’s not a gift—it’s a warning label.
And yes, I know you can point to stories about the guy who hit the jackpot, who “proved the math wrong.” But let me ask you this: do you know what survivorship bias is? If you don’t, and you’re trading options, here’s some professional advice for free—go and read about it before you place your next trade.
The Real Path to the Lambo
What gets sold as “smart leverage” is, in truth, just a lottery ticket wearing a suit. The Lambo doesn’t come from hitting jackpots. It comes from consistency—from repeating disciplined decisions with positive expectancy until compounding does its quiet but powerful work.
And yes, I know most traders are in a hurry. The good news? The process can be accelerated—but not by gambling on options with negative expectancy. It can be accelerated using technical, rational tools. Once an edge is established, leverage makes sense. That’s where concepts like the Kelly criterion come in: scaling growth aggressively, but without walking straight into ruin. (I’ve already written about Kelly earlier in this blog: here.)
Conclusion
We’ve stripped the illusion bare: more conditions don’t make you smarter, they make you less likely to succeed. What feels like a shortcut is nothing more than a statistical mirage—the financial equivalent of a lottery ticket, marketed to you as a “highway to riches,” exploiting your belief that complexity equals intelligence.
Unfortunately, the narrative is powerful, because it preys directly on cognitive bias. I know I’m swimming against the tide here. I know this post won’t go viral. I don’t expect many to believe what the math has to say about options trading.
But maybe, just maybe, a small number of traders reading this will see beneath the surface and save their time, energy, and money for better pursuits. If that’s you, then this post has already done its job.
If you can resist the mirage and stick to building real edges, you’ve already won a key battle—and most likely saved yourself a costly trading lesson.
TL01 trade ideas

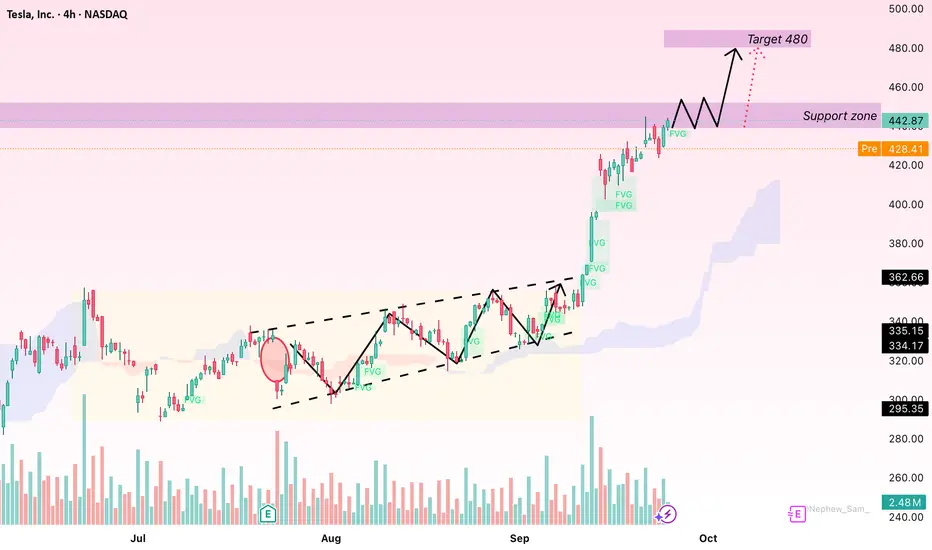
TSLA: Likely to Continue Rising if Holding Above $440Hello everyone,
Today, Tesla (TSLA) shares are trading at $442.87, up 0.77% from the previous close. After a strong rally recently, the market is closely watching whether TSLA can sustain its upward momentum or if a short-term pullback may occur.
The slight retreat in recent sessions mainly stems from profit-taking as the stock approached the $450 mark, creating temporary selling pressure. However, Fair Value Gaps (FVGs) formed during prior rallies are providing important support zones. These levels could serve as potential entry points if the price tests them again.
Trading volume has increased significantly in recent sessions, indicating strong participation from large investors and reflecting long-term confidence in Tesla. As long as the stock holds above the $440 support level, there is a good chance it could rebound to $450 and potentially reach $460 in the coming sessions.
Technical factors such as the Ichimoku cloud structure, combined with support from FVG zones, reinforce the bullish trend. On the macro side, although the Fed maintains a tight monetary policy, current interest rates still provide a favorable environment for tech stocks. Expectations of possible rate cuts in the future are adding further support for TSLA.
In the electric vehicle sector, Tesla continues to lead with production expansion, technology upgrades, and new product launches. News related to these developments often directly impacts the stock price, driving further gains.
Strong inflows from major investors, along with market attention on sales reports and technological progress, continue to support a positive short-term outlook for TSLA.
What’s your view on Tesla’s stock in the coming days? Share your thoughts below!
TESLA - Expected drop to 350 area following newswassup guys its Tommy here, its been a while i know.
With less time on my hands to scalp gold as i did, i have been looking at stocks and applying my skills in different areas like swing trading and investing short and long term.
Its easier on the mind for me as i can research in my own time and not a slave to the charts as i once was.
Tesla has faced some news today of the new model Y problems and falling of european sales, along with hitting major resistance, i think we can come down to lower prices.
I have shares in tesla that i will be selling at this price and leaving the majority in just in case.
Should we get the pull back to 350 i will buy again.
Hope you're all good out there my beloved gold gang! im coming back for you soon
Tommy <3

$TSLA: Sierpinski Fibs (RAW)Documenting in interactive the geometry of movements for research purposes to learn how future outcomes deviates in respect to angles from original measurements. Since the periods are vast, the corresponding price axis also spans large magnitudes. This uncovers the long-term confluence points and provides basic texture of systemic behavior.

#SUPERUSDT Long#SUPER/USDT Long
Leverage: 50x
Entry Targets: 0.5403
Take-Profit Targets:
0.6000
0.6400
0.6600
0.6800
0.7161
Stop-Loss: 0.5160
Trading comes with high risk; limit your funds to 2% per trade.

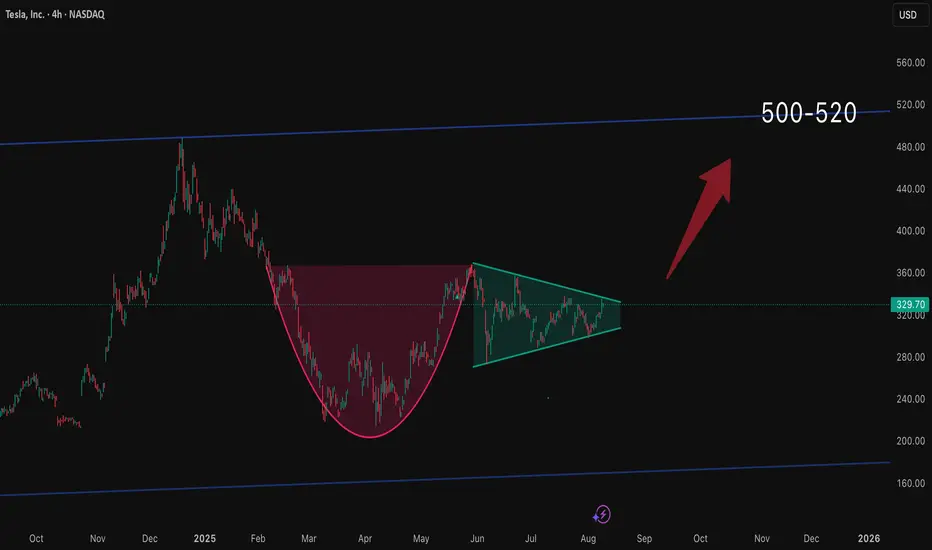
Is the wait over?Time to rise and shine off the couch? Cup and handle will hopefully be complete soon.
Preferably want to see the price above 370 for it to be valid.
But already at 340 it’s a mini buy signal.
We’ll see what the future brings us.
☀️🫶
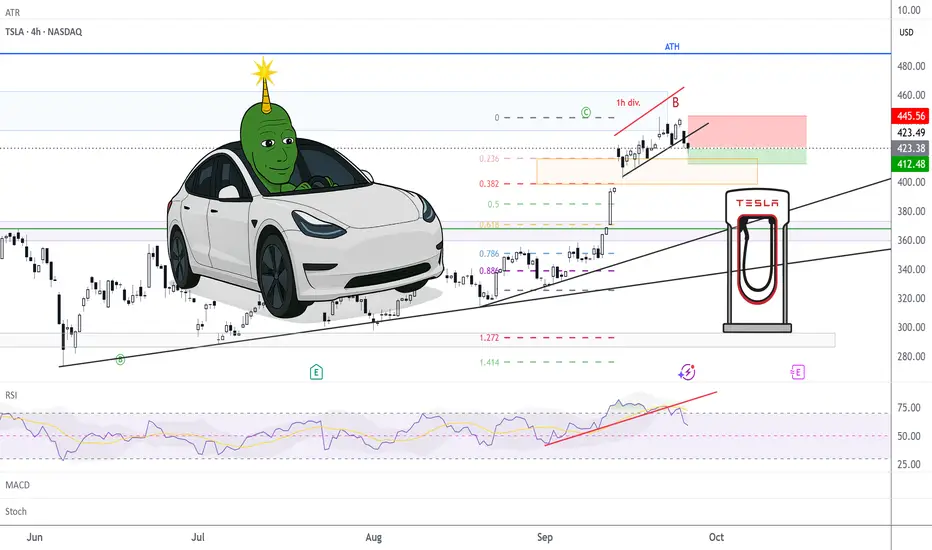
TSLA: Battery Low, Time to Recharge?After reaching the all-time high area again with Elliott Wave C on the daily chart, a downside retracement looks likely. There are still gaps below to be filled, along with key Fibonacci levels yet to be tested. This creates a solid opportunity for a 1 ATR short trade, with the first target set at $412.
On the 1-hour chart, RSI, MACD, and Stochastic oscillators are all showing divergences, suggesting a potential break in the uptrend. The upward trendline has also been broken on the 1-hour timeframe, adding further confirmation for the short setup. On the 4-hour chart, ATR is currently 11, which puts a 2 ATR stop slightly above the recent highs, offering protection for the trade. If this level is invalidated, the short idea is likely premature.
This setup is quite similar to the Oracle move, where price gapped up to all-time highs before retracing:
Disclaimer: This idea is for educational purposes only. Please do not place trades solely based on this setup.
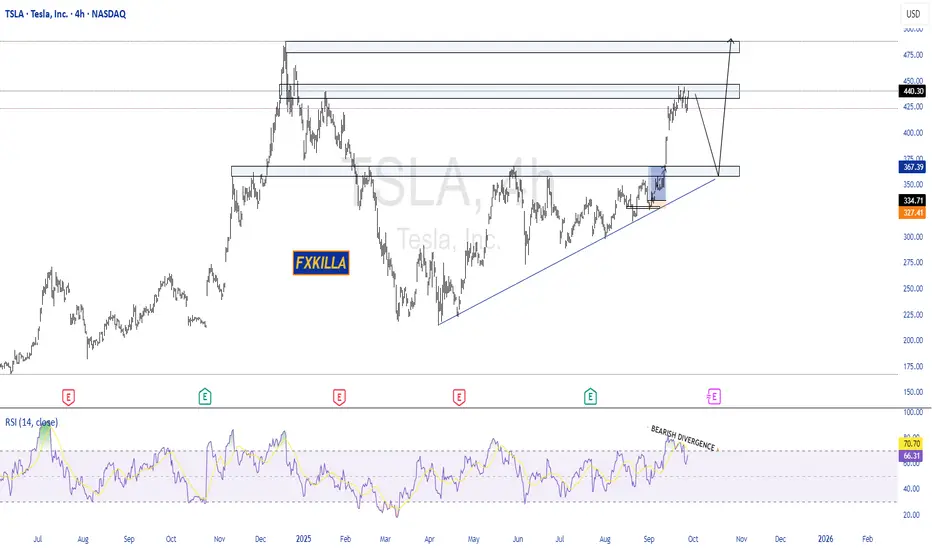
TESLA HIGH PROBABILITY SETUPS SOON!!!🚨 TESLA HIGH PROBABILITY SETUPS 🚨
* Here We Can See The Next Potential Moves For TSLA Coming Hours/Days.
* Keep Your Eyes Close On Your Trading Positions.
* Happy PIP Hunting Traders.
FXKILLA.
TSLA LONG SWING READ NOTES 25 SEP 2025I have bought some Tesla stocks now around $424 for swings. I know market is all time high & Tsla can do $450 here. I am just taking market over all support which is again very poor.
This is an average trade
If you are not confident dont trade.
I have gone long with stocks only

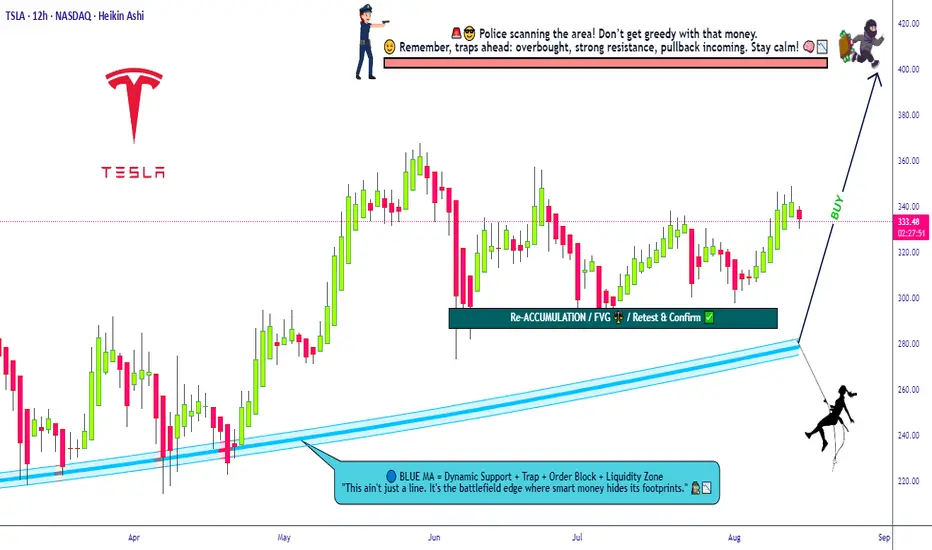
Bullish Tesla Mission Activated – Grab the Loot Now!💎🚨 TESLA STOCK MARKET HEIST PLAN 🚨💎
🕵️♂️ Attention All Thief OG’s, Chart Ninjas & Wall Street Pickpockets!
We’re gearing up for a full-blown Tesla loot mission — bullish, layered, and locked on target! 📈💰
🎯 Plan:
Bullish Layered Entry Strategy 🤑
We’re stacking multiple BUY LIMIT layers like a pro bank job:
💵 (330.00) | 💵 (320.00) | 💵 (310.00) | 💵 (300.00)
(You can add more layers if you want to steal bigger)
🛑 Stop Loss:
The Thief’s SL @ 280.00 💣
📌 Adjust to your own risk — every crew member knows their escape route!
Remember: A good thief never leaves fingerprints, only profits.
🏆 Target:
🚓 Police barricade at 420.00 — better vanish before the sirens!
🎯 Secure the main loot at 400.00 before making a clean getaway.
💡 Thief Strategy Tip:
Layering lets you grab more loot if price dips — like breaking into multiple vaults.
Keep your disguise on and watch the charts — Wall Street guards are always watching. 👀🖤
⚠️ Warning for the Crew:
Major news drops = cops on every corner.
Stay hidden, trail your stops, and protect the stash.
💥 Smash the ❤️ LIKE button if you’re in for this Tesla mission!
📌 Follow the crew for more Thief Trader blueprints — next heist drops soon!
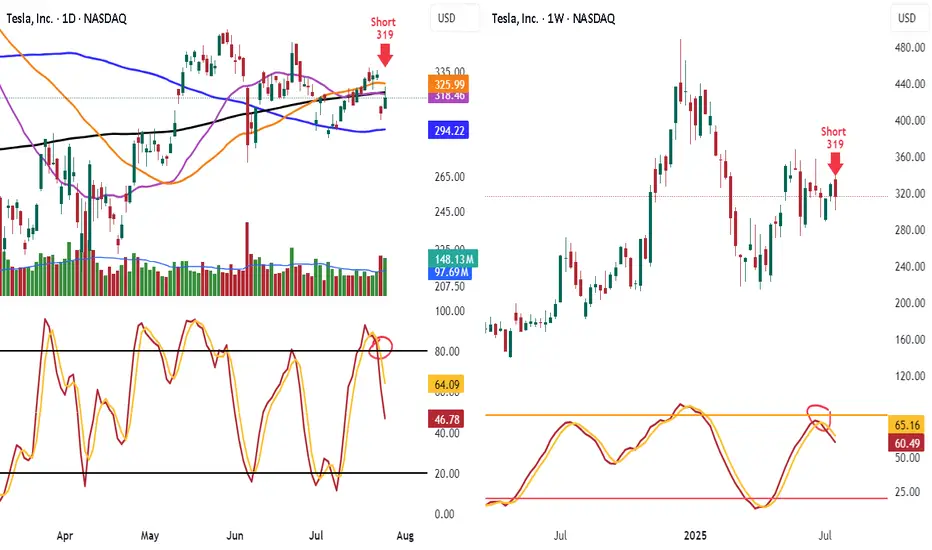
Shorted TSLA 319 Look at TSLA hit 50 day and 200 day MA and failed and know under them
Look at the lower highs and see the stoch heading down
Know lets look weekly stoch heading down and lower highs
Target is 100 day ma 294.22 take some off. When it breaks will add back on
Have trailing stop in place
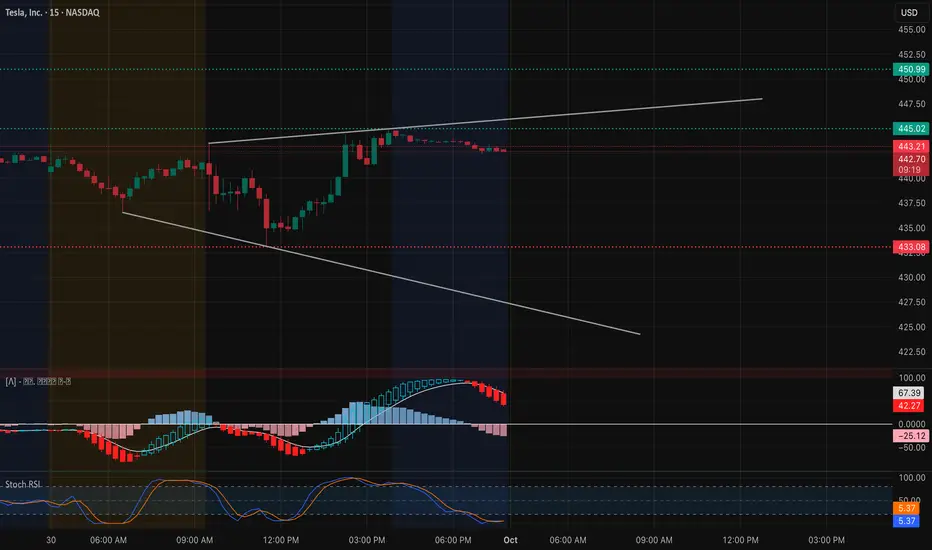
TSLA Oct. 1 – Eyeing the $450 Breakout Zone! 🚀Intraday View (15-Min Chart)
TSLA rebounded sharply intraday and is now consolidating around $443–$444 just under key resistance. Price action has formed a rising channel, but momentum is stalling.
* Support Levels: $442.20, $438.60, $433.08
* Resistance Levels: $445.00, $450.99, $452.50
* Indicators: MACD histogram rolling red, showing fading momentum. Stoch RSI sitting low, suggesting room for a relief bounce.
📌 Intraday Thought (Oct. 1): If $442 holds, expect attempts to push into $445–$450. A breakdown below $442 could trigger a move back toward $438 and $433. Scalpers can play long near $442 support with tight risk, or fade $450 resistance if tested and rejected.
Options & Swing View (1H + GEX)
Gamma exposure shows critical levels:
* Upside: Heavy call wall at $450–$452.5, with more stacked toward $465–$470.
* Downside: Strong put support near $432–$425, deeper wall at $417.5.
This suggests TSLA is coiling between $432–$450. A breakout over $450 could ignite momentum into $465–$470, while losing $432 risks a slide back to $425.
* Bullish Play (Oct. 1): Calls or debit spreads targeting $450 → $465 if price breaks $445 with volume.
* Bearish Hedge: Puts toward $432 → $425 if $442 breaks down.
* Neutral Play: Iron condor between $432–$452 to capture premium during consolidation.
My Thoughts (Oct. 1)
TSLA is parked right below a heavy $450 gamma wall. If bulls clear $445 and sustain, we could see an explosive push toward $465+. But failure to hold $442 opens the door to retesting $432 quickly. For now, this is a make-or-break level, and I’d keep risk management tight with options plays centered around the $450 breakout.
Disclaimer: This analysis is for educational purposes only and does not constitute financial advice. Always do your own research and manage risk before trading.
TESLA WEEKLY STOCKSTESLA STOCK TO THE moon again ,if we get a pull back into 389-390 zone and stop loss will be 350$ then go long and target 540$ supply roof or more .
nice risk to reward.
#tesla #stocks #shares #bonds

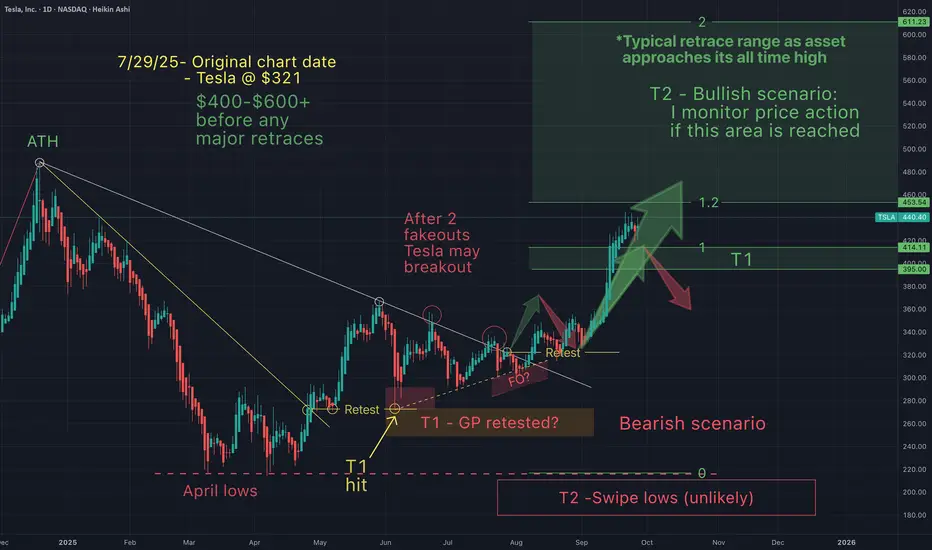
You will ask yourself "how did he know Tesla would do that"?On July 29th Tesla was $321 and I suggested (after a breakout & retest) Tesla would pump straight to low $400s (without any retraces). Now that the trading week has closed here's an update:
Things are still going according to what I expected. But how is this possible...I don't have a crystal ball! How could I have predicted this even *before Elon claimed to have invested 1B into Tesla?
Did Elon know something that we didn't or did I know something you didn't?
Is it the "narative" or the ongoing, repeating, predicable chart patterns?
TA works!
Tesla (TSLA) Share Price Rises Ahead of Earnings ReportTesla (TSLA) Share Price Rises Ahead of Earnings Report
On 16 September, we noted signs of a strong market for Tesla (TSLA) shares, including:
→ The price remaining above the psychological level of $400;
→ Reaching the highest levels since late January.
We also identified an ascending channel and suggested that the long-term outlook remained optimistic, although a correction could not be ruled out.
Since then, TSLA shares have stabilised near the upper boundary of the channel, holding above the $400 level. On Friday, they were among the market leaders, rising by more than 4%. This brings the gain since the start of September to around +30%.
Why Are TSLA Shares Rising?
Key factors supporting a bullish outlook include:
→ Sentiment ahead of the quarterly Production and Deliveries report, expected this week. According to recent forecasts, actual figures could exceed expectations (although still showing a decline compared to the previous year).
→ Target price upgrades. Dan Ives of Wedbush, one of Tesla’s most prominent bulls, last week raised his target price to $600 — the highest on Wall Street — citing substantial potential in AI and robotaxi development.
→ The “Musk factor”: Discussions around Elon Musk stepping away from politics are seen as a long-term positive driver.
Technical Analysis of TSLA Shares
The ascending channel remains intact. However, the chart suggests that the upper boundary now acts as resistance — unsurprising given the exceptional gains in September (noting that TSLA’s price has doubled since its yearly low). A slowdown in momentum is signalled by a bearish divergence on the RSI indicator.
Resistance at the upper boundary is further reinforced by a strong bearish reversal from late 2024. A similar pattern was recently observed when the price struggled to break above the bearish reversal zone at $345–355, resulting in an extended sideways movement in August and early September.
By analogy, the $445–465 zone may also act as resistance — meaning a correction remains a plausible scenario. For example, TSLA stock price could pull back to test the psychological $400 level, which is supported by the median of the current channel.
This article represents the opinion of the Companies operating under the FXOpen brand only. It is not to be construed as an offer, solicitation, or recommendation with respect to products and services provided by the Companies operating under the FXOpen brand, nor is it to be considered financial advice.

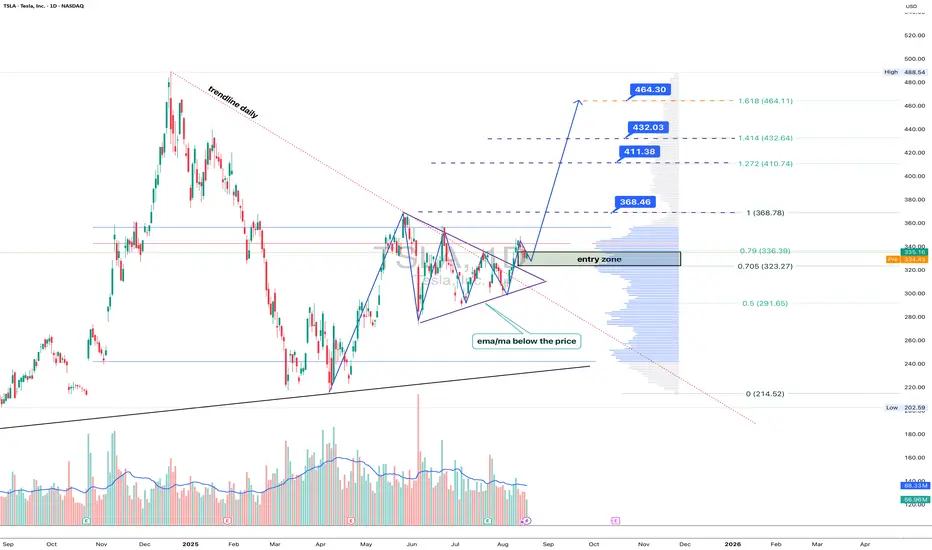
Tesla: breakout mode, Elon’s rocket fuel for the chartTechnically , Tesla broke out of a symmetrical triangle while holding above EMA/MA supports, which confirms bullish control. The breakout unlocks targets at 368.46 (Fibo 1), followed by 411.38, 432.03, and the 1.618 extension at 464.30. Volume profile confirms strong accumulation below, leaving the upside path less crowded.
Fundamentally , Tesla keeps investor attention alive. EV sales stabilized, but the focus has shifted to AI and robotaxi — Musk’s latest promises of disruption. With Fed rates peaking and yields easing, growth stocks regain momentum. Risks remain from Chinese competitors, yet Tesla’s margins are still leading the industry.
Tactical plan : entry zone stands at 323–336. As long as price holds above it, buyers target 368.46 → 411.38 → 464.30. A break below 323 would flip the bias back toward 291.
Bottom line: Tesla’s chart looks ready for lift-off. Musk might be dreaming of Mars, but for now, bulls are happy if he just launches the stock a few hundred dollars higher.
TSLATESLA looks bullish early part of this week, 470+ is the target level.
Disclosure: We are part of Trade Nation's Influencer program and receive a monthly fee for using their TradingView charts in our analysis.
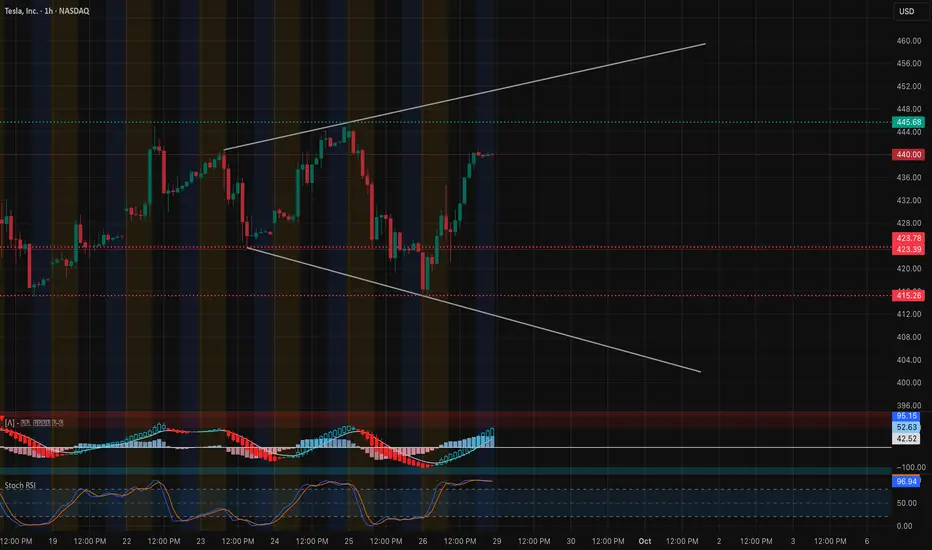
TSLA – Bulls Eye a Breakout While Gamma Maps the Path 🚀 1-Hour Technical Outlook
Tesla is pressing the upper boundary of a rising wedge that’s been developing since mid-September. Friday’s strong bounce off the $415–$420 demand zone reclaimed key hourly EMAs and has price rotating around $440. The MACD histogram just flipped positive and the Stoch RSI is still rising—momentum favors the bulls in the near term.
Key resistance sits at $445.7 (recent swing high) and the wedge top near $448–$450. A sustained hourly close above $450 would invalidate the wedge’s bearish bias and open room toward $455 and $460. On the downside, first support is $432–$430, then $423 and the critical $415 zone.
2-Gamma Exposure (GEX) Confirmation
Today’s GEX map backs the bullish case:
* Largest Call Wall / Max positive GEX is concentrated at $450 (≈73% call concentration).
* Next meaningful upside GEX cluster is $455 with ≈19% call flow.
* Put support is layered at $430 / $425 where negative gamma thins out.
This tells us market-makers will hedge by buying if price pushes above $450, amplifying a breakout. Conversely, a drop through $430 could accelerate hedging pressure lower.
3-Trade Ideas & Option Plays for This Week
* Aggressive Bullish Play: Hourly close above $445.7 and strong volume → Consider short-dated 0DTE/2DTE calls targeting $450–$455. Stop-loss below $440.
* Measured Bullish Play: Wait for clean breakout over $450 → 1-week 450 or 455 calls, or debit spreads like 445/455 to reduce premium.
* Protective Hedge: If TSLA loses $430 with momentum, quick puts to $425/$420 can work as insurance.
With IVR at ~25 and IVx near 64, premiums are not overly inflated, offering a decent risk/reward window for spreads.
My Take
TSLA is in a constructive hourly up-move that can quickly accelerate if $450 flips to support. Gamma positioning and fresh momentum give the bulls an edge, but the wedge pattern warns that a fake-out is possible. Keep stops tight and respect $430 as the line in the sand.
Disclaimer: This analysis is for educational purposes only and does not constitute financial advice. Always do your own research and manage risk before trading.
Tesla's New Range. Hello I am the Cafe Trader.
Today we are revisiting Tesla (TSLA).
Last article we identified the Key seller before this big extension. Today I have identified the last key seller, and how you can capitalize.
Price has now entered into the Light Supply Zone , a place where sellers will try to slow things down.
It is likely that you will want to play TSLA at the Extremes. Strong Supply , and Strong Demand levels are going to give you the best chance at a stronger reaction. So if you are playing the short term, These two plays marked on the chart will be your best bet.
If the Strong Buyers hold at around 417, This will put a lot of pressure on that last strong seller at 461. A push through them should see you ATH's (not without a strong reaction from the Strong Supply first).
Missed out on the move and want to add TSLA to your long term?
Long Term
These Prices should match your conviction on TSLA:
Aggressive : 409 - 419.50 (Top of Demand, even better if you get into those strong buyers)
Value : 333-344
Extreme Value : 288-294 or the Conservative Trendline.
Expect big things from TSLA in the coming years. I would not be surprised to see TSLA reach over 1,000 again.
Happy Trading,
@thecafetrader

Crazy or Optimistic?We've followed an upward channel since 2022. Since then, we have created HLs & HHs.
I see a price prediction of $550 to $600 by the end of the year, and +$700 by July 2026.
Let me know your thoughts.

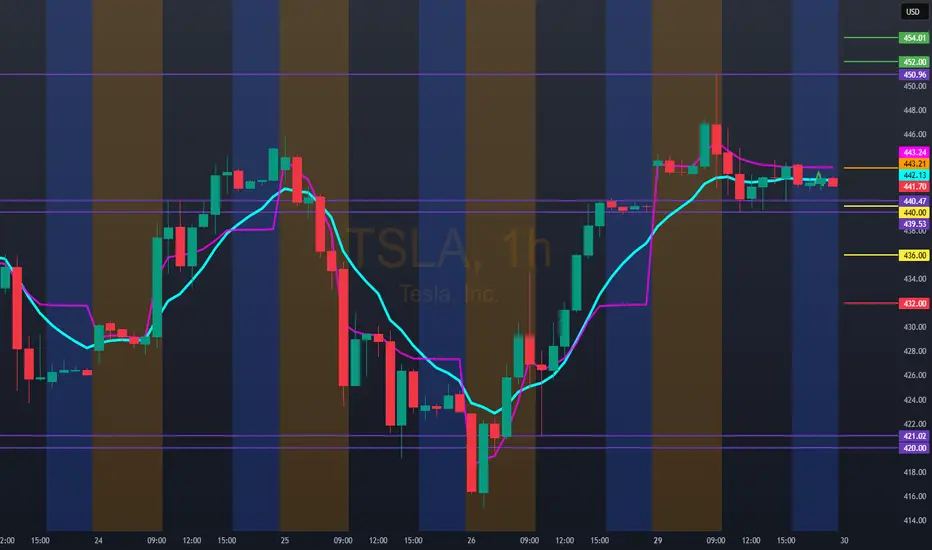
Hello trader, for tomorrow, 9/30/25, TSLA: 443.21Bullish entry above 454.00 with possible upside projection to 488.54, stop below vwap
Bearish entry only below 432.00. We could experiment with a rebound zone at 440.00/436.00, stop above vwap
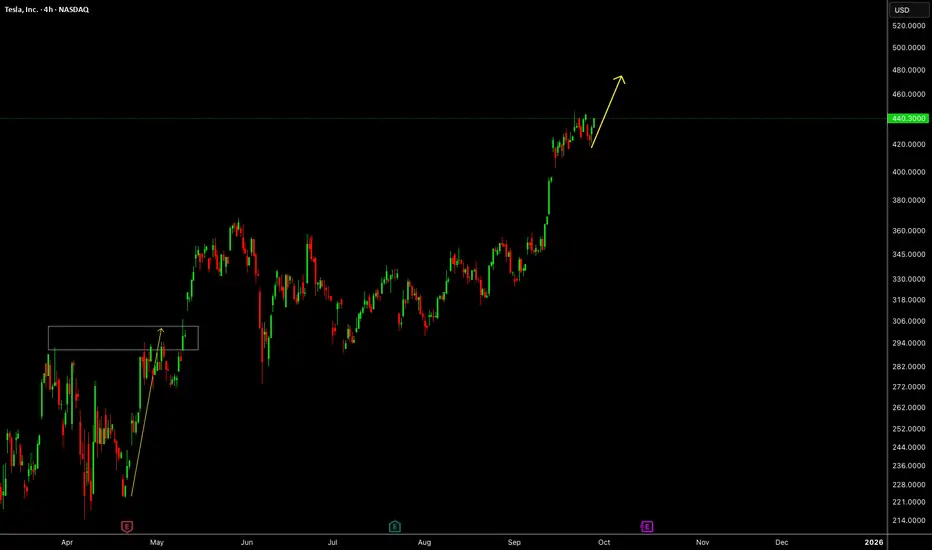
Tesla - Here we goooooo!🚗Tesla ( NASDAQ:TSLA ) is finally breaking out:
🔎Analysis summary:
Finally, after a consolidation of four years, Tesla is attempting another all time high breakout. With the bullish triangle coming to an end, bulls are dominating this stock. It just comes down to the next couple of months but a triangle breakout remains far more likely.
📝Levels to watch:
$400
SwingTraderPhil
SwingTrading.Simplified. | Investing.Simplified. | #LONGTERMVISION

TESLA: Short Trading Opportunity
TESLA
- Classic bearish formation
- Our team expects pullback
SUGGESTED TRADE:
Swing Trade
Short TESLA
Entry - 440.32
Sl - 443.84
Tp - 432.53
Our Risk - 1%
Start protection of your profits from lower levels
Disclosure: I am part of Trade Nation's Influencer program and receive a monthly fee for using their TradingView charts in my analysis.
❤️ Please, support our work with like & comment! ❤️
