$TSLA: Let The Rally Speak For Itself - 9/16/2025Based on the analysis, it’s confirmed that NASDAQ:TSLA has initiated a new rally following the completion of a lengthy and complex corrective structure at $288.
The stock bounced twice off the 50-week moving average, signaling strong support as the correction neared its end.
Due to the depth and complexity of the structure, Wave 3 is expected to unfold with high momentum, potentially delivering an explosive rally. Key upside targets are displayed in the chart — we’ll be watching closely to see how price reacts at those levels.
📚 Note: The internal structure and labeling were intentionally left visible in the chart for educational purposes. This is especially useful for traders interested in Modern Trading Algorithms and their structural variations.
Happy Trading, and let the rally speak for itself. 🚀
TL01 trade ideas

TESLA Wave Analysis – 24 September 2025
- TESLA rising inside impulse wave iii
- Likely to reach resistance level 460.00
TESLA has been rising in the last few trading sessions inside the sharp upward impulse wave iii – which belongs to the intermediate impulse wave C from June.
The price earlier broke above the round resistance level 400.00 - which strengthened the bullish pressure on TESLA.
Given the clear daily uptrend, TESLA can be expected to rise further in the active impulse wave iii toward the next resistance level 460.00 (target price for the completion of the active impulse wave iii).
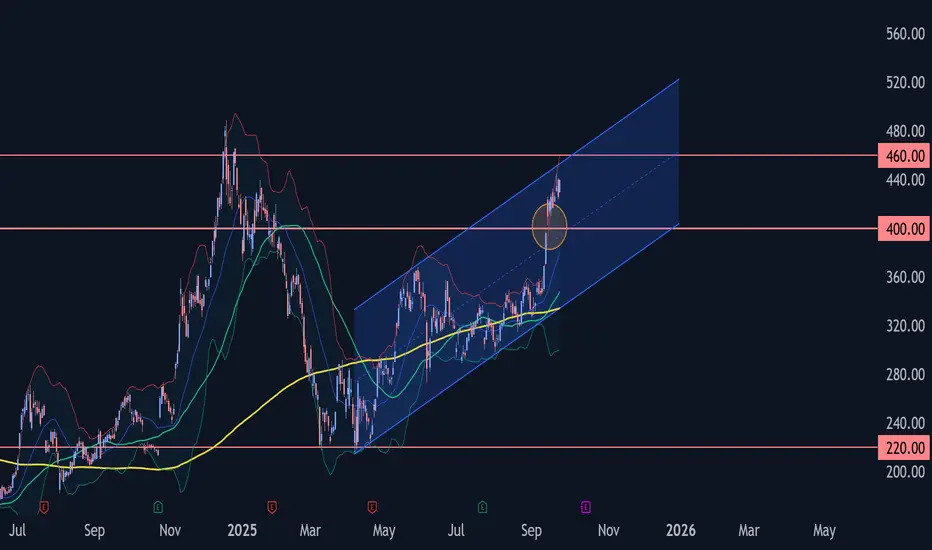
A Bullish Long-Term Outlook Tesla continues to present a compelling case for long-term investors, underpinned by its innovation-led growth trajectory and emerging dominance in autonomous mobility. Technically, recent market structure reveals an imbalance within a quarterly bullish breaker, suggesting further price expansion. If macroeconomic conditions remain favorable, the next algorithmic target zones fall between $594 and $690, signaling potential upside.
On the fundamental front, Tesla’s recent moves—particularly its rollout of the robotaxi network—have ignited fresh investor optimism. Analysts now estimate that autonomous driving could account for a substantial portion of Tesla’s future valuation, with some long-range forecasts placing the stock above $2,000 within the next several years.
While short-term pressures such as softening EV demand and regulatory barriers persist, Tesla’s consistent execution on AI-driven mobility may unlock new valuation territory.
TSLA – Time & Price Relationships with ABC SetupThis chart highlights Tesla's price action through a potential ABC pattern, measured time cycles, and trend angles. The move from the April 2025 low to the recent September 2025 high spans 110 calendar days, mirroring a prior 110-day downswing — indicating possible time balance. Volume expansion supports the current uptrend, and we may be approaching a critical price/time resistance area. Watching for confirmation or reversal.
$TSLA ATH BREAK SOONTons of NASDAQ:TSLA otm puts were sold at the open today.
$5.6 million 370p 10/31
$6.1 million 430p 10/3
$5 million 370p 11/21
$5.2 million 370p 11/21
Also otm calls were bought
$8.5 million 550c 11/21
$3.3 million 500c 11/21

Will Tesla's stock price reach $600? Yes!
Hi my dears
I am at your service with Tesla stock analysis. This year and the following years, the stock growth trend will continue.
If you want to make big profits from the market, just follow my analysis.

TSLA Sep 23 – Bulls Testing 440, Gamma Fuel Could Stretch This MPrice Action & Setup (1-Hour Chart)
TSLA pushed from the mid-420s and tagged 440 intraday before easing into a tight sideways drift around 436. Price is riding the lower rail of an ascending channel that started last week. Key intraday support is stacked near 433 and 426; a deeper flush could revisit 417.5. Holding above 433 keeps the short-term trend intact and gives bulls a clean springboard for the next leg.
Momentum Read
MACD on the 1-hour is still positive though histogram bars are tapering—classic sign of a healthy pause rather than a breakdown. Stoch RSI hovers near 80, so a quick reset or sideways chop would help build energy for another push.
GEX (Options Flow) Confluence
Options positioning leans bullish and matches the chart:
* Highest positive GEX / Call resistance: ~436
* 2nd Call Wall: ~450 (near 70% call concentration)
* 3rd Call Wall: ~457.5–460
* Main Put Defenses: 417.5, 410, 405 and a big floor at 400
If TSLA can stay north of 436, market makers may keep hedging upward, creating a gamma squeeze potential into 450 and beyond. A clean break below 433 would start unwinding that gamma and bring 417.5 into play.
Trading Plan
* Upside scalp: Buy strength on a 440 break with a first target at 450 and a trailing stop under 433.
* Retest entry: If we dip to 433–426 and bounce with volume, that’s a low-risk reload spot aiming again for 440+.
* Bear hedge: Below 426 with heavy sell volume, short toward 417.5 makes sense.
Option Angle
For bullish plays, short-dated calls around the 440–450 strikes look attractive if 436 holds and IV stays reasonable. For hedging or quick shorts, puts near 417.5 or 410 work if a breakdown confirms.
Bottom Line
Trend bias stays up as long as TSLA holds 433–426. A strong hourly close over 440 could pull in more gamma fuel toward 450–457. Fail that zone and expect a deeper check toward 417.
Disclaimer: This is for educational discussion only and not financial advice. Always do your own research and manage risk.

TESLA 989 IN NOVEMBER
🧩 Method in short
• Impulse + Midpoint → anchor the base geometry.
• Mirror slope → project equal angles forward.
• Octaves → copy slopes upward; price vibrates between them.
• Confluence → all red rails meet at the Rome date.
🔑 Sniper Rules
• ✅ Valid as long as TSLA stays above the white base slope.
• ✅ Bounces on the midpoint diagonal confirm strength.
• ❌ A close below the base slope cancels the 989 projection.
🎯 Targets
• Midpoint retest → acceleration.
• Upper octave → resistance.
• Final convergence → 989 by Nov 20, 2025.
⸻
All roads lead to Rome. For Tesla, that Rome is $989.
This is a geometry-based projection, not financial advice. Use your own confirmations and risk management.

TSLA Sep 22 Game Plan – “Charging Toward 433 or Stalling at 425?1️⃣ Big Picture on the 1-Hour Chart
* Price action: TSLA finished around 425.60, riding a rising channel that’s been building since last week. Price tested the mid-channel line and is now sitting slightly above the lower trend support.
* Key levels:
* Resistance: 430–433.25 (recent top & call wall)
* Support: 416.8 → 412.5 (channel support & high-volume level)
* Indicators:
* MACD is flattening but still positive, suggesting momentum is cooling but not gone.
* Stoch RSI near mid-range (~62) leaves room for a push higher or a deeper dip if sellers show up.
The structure leans mildly bullish as long as price respects the lower trendline, but TSLA needs to clear 430+ with conviction for the next leg up.
2️⃣ GEX / Options Flow
* Big call concentration sits near 433–435, then again up at 450 and 465.
* Strong put support shows around 402–400, with a key HVL near 412.5 that often acts like a magnet if selling accelerates.
* Options positioning shows about 83% calls vs puts, with an IVR of 20.3—liquidity is good and premiums are moderate.
This options picture supports the idea that market makers could keep TSLA boxed between 420 and 433 early in the week. A decisive break over 433 could invite a gamma-driven squeeze toward 440–450.
3️⃣ Trading Thoughts & Suggestions
* Scalp / day trade: A clean break above 430–433 with volume can target 440 quickly. Keep a tight stop under 426.
* Support bounce: If the open dips toward 416–412.5 and holds, look for a bounce back to 425+.
* Fade setup: A hard rejection at 433 with heavy sell volume opens room back toward 416 → 412.5.
4️⃣ Bottom Line
TSLA is coiling inside a rising channel. Bulls want a decisive move over 433 to unlock higher levels, while bears need a break below 416 to gain control. The first hour Monday should set the tone for direction.
Disclaimer: This is just market opinion for educational discussion. It’s not financial advice. Always manage your own risk before trading.

TSLA path to 550/650 USD Breakout Still Pending🔥 What specifically drives TSLA into 550–650
📦 Deliveries + mix surprise
If unit volumes beat whisper numbers and mix favors higher-trim/FSD attach, you get more gross profit per vehicle without needing price hikes. Watch the cadence of regional incentives and shipping vectors; strong NA/EU mix plus improving China utilization is the sweet spot.
🛠️ Margin stabilization → operating leverage
Gross margin base effect + opex discipline = powerful flow-through. Even a 100–150 bps lift in auto GM, coupled with energy GM expanding as Megapack scales, can push operating margin into low-mid teens. That alone recodes the multiple market is willing to pay.
🔋 Energy storage stepping out of auto’s shadow
Megapack/Powerwall growth with multi-GW backlogs turns “side business” into a credible second engine. As deployments and ASP/contract mix normalize, investors begin modeling $10–$15B annualized energy revenue with attractive GM — this is multiple-expanding because it looks more like infrastructure/software-tinted industrials than cyclical autos.
🤖 Autonomy & software monetization bridges
Two things move the needle fast: (1) clear progress toward supervised autonomy at scale (drives FSD attach + ARPU), and (2) licensing (FSD stack, charging/NACS, drive units). Even modestly credible paid-miles/seat-based models (think $50–$150/month vehicles on fleet) transform valuation frameworks.
🦾 Optimus/robotics as a real option, not sci-fi
The market doesn’t need commercial ubiquity — it needs line-of-sight to pilot deployments and unit economics where labor-substitute ROI < 3 years. A few high-credibility pilots (warehousing, simple assembly, logistics cells) can tack on optionality premium that pushes the multiple toward the top of the range.
💹 Options-market reflexivity
Flows matter. Elevated call demand near ATH turns dealers short gamma, forcing delta hedging that lifts spot, which triggers more call buying → a familiar feedback loop. On breakouts, watch open interest skew to short-dated OTM calls, and put-call ratios compressing; these magnify upside in a tight float day.
🌍 Macro & liquidity
If indices hold highs and the rate path doesn’t tighten financial conditions, growth duration gets rewarded. TSLA’s beta + story premium thrives in that regime.
________________________________________
🧠 Outside-the-box accelerants
🛰️ “Software day” packaging
A coordinated showcase that bundles FSD progress, energy software (fleet, VPP), service/insurance data, and Optimus pilots into a single capital-markets narrative could reframe TSLA as a platform. The Street responds to packaging; it compresses time-to-belief.
🤝 Third-party FSD/charging licensing headlines
A single blue-chip OEM announcing software licensing + NACS deep integration reframes the competitive landscape. The equity market pays a software multiple for recurring seats.
🏗️ Capex signaling for next-gen platform without GM hit
Announcing a modular, high-throughput manufacturing scheme (cell to structure, gigacasting tweaks, logistics compression) with proof that unit economics are accretive from ramp can flip skeptics who anchor to past ramp pain.
⚡ Grid-scale contracts + financing innovation
If Tesla pairs utility-scale storage with project-level financing (think repeatable ABS-like channels for Megapack), you de-risk cash conversion cycles and unlock a new investor constituency (infrastructure/green income). That tightens the multiple.
________________________________________
🏎️ Comparative playbook: RACE (Ferrari) & NVDA (NVIDIA)
👑 RACE — the scarcity & brand ROIC lens
Ferrari’s premium multiple rests on scarcity, orderbook visibility, and brand pricing power. TSLA doesn’t have scarcity, but it can borrow the RACE lens via (a) limited-run, ultra-high-margin trims that anchor halo pricing, (b) waitlist-like energy backlogs that create visibility, and (c) bespoke software packages that mimic “personalization” margin. In bull phases, RACE trades as a luxury compounder rather than an automaker; TSLA can earn a slice of that premium when the energy + software story dominates.
🧮 NVDA — the flywheel & supply-constrained S-curve
NVIDIA’s explosive run blended (1) clear demand > supply, (2) pricing power, (3) ecosystem lock-in. TSLA’s battery and compute stacks can echo that dynamic: limited 4680/cell supply + Megapack queues + proprietary autonomy data moat. The moment the market believes TSLA is supply-gated (not demand-gated) in energy/AI, it will award NVDA-like scarcity premia. Add toolchain stickiness (training data, fleet miles, Dojo/AI infra), and you get ecosystem multiples rather than auto multiples.
📊 What the comps teach for TSLA’s 550–650 zone
• RACE lesson: visibility + pricing power boost the quality of earnings → higher P/E durability.
• NVDA lesson: credible scarcity + platform control turbocharge EV/Sales and compress the market’s time-to-future state.
• Translation for TSLA: blend of luxury-like quality (energy contracts + premium trims) and platform scarcity (cells/AI stack) → multiple rerate into our target band.
________________________________________
🧾 Valuation outlook
🧮 Earnings path
• Units up mid-teens % Y/Y; ASP stable to slightly higher on mix; energy + software up strongly.
• Auto GM +100–150 bps; Energy GM expands on scale; opex +SMC disciplined → op margin 12–15%.
• Share count glide modest. Forward EPS ≈ $9–$11.
• Multiple: 50× (conservative growth premium) → $450–$550; 60× (software/autonomy visibility) → $540–$660.
• Why the market pays up: visible recurring high-margin lines (FSD, energy software, services) + AI/robotics optionality.
📈 EV/Sales path
• Forward revenue $130–$150B (auto + energy + software/services).
• Assign blended EV/Sales 6.5–7.5× when energy/software dominate the debate.
• Less net cash → equity value per share in $550–$650.
• Check: At 7× on $140B = $980B EV; equity ≈ $1.0–$1.1T with cash, divided by diluted shares → mid-$500s to $600s. Momentum premium and flow can extend to upper bound.
________________________________________
🧭 Technical roadmap & market-microstructure
🧱 Breakout mechanics
A decisive weekly close above prior ATH with rising volume and a low-volume retest that holds converts resistance to a springboard. Expect a “open-drive → pause → trend” sequence: day 1 impulse, 2–5 sessions of rangebuilding, then trend resumption.
🧲 Volume shelves & AWVAPs
Anchored VWAPs from the last major swing high and the post-washout low often act like magnets. Post-break, the ATH AVWAP becomes first support, then the $500 handle functions as the psychological pivot. Above there, $550/$590/$630 are classical measured-move/Fib projection waypoints; pullbacks should hold prior shelf highs.
🌀 Options & dealer positioning
On a break, short-dated OTM calls populate 1–2% ladders; dealers short gamma chase price up via delta hedging. Expect intraday ramps near strikes (pin-and-pop behavior) and Friday accelerants if sentiment is euphoric. A steepening skew with heavy call open interest is your tell that supply is thin.
________________________________________
🧨 Risks & invalidation
🚫 Failed retest below the breakout shelf (think: a fast round-trip under the $4-handle) downgrades the setup from “trend” to “blow-off.”
🧯 Margin or delivery disappointments (e.g., price-war resumption, regional softness) break the EPS/EV-Sales bridges.
🌪️ Macro shock (rates spike, liquidity drains) compresses long-duration multiples first; TSLA is high beta.
🔁 Flow reversal — if call-heavy positioning unwinds, gamma flips to a headwind and accelerates downside.
________________________________________
💼 Trading & portfolio expressions for HNWI
🎯 Core + satellite
Hold a core equity position to capture trend, add a satellite of calls for convexity. If chasing, consider call spreads (e.g., 1–3 month $500/$600 or $520/$650) to tame IV.
🛡️ Risk-managed parity
Pair equity with a protective put slightly OTM or finance it with a put spread. Alternatively, collars (write covered calls above $650 to fund downside puts) if you’re guarding a large legacy stake.
⚙️ Momentum follow-through
Use stop-ins above key levels for systematic adds, and stop-outs below retest lows to avoid round-trips. Size reduces into $590–$630 where target confluence lives; recycle risk into pullbacks.
💵 Liquidity & slippage
Scale entries around liquid times (open/closing auctions). For size, work algos to avoid prints into obvious strikes where dealers can lean.
________________________________________
🧾 Monitoring checklist
🔭 Delivery run-rate signals (regional registration proxies, shipping cadence).
🏭 Margin tells (bill of materials trends, promotions cadence, energy deployment updates).
🧠 Autonomy milestones (software releases, safety metrics, attach/ARPU hints).
🔌 Licensing/partnership beats (NACS depth, FSD/AI stack interest).
📊 Options dashboard (short-dated call OI ladders; put-call ratio shifts; gamma positioning).
🌡️ Macro regime (rates, liquidity, risk appetite).
________________________________________
✅ Bottom line
🏁 The 550–650 tape is not a fairy tale — it’s a stacked-catalyst + rerate setup where energy/software/autonomy rise in the narrative mix, margins stabilize, and options-market reflexivity does the rest. Execute the breakout playbook, respect invalidation lines, and use convex expressions to lean into upside while protecting capital.
esla (TSLA) — Breakout Playbook
🎯 Core Thesis
• Insider conviction: Musk’s ~$1B buy.
• Risk-on macro: equities at highs, liquidity supportive.
• Options reflexivity: call-heavy flows can fuel upside.
• ATH breakout (~$480–$490) = gateway to price discovery.
________________________________________
🚀 Upside Drivers to $550–$650
• Deliveries & Mix: Surprise beat + higher trim/FSD attach.
• Margins: GM stabilization + energy scaling → op margin 12–15%.
• Energy: $10–15B rev potential with infra-like multiples.
• Autonomy/Software: FSD attach, ARPU, licensing.
• Optimus/Robotics: Pilot deployments → ROI < 3 yrs adds optionality.
• Licensing Headlines: OEMs adopting NACS/FSD stack.
• Capital Markets Narrative: Packaged “software + energy + robotics” story reframes Tesla as a platform.
________________________________________
🏎️ Comparative Bull Run Lens
• Ferrari (RACE): Scarcity, orderbook, luxury multiples.
• NVIDIA (NVDA): Scarcity + ecosystem flywheel → EV/Sales premium.
• Tesla Parallel: Blend of luxury quality (energy backlogs, halo trims) + AI scarcity (cells, fleet data, Dojo).
________________________________________
📊 Valuation Bridges
• EPS Path: $9–$11 EPS × 50–60× = $450–$660.
• EV/Sales Path: $130–150B revenue × 6.5–7.5× = $550–$650.
________________________________________
📈 Technical Roadmap
• Breakout > $490 → retest holds → next legs:
o $550 / $590 / $630 / stretch $650–$690.
• Watch anchored VWAPs; ATH shelf flips to support.
• Options chase accelerates above round strikes.

looks more like a breakdown than a breakthroughWith exhausting consolidation, overbought levels at their peak, looks to test 370. Another breakthrough would have bought in 450-500 but it is too early to significantly continue to push without any discourse.
Tesla: Bullish Momentum Points to $500 Breakout Current Price: $426.07
Direction: LONG
Targets:
- T1 = $450.00
- T2 = $500.00
Stop Levels:
- S1 = $410.00
- S2 = $395.00
**Wisdom of Professional Traders:**
This analysis synthesizes insights from thousands of professional traders and market experts, leveraging collective intelligence to identify Tesla's high-probability trade setups. The wisdom of crowds principle suggests that the aggregated views from professional traders often produce high-quality forecasts. Tesla’s position as one of the most active and closely monitored equities by institutional investors amplifies the importance of consensus-driven strategies in this stock.
**Key Insights:**
Tesla has benefited from its strong electric vehicle (EV) market leadership, underpinning its growth trajectory as the EV industry expands globally. Traders highlight Tesla's ability to maintain robust operational margins despite headwinds such as rising commodity and transportation costs. Tesla’s ambitious Full Self-Driving (FSD) vision and upcoming AI developments have sparked significant enthusiasm among tech-focused investors, bolstering its long-term growth outlook.
From a technical perspective, Tesla is trading above its 50-day and 200-day moving averages, signaling upward strength. Recent trading volumes show consistent institutional accumulation, and the Relative Strength Index (RSI) remains below overbought levels, confirming room for continued upside. Professional traders expect Tesla to test the $450 level in the coming sessions, with the $500 mark identified as the next major extension point.
**Recent Performance:**
Tesla has demonstrated impressive resilience in 2025, rallying over 30% year-to-date while outperforming many of its peers in both the automotive and technology sectors. This upward momentum has been fueled by strong quarterly revenue growth and better-than-expected production numbers, despite macroeconomic concerns like inflationary pressures and volatile supply chains. Tesla’s recent price movement shows a robust support zone around $400, with increasing buying pressure pushing the price toward new highs.
**Expert Analysis:**
Market experts are largely optimistic about Tesla's future prospects, emphasizing the rapidly unfolding EV growth story and Tesla’s early entry advantages. As governments worldwide implement tighter emissions regulations and incentivize clean-energy adoption, Tesla stands out with its scalable production capacity and differentiated market position. Analysts also highlight catalysts such as the Cybertruck launch scheduled for late 2025 and margin expansion driven by cost-saving measures at key Gigafactories.
Technically, experts highlight Tesla’s bullish setup, formed by a series of higher lows and higher highs. Fibonacci retracement analysis places the next major resistance at $450, with $500 highlighted as the psychological and technical breakout point for long-term investors. Tesla’s MACD indicator remains strong, supporting an extended bullish trend.
**News Impact:**
Recent news regarding Tesla's continued success in expanding its market share in Europe and Asia has positively influenced sentiment. Additionally, CEO Elon Musk's statement outlining new advancements in robotics and AI platforms has sparked excitement about non-automotive revenue streams. Tesla's upcoming Investor Day, scheduled for Q4 2025, is likely to introduce updates on strategic innovations, driving higher investor confidence.
**Trading Recommendation:**
Based on Tesla’s technical setup, strong fundamentals, and favorable news flow, a long position is recommended. Traders should consider targeting the $450 level as the first resistance, while $500 serves as the medium-term price objective. Stops should be placed at $410 and $395, reflecting prudent risk management. Tesla’s continued momentum in 2025 makes this trade a compelling opportunity for growth-focused investors.
Do you want to save hours every week? Register for the free weekly update in your language!

Tesla (TSLA) BUYTesla (TSLA) is best known for electric cars, but its future depends on AI. From self-driving vehicles to its Optimus humanoid robot, Tesla is an AI-first company disguised as an automaker.

Tesla on Track – Golden Zone Respect Leading to $867 TargetAs we discussed in the earlier setup, Tesla retraced beautifully into the golden zone (62–79% retracement area) after sweeping sell-side liquidity. This zone aligned with a higher-timeframe order block, providing strong confluence for a bullish reaction.
The price has since respected that golden zone, confirming buyers stepped in aggressively and validating the bullish bias. From here, the market structure points toward continuation to the upside, with immediate targets at prior buy-side liquidity pools, eventually extending toward the $867 region, a level that aligns with the 100% Fibonacci projection and liquidity resting above previous highs.
This setup illustrates a textbook ICT/SMC play:
Liquidity Sweep ✅
Golden Zone Respect ✅
Strong Bullish Reaction ✅
Clear Buy-side Targets Ahead ✅
If momentum holds, Tesla remains positioned for a multi-month expansion leg toward the $867 target zone.
⚠️ DYOR: Not financial advice. Always confirm setups with your own framework and risk management.

Is this bullish enough for you? If elon is buying, I am buying. If he is gonna get trillion, I want my pie too. Help each other.
Not a trading analysis, just a fan.
"old" news on $TSLA keep recycled ...I draw to establish various trading hypotheses!
bull support: $420
greedy target: $550
--------------------------------------
Tesla news this week centers around record vehicle deliveries spurred by a last-minute rush to claim the $7,500 U.S. EV tax credit before its expiration, surging share prices, and anticipation for the unveiling of Tesla's robotaxi next week. Momentum is strong in some European markets due to Model Y updates, but overall global deliveries and profit margins remain challenged by competition and the end of EV incentives.
### Upcoming Catalyst Events
- Tesla will announce Q3 delivery figures on October 2. The results will set the tone for year-end and investor sentiment.
- The official unveiling of Tesla’s robotaxi is scheduled for October 10, positioned as a major innovation for 2026. Production lines for new affordable models are also expected to be discussed soon.
- Ongoing debates continue about Musk’s trillion-dollar compensation package, to be voted on by shareholders in November.
### Product and Market Developments
- The facelifted Model Y Performance launched in select regions with significant upgrades, but the refreshed model is not yet in the U.S. market.
- Tesla’s next major move involves scaling production of cybercab robotaxis and further advancing self-driving technology amid increasing regulatory scrutiny.
Tesla’s record delivery boost from U.S. incentives may be short-lived as competition and regulatory changes mount, but anticipation for new products and technology keeps shares strong and investors alert for next week’s pivotal announcements.

Did your Furu have this one? #DIAMOND #Island #WhiteBoySummerHighlighted the diamond for clarity in case anyone had doubts ;)
Last post of June, need 1k followers to come back.
200C 7/19 = Free Vacation
- Prophecies

TSLA – Watching for Wave 3 Extension Toward 455–460 Zone Tesla (TSLA) is completing a contracting triangle (ABCDE) as wave (iv), setting up for a potential wave (v) of 3. With delivery numbers scheduled for Thursday, momentum could build into the report, creating a rally toward the 455–460 zone, which also aligns with channel resistance and the 1.618 extension. This would complete a ABCD harmonic pattern.


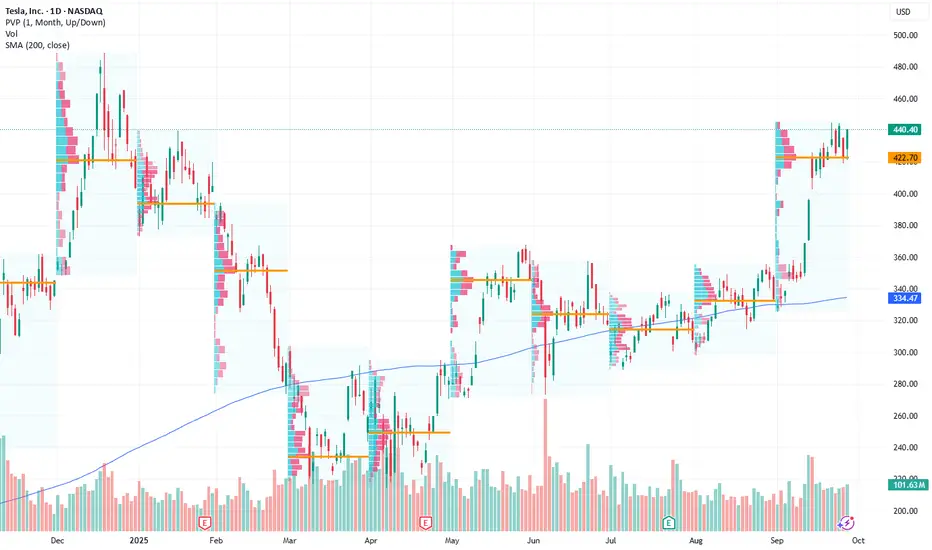
Take a bullish position on Tesla as price action shows upside moCurrent Price: $440.4
Direction: LONG
Targets:
- T1 = $470.5
- T2 = $495.0
Stop Levels:
- S1 = $423.0
- S2 = $410.5
**Wisdom of Professional Traders:**
This analysis synthesizes insights from thousands of professional traders and market experts, leveraging collective intelligence to identify high-probability trade setups. The wisdom of crowds principle suggests that aggregated market perspectives from experienced professionals often outperform individual forecasts, reducing cognitive biases and highlighting consensus opportunities in Tesla.
**Key Insights:**
Tesla has consistently shown resilience in its stock movements, benefiting from broad technological integration, market-leading innovation, and strong consumer demand for its electric vehicles. As we approach Q4 2025, the company has capitalized on expanding production capabilities in key markets, including North America and Europe, which have bolstered its outlook despite economic headwinds. Specifically, Tesla’s recent advancements in AI-driven vehicle automation and energy storage solutions have continued to sustain its competitive edge in emerging industries.
Tesla also remains a key beneficiary of government incentives related to renewable energy transformation and electric vehicle adoption. Institutions are closely monitoring Tesla’s ability to expand its gross profit margins, which could justify the current valuation and enable further upside.
In the coming months, traders anticipate significant M&A activity in the renewable energy sector, a move that could indirectly benefit Tesla’s energy ventures. These factors, combined with its proven ability to scale efficiently, suggest strong potential for further growth in its share price.
**Recent Performance:**
Tesla’s market price has climbed steadily in recent weeks, reaching $440.4 at the close on September 29, 2025. The stock saw a rally earlier in September, driven by positive earnings guidance and favorable macroeconomic conditions. Tesla’s recent ability to break above a key resistance level of $430 confirms a bullish trend and supports the outlook for achieving higher price targets. Notably, trading volume continues to increase following last week’s bullish breakout, underscoring robust investor interest.
**Expert Analysis:**
Experts emphasize Tesla’s technical setup, with key indicators such as the Relative Strength Index (RSI) showing momentum in favor of a continued uptrend. The RSI currently sits at 58, approaching overbought territory but indicating sufficient upside before major resistance constrains the movement. Analysts are also optimistic about Tesla’s expanding margins as long-term megatrends favor electric vehicle adoption and clean energy solutions.
From a technical perspective, Tesla has formed higher lows and higher highs on its daily chart, demonstrating a bullish market structure. The stock’s MACD crossover signal earlier this month supports upward momentum, while the 200-day moving average at $419 signals additional support if a pullback occurs.
**News Impact:**
Recent announcements regarding Tesla’s AI initiatives, including progress in Optimus humanoid robot development, have created a positive narrative about its technological leadership. Additionally, the opening of Tesla’s new gigafactory in Canada, focused on commercial energy storage solutions, is expected to contribute strongly to revenue growth in 2025 and beyond. The broader market’s reaction to these developments has been optimistic, further supporting the bullish sentiment. Furthermore, Tesla’s recent focus on cost control and production efficiency as shared during the Q3 earnings call has been well-received by analysts.
**Trading Recommendation:**
Given Tesla’s bullish price action, market positioning, and favorable macroeconomic environment, this is a strong opportunity for traders to take a long position. The stock’s break above $430 and recent news catalysts provide confidence in the short-term price targets of $470.5 and $495.0. While caution should be maintained due to potential volatility, the clear upward trajectory signals robust buy-side demand. Positioning with appropriate stop-loss levels at $423 and $410.5 ensures risk control, making this set-up appealing to both retail and institutional investors.
Do you want to save hours every week? Register for the free weekly update in your language!
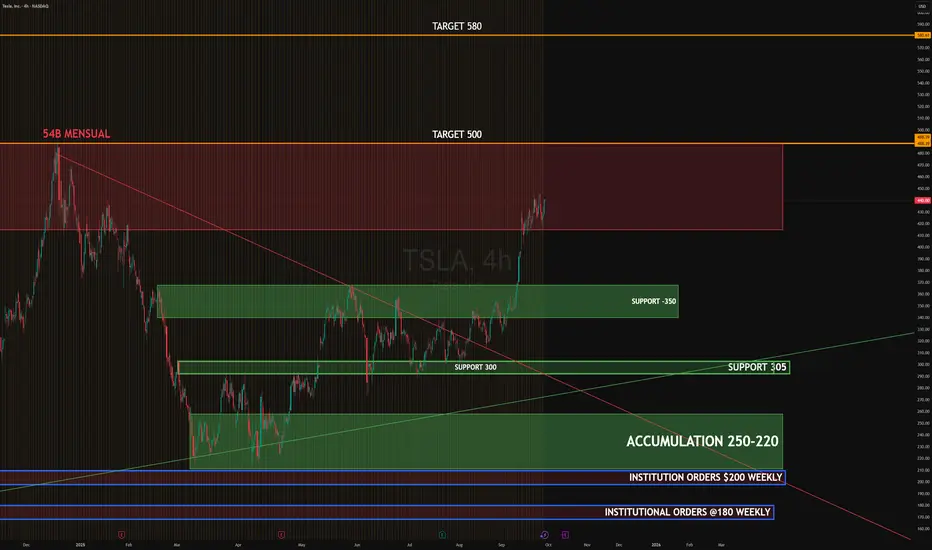
TSLA SEP - OCT 2025TSLA is consolidating below a major supply zone near 450, showing signs of distribution after the recent rally. Strong supports remain at 350 and 305, with a broader accumulation area between 250–220 tied to institutional orders. Price action suggests buyers remain in control unless 350 breaks.
Upside target: 500, with extension to 580 if momentum continues
Downside target: 350, then 305 if pressure builds
#TSLA #globaltrade #investment #investing #stockmarket #wealth #realestate #markets #economy #finance #money #forex #trading #price #business #currency #blockchain #crypto #cryptocurrency #airdrop #btc #ethereum #ico #altcoin #cryptonews #Bitcoin #ipo
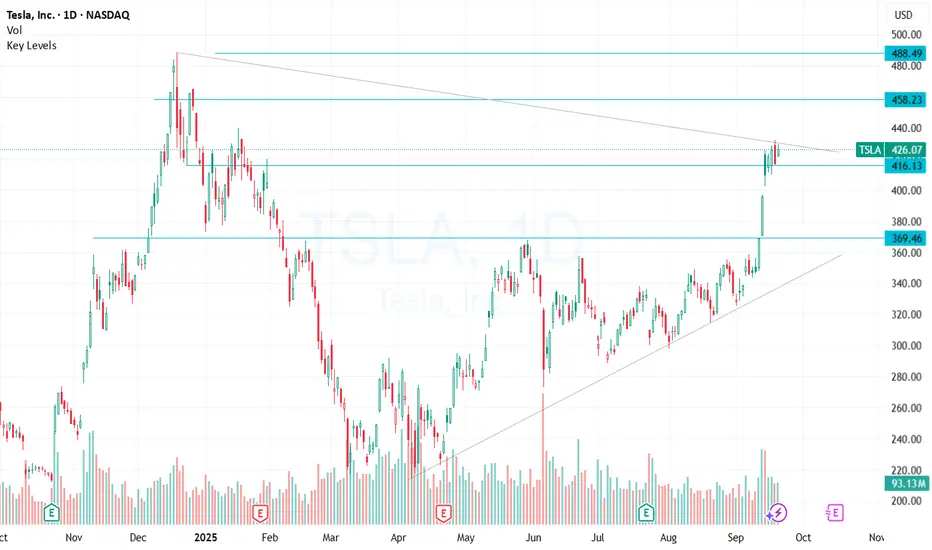
Tesla bullish 📊 NASDAQ:TSLA Weekly Chart – Sept 27, 2025
Tesla is pushing higher, now trading at $440.40 (+4.02%), challenging major resistance levels.
🔴 Key Resistance Zones:
$488–$495 → Multi-top rejection zone
$580 → Macro resistance (2021 highs)
Watch for potential rejection unless strong volume confirms breakout
🟢 Strong Support Levels:
$420 / $400 / $390 → Key short-term demand
$332 / $322 → Previous resistance flipped to support
$288 / $259 / $247 → High confluence support cluster
Long-term trendline still intact (white diagonal line)
⚠️ If $488 breaks, TSLA could revisit $580
✅ Holding $420–$400 keeps bulls in control
📉 Below $332 could trigger broader pullback
#TSLA #Tesla #Stocks #Trading #TechnicalAnalysis #Investing #NASDAQ

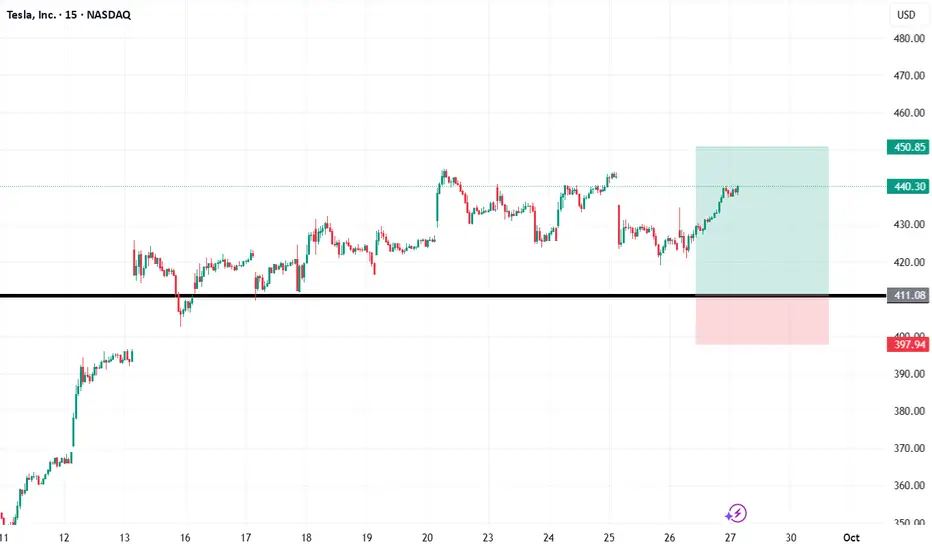
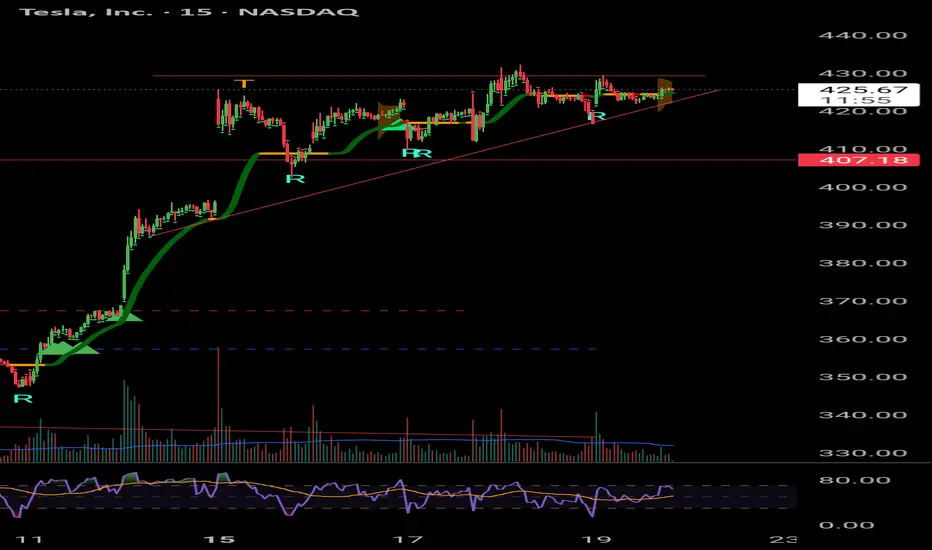
TSLA Long Idea: Testing Key Support at $411Hello, fellow traders,
This is a technical analysis of Tesla (TSLA) on the 15-minute chart. The purpose of this post is to outline a potential trading setup based on price action and key technical levels.
Analysis:
We can observe a clear horizontal support level forming around the $411.00 area. This level has been a significant pivot point in the recent past, with the price showing a strong reaction after testing it. The presence of such a support level suggests a potential area where buying interest may step in, providing a foundation for a possible move higher.
The chart displays a hypothetical long trade setup originating from this support zone, illustrating a practical application of this analysis.
Potential Trade Plan:
Entry: An entry is considered around $411.08, anticipating a bounce from the retest of the established support.
Stop Loss: A stop loss is placed at approximately $397.94. This level is positioned below the support zone and a recent swing low to manage risk should the support level fail to hold.
Take Profit: The profit target is set near $450.85. This level could act as resistance and represents a logical area to take profits.
This setup provides a favorable risk-to-reward ratio of approximately 3:1, which is a key component of a sound risk management strategy.
Disclaimer: This is not financial advice. The information and analysis provided are for educational and informational purposes only. Trading involves significant risk, and you should always conduct your own research and analysis before making any investment decisions. Trade responsibly.