DYDXUSDT UPDATE#DYDX
UPDATE
DYDX Technical Setup
Pattern: Bullish Falling Wedge Pattern
Current Price: $1.92
Target Price: $2.40
Target % Gain: 25.22%
EURONEXT:DYDX is breaking out of a falling wedge pattern on the 1D timeframe. Current price is $1.92 with a target near $2.40, showing about 25% potential upside. The breakout confirms bullish momentum with structure favoring continuation. Always use proper risk management.
Time Frame: 1D
Risk Management Tip: Always use proper risk management.
DYDXUSDT.3S trade ideas

#DYDX/USDT Breakout from Falling Wedge |
#DYDX
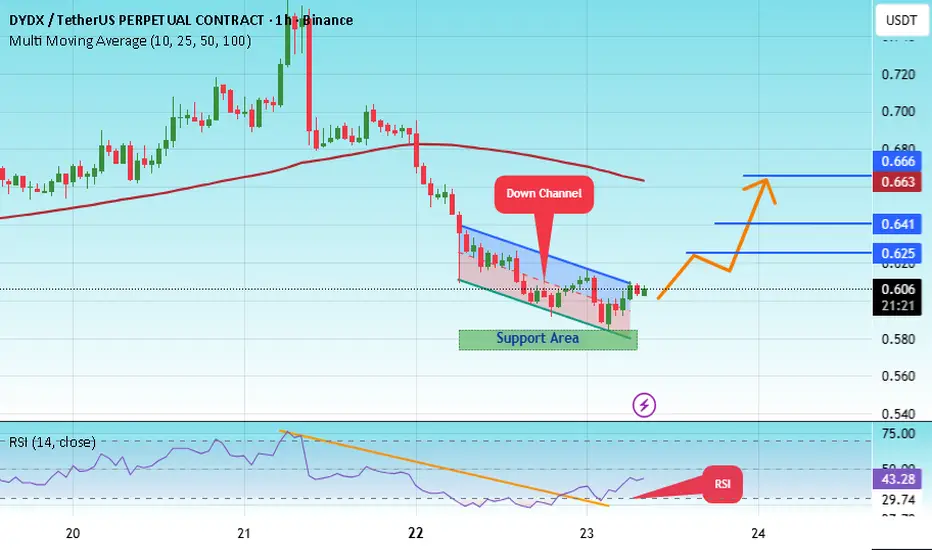
The price is moving within a descending channel on the 1-hour frame, adhering well to it, and is heading for a strong breakout and retest.
We have a bearish trend on the RSI indicator that is about to be broken and retested, which supports the upward breakout.
There is a major support area in green at 0.577, representing a strong support point.
We are heading for consolidation above the 100 moving average.
Entry price: 0.603
First target: 0.625
Second target: 0.641
Third target: 0.663
Don't forget a simple matter: capital management.
#DYDX/USDT Breakout from Falling Wedge |#DYDX
The price is moving within a descending channel on the 1-hour frame, adhering well to it, and is heading for a strong breakout and retest.
We have a bearish trend on the RSI indicator that is about to be broken and retested, which supports the upward breakout.
There is a major support area in green at 0.577, representing a strong support point.
We are heading for consolidation above the 100 moving average.
Entry price: 0.603
First target: 0.625
Second target: 0.641
Third target: 0.663
Don't forget a simple matter: capital management.
When you reach the first target, save some money and then change your stop-loss order to an entry order.
For inquiries, please leave a comment.
Thank you.

DYDX -98% Secondary trend Holders reset. Inverse H&S 09 15 2025Logarithm 3 days. In the capitulation zone on the super negative, a reversal pattern of an inverted head and shoulders is formed. Its implementation of goals is to enter when the price overcomes the resistance of the pattern.
Main trend. -98%.
DYDX Main trend. 30 08 2024
15 09 2025
Manipulations from the project developers. Most recently in June (trend minimum, negative) - the developments froze (turned to zero) the tokens of about 40,000 DYDX holders. They blocked the token migration bridge from the ETH network to the DYDX network. In other projects, such migration is always open (for example, from the fact that I have EWT (EWTB), because many holders, after purchasing an asset and withdrawing it to a wallet, do not particularly follow the events of the projects. But, with DYDX, this did not work. Balances on wallets, and already a super depreciated token (from the peak of pumping, a natural -98% depreciation in liquidity), literally turned into zero. Probably, it is more offensive not to the hamsters who bought on the listing, news and hype, but to those people who gained from supporting a long-term downward channel.
There are rumors that for 10% of the cost, developers make an exchange of network tokens. If this is true, then from the standpoint of the morality of the developers, this is the moral bottom.

DYDX Main trend 30 08 2024Logarithm. Time frame 1 week. Horizontal channel. Beginning of entry into the capitulation zone (under channel support). Formation of a locally descending wedge, in the final phase of formation (volatility narrowing).
Line chart.
Secondary trend. Wedge.

DYDX Secondary Trend. Capitulation Zone. Wedge. 30 08 2024Logarithm. Time frame 3 days.
Line chart.
Main trend and this secondary trend zone in it.
DYDX Main trend 30 08 2024

#DYDX/USDT Breakout from Falling Wedge | #DYDX
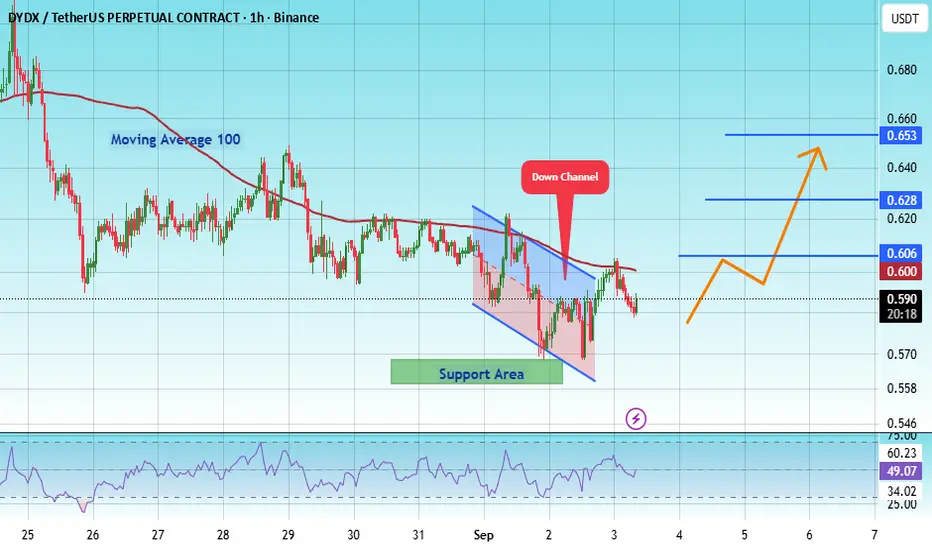
The price is moving within a descending channel on the 1-hour frame, adhering well to it, and is heading for a strong breakout and retest.
We have a bearish trend on the RSI indicator that is about to be broken and retested, which supports the upward breakout.
There is a major support area in green at 0.563, which represents a strong support point.
For inquiries, please leave a comment.
We are in a consolidation trend above the 100 moving average.
Entry price: 0.588
First target: 0.600
Second target: 0.628
Third target: 0.653
Don't forget a simple matter: capital management.
When you reach the first target, save some money and then change your stop-loss order to an entry order.
For inquiries, please leave a comment.
Thank you.
DYDXUSDT UPDATE#DYDX
UPDATE
DYDX Technical Setup
Pattern : Bullish Falling Wedge Pattern
Current Price: $0.6186
Target Price: $0.78
Target % Gain: 25.35%
Technical Analysis: DYDX has broken out of a falling wedge on the 4H chart, confirming bullish momentum. The structure shows strong breakout with potential continuation towards $0.78 as long as price holds above the breakout zone.
Time Frame: 4H
Risk Management Tip: Always use proper risk management.

DYDXUSDT chart analysisDydx has reached a key support , which holds the potential for upward move from this area. It is suitable for long-term buying.
Disclaimer: This is not financial advice. Please do your own research before making any investment decisions.

#DYDX/USDT#DYDX
The price is moving within an ascending channel on the 1-hour frame, adhering well to it, and is on track to break it strongly upwards and retest it.
We have support from the lower boundary of the ascending channel, at 0.612.
We have a downtrend on the RSI indicator that is about to break and retest, supporting the upside.
There is a major support area in green at 0.606, which represents a strong basis for the upside.
Don't forget a simple thing: ease and capital.
When you reach the first target, save some money and then change your stop-loss order to an entry order.
For inquiries, please leave a comment.
We have a trend to hold above the 100 Moving Average.
Entry price: 0.656.
First target: 0.670.
Second target: 0.690.
Third target: 0.717.
Don't forget a simple thing: ease and capital.
When you reach the first target, save some money and then change your stop-loss order to an entry order.
For inquiries, please leave a comment.
Thank you.


inverted Head & Shoulders pattern🚨 $DYDX Breakout Alert! 🚨
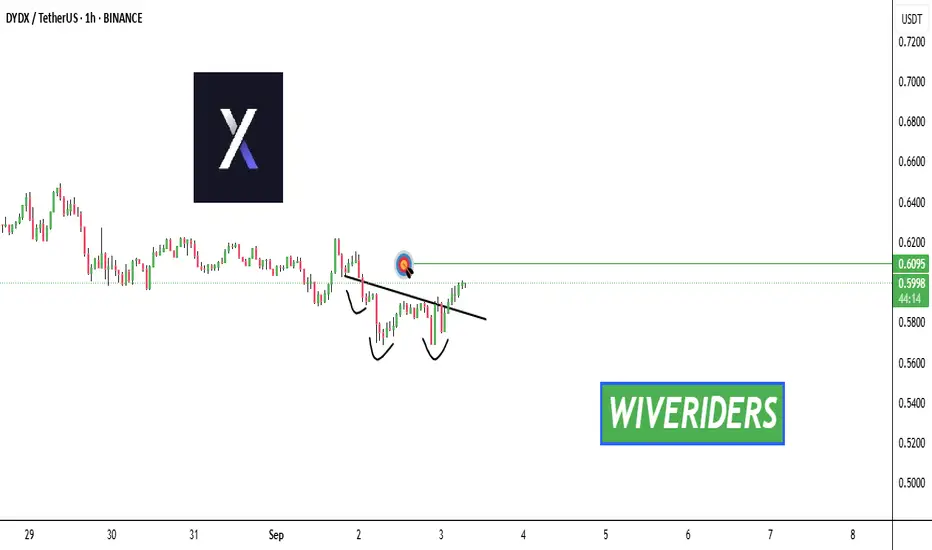
$DYDX has already broken out above the neckline of its inverted Head & Shoulders pattern ✅
👉 The first target is now the green line level 🎯
⚠️ Key point: Watch for retests of the neckline to confirm strength.
👉 This breakout signals bullish continuation with buyers firmly in control 📈
DYDX/USDT — Testing Historical Support: Bounce or Breakdown?Full Analysis:
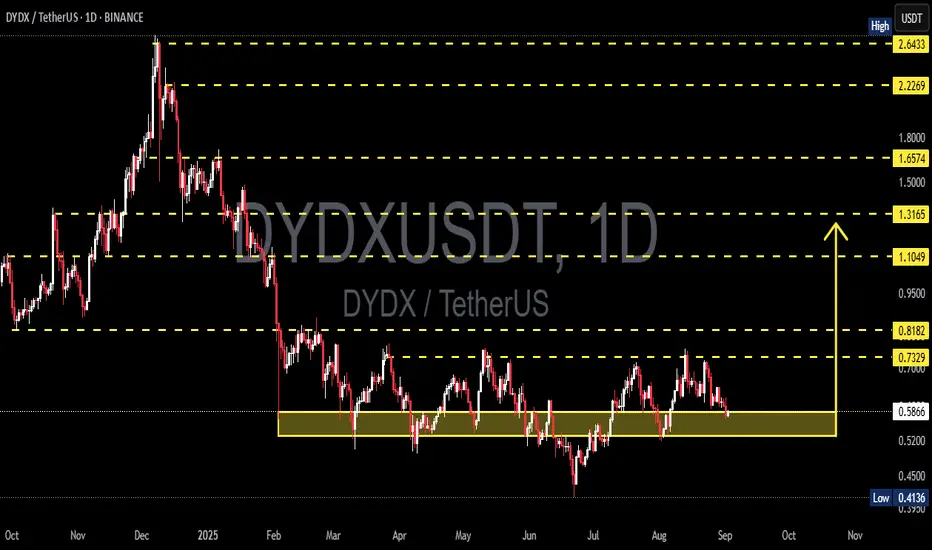
DYDX is currently standing at a critical decision point. The chart shows price retesting the demand zone $0.50–$0.59 (yellow box), which has acted as strong support multiple times since March, June, and August 2025. This zone remains the last stronghold before price revisits the previous low at $0.41.
On the macro view, DYDX is still in a downtrend since the peak at $2.64 (Dec 2024). However, in the mid-term, price is moving sideways inside a broad range of $0.41–$0.82, suggesting accumulation or consolidation before the next major directional move.
---
🔹 Bullish Scenario
If the $0.50–$0.59 zone holds once again, a strong rebound is possible.
Early confirmation: a daily close above $0.64–$0.68, showing buyer rejection at the demand area.
Next resistance targets: $0.73 (range high) → if broken, extension targets are $0.82 → $1.10 → $1.31.
Additional bullish signals: long lower wick candles around support, increasing buy volume, and formation of higher lows.
📈 Swing strategy (bullish): accumulate around $0.52–$0.59, stop-loss below $0.48, profit targets at $0.73–$0.82.
---
🔻 Bearish Scenario
If price fails and closes daily below $0.50, a confirmed breakdown is in play.
Downside targets: $0.41 (previous low), with further bearish continuation possible if that level breaks.
Breakdown of this zone will confirm a continuation of the macro downtrend, likely forming new lower lows.
Additional bearish confirmations: strong daily close below $0.50, heavy sell volume, repeated lower highs pattern.
📉 Swing strategy (bearish): short after breakdown & failed retest of $0.50–$0.52, stop-loss above $0.60, first target $0.41.
---
🔍 Pattern & Market Structure
Range-bound: DYDX has been consolidating within $0.41–$0.82 for months.
Demand Zone in Play: The $0.50–$0.59 zone has been tested three times — each test weakens it, but also increases chances of a strong bounce if buyers step in.
Decision Point: Price action here will decide whether DYDX forms a base for reversal or continues its macro bearish trend.
---
📌 Conclusion
DYDX is testing a critical historical support at $0.50–$0.59. Holding this zone could spark a rebound toward $0.73–$0.82, but a confirmed breakdown below $0.50 would likely extend the bearish trend toward $0.41.
Traders should wait for daily close confirmation before committing, as this area is the true “battle zone” between bulls and bears.
⚠️ Disclaimer: This analysis is not financial advice. Always manage risk and use stop-loss according to your strategy.
#DYDX #DYDXUSDT #Crypto #Altcoins #TechnicalAnalysis #SwingTrading #SupportResistance #PriceAction
DYDX SET FOR POSITIVE GAINSWatch out from now till the next month or two. Heikin Ashi now green on the monthly.
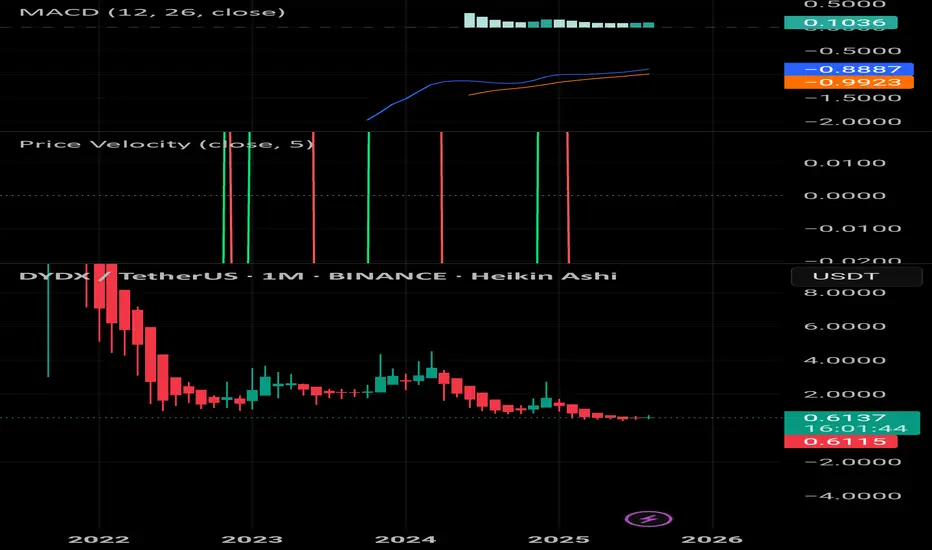
DYDXUSDT 1D#DYDX chart is showing the potential formation of a Golden Cross on the daily timeframe. We believe it will break above the resistance zone soon. If this happens, the potential targets are:
🎯 $0.8854
🎯 $0.9967
🎯 $1.1552
🎯 $1.3571
⚠️ As always, use a tight stop-loss and apply proper risk management.

DYDXUSDT Forming Bullish PotentialDYDXUSDT is currently showing strong bullish potential as price action is forming a higher-low structure, signaling accumulation before the next breakout. The chart highlights a critical resistance zone where multiple rejections have occurred in the past, but this time volume and investor sentiment are suggesting a possible breakout to the upside. With good volume supporting the move, DYDXUSDT appears to be setting up for a strong bullish wave.
The expected gain of 40% to 50%+ makes DYDXUSDT an attractive setup for short- to mid-term traders. Once the price successfully clears the highlighted resistance zone, a rapid continuation move could follow, targeting higher levels around \$1.00 and beyond. Technical indicators further strengthen this outlook, with market momentum pointing towards sustained buying pressure.
Investors are increasingly showing confidence in DYDX, and the market structure suggests that institutional and retail interest is gradually building up. If momentum continues, DYDXUSDT could become one of the stronger performing altcoins in the coming sessions, offering solid risk-to-reward opportunities for traders who anticipate the breakout in advance.
✅ Show your support by hitting the like button and
✅ Leaving a comment below! (What is You opinion about this Coin)
Your feedback and engagement keep me inspired to share more insightful market analysis with you!

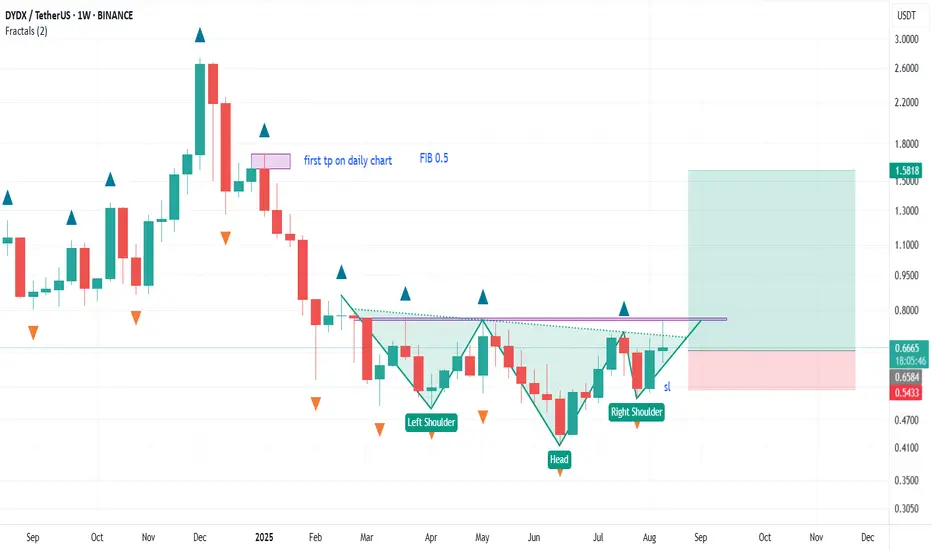
dydx weekly chart as we can see after a long term down trend the price has formed a head and shoulder pattern .
if price can break up the neck line on daily chart we will have the first signal.
SL on weekly chart and weekly strategy is 4 aug candle
TP : 6 JAN CANDLE which is the 0.5 fib ret
for accurate entrance daily or 4 hours chart should be controled
thank you
DYDX LONG SET-UPBINANCE:DYDXUSDT
dydx Looking Bullish , waiting for a small retracement
expecting 40-50% Upside Rally
spot buy only

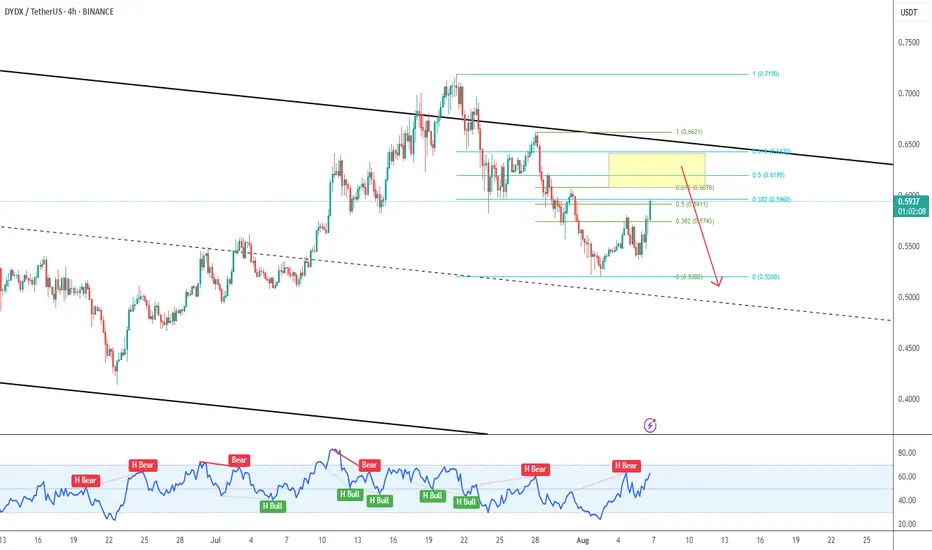
DYDX : Further downside expected
▶️ DYDX remains stuck inside the black descending channel, and the recent breakout attempt was just a fakeout.
▶️ On the 4H chart, there are no clear signs of a reversal, so the recent upside move appears to be corrective.
▶️ The yellow zone, marked by a confluence of Fibonacci levels and mid-range resistance, is a key area to monitor for potential downside reversals on lower timeframes.
▶️ If a reversal plays out, the first target would be a retest of the 0.5200 low.
DYDX - long!DYDX is extremly oversold. The bottom formation is visible. Correction seems to be ended. Im in long from 0.50$ and I will be adding to my long in time. The job is to exit somewhere between 4-6$. Cheers!

DYDX Approaching Make-or-Break Pivot for Major ReversalThe DYDX/USDT weekly chart outlines a complex corrective WXY structure with price currently approaching the Immediate Drop Target Zone (IDTZ) near $0.50. A failure here could lead to a drop toward the Extreme Demand Zone around $0.079. However, reclaiming $1.132 and breaking above the descending trendline could trigger a bullish reversal toward the Important Supply Zone ($4.42–$4.55).

dYdX Bottom Consolidation Continues, Bullish NextHere you are looking at the formation of a bottom. The formation is a process not a single day event. It can take months for a bottom to fully form.
The way you know this to be true is because there is no downtrend. There are no new lows.
DYDX has been sideways now for 179 days, 6 months. Since early February 2025. In just three months, between December 2024 and March 2025, there is a very strong decline; lower highs and lower lows. A bearish move, a down-wave, a downtrend.
Ever since February the downtrend is no more. Rather than new major lows we have shy lower lows and finally not even that, no new lows. You can see the pattern how the market turned from bearish to sideways. This is the transition period. From sideways it will turn bullish, bullish goes next.
This is the point in time when most people will lose patiently and fold at a loss. Sell at the bottom, near support. This is the most important time to be patient, to accumulate, to even buy more and hold because we are looking at bottom prices. When prices are trading at the bottom and you are a bull, you can't go wrong.
Buy and hold. Continue holding because the market will soon turn.
Namaste.

#DYDX/USDT#DYDX
The price is moving within a descending channel on the 1-hour frame, adhering well to it, and is on its way to breaking strongly upwards and retesting it.
We have support from the lower boundary of the descending channel, at 0.640.
We have a downtrend on the RSI indicator that is about to be broken and retested, supporting the upside.
There is a major support area in green at 0.638, which represents a strong basis for the upside.
Don't forget a simple thing: ease and capital.
When you reach the first target, save some money and then change your stop-loss order to an entry order.
For inquiries, please leave a comment.
We have a trend to hold above the 100 Moving Average.
Entry price: 0.650
First target: 0.669
Second target: 0.690
Third target: 0.717
Don't forget a simple thing: ease and capital.
When you reach your first target, save some money and then change your stop-loss order to an entry order.
For inquiries, please leave a comment.
Thank you.
