GER40 waiting good price for long
introday long for ger40. Now it's too expensive to buy. I''l wait it lower
Trade ideas

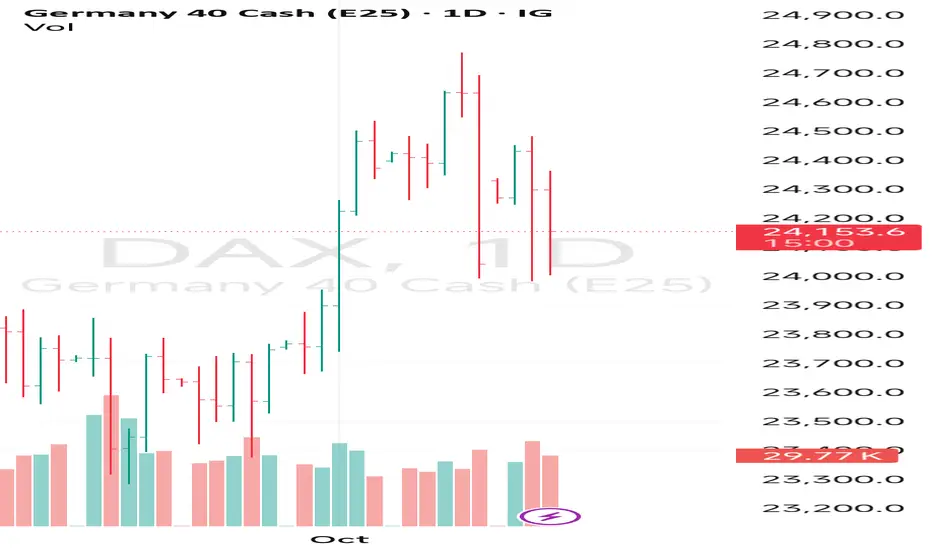
DAX/GER30 - DOOR OF OPPORTUNITY OPENING Team, I've been lazy the last few days, but I did very well with DAX scalping from 24025 toward 24175 and 24250. I have discussed all the trade in my room discussion.
Let's go LONG at 23996-24025 ranges STOP loss 60 points or 23950
Once it hit 24100 - take partial and bring stop loss to BE
Target 2 at 24175-24250
LETS GO
Dax for Thursday October 23rdThe pattern has not got bullish.Plenty of overhead resistance though.Lets see who wins

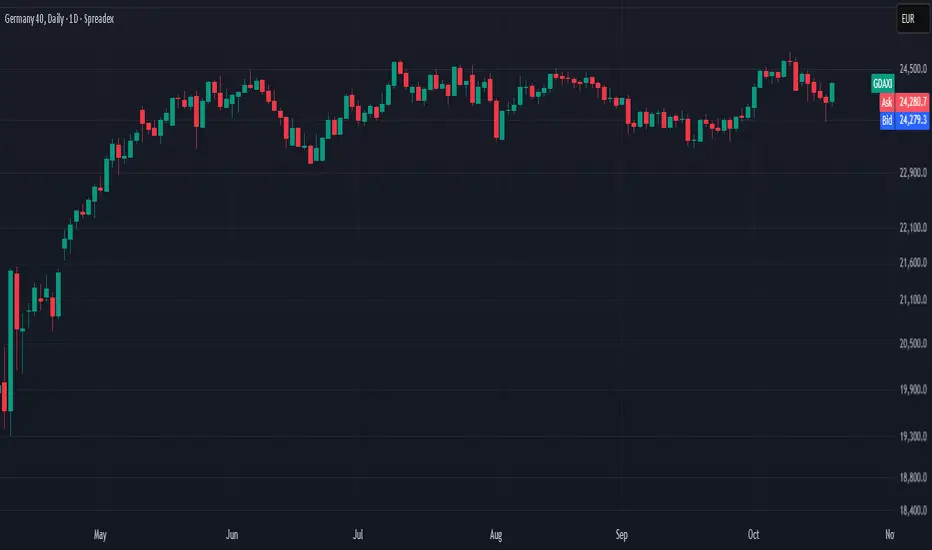
Technical Analysis WeeklyGermany 40 has re-entered its trading range after a failed bullish breakout. Price trades at 24,057, slightly below its VWAP of 24,206. RSI at 48.4 suggests subdued momentum. Support lies at 23,683, while resistance is 24,729.
UK 100 maintains a bullish trend but is undergoing a corrective phase. Price has pulled back to 9,394, below its VWAP of 9,403. The RSI at 51.4 indicates weak bullish momentum. Support is at 9,287, and resistance stands at 9,558.
Wall Street remains in a bullish trend but continues to correct lower, currently at 46,303, on top of its VWAP. RSI at 52.6 shows a neutral stance. Support lies at 45,630, and resistance is estimated at 46,911.
Brent Crude is turning bearish within its broader range. Price has fallen to 6,094, below the VWAP of 6,422. RSI at 30.9 indicates strongly bearish momentum. Support sits at 5,983, while resistance is at 6,860.
Gold extends its bullish run in a strong impulsive phase, trading at 4,259, significantly above the VWAP of 4,015 but down a bit from all time highs. The RSI at 75.5 signals less overbought conditions. Support is way down at 3,677, and resistance is at 4,353.
EUR/USD holds its trading range, now trading at 1.1666, right next to its VWAP. RSI at 49.0 signals neutral momentum. Support is at 1.1556, and resistance is at 1.1782.
GBP/USD stays in a bullish trend but is correcting sideways, trading at 1.3423, slightly above the VWAP of 1.3400. RSI at 49.8 shows consolidation. Support is at 1.3299, with resistance at 1.3514.
USD/JPY is in a pullback following its bullish range-breakout, currently at 150.67, just above its VWAP of 150.30. The RSI at 54.2 reflects moderate bullish momentum. Support lies at 146.60, and resistance is at 154.01.
#DAX, next leg downPreviously, I called for a short of DAX for a move down to 23700/23800 (). We got 450 points down, hit my 23700 level and rebounded 700 points, to perfection.
Market seemed weak now; could see another leg down, back to 23680 and possibly to 23200.

Dax into the open.22nd OctoberThat looks to be the pattern we are trading.Could quite easily pop to 24.5 K
Lets see what happens
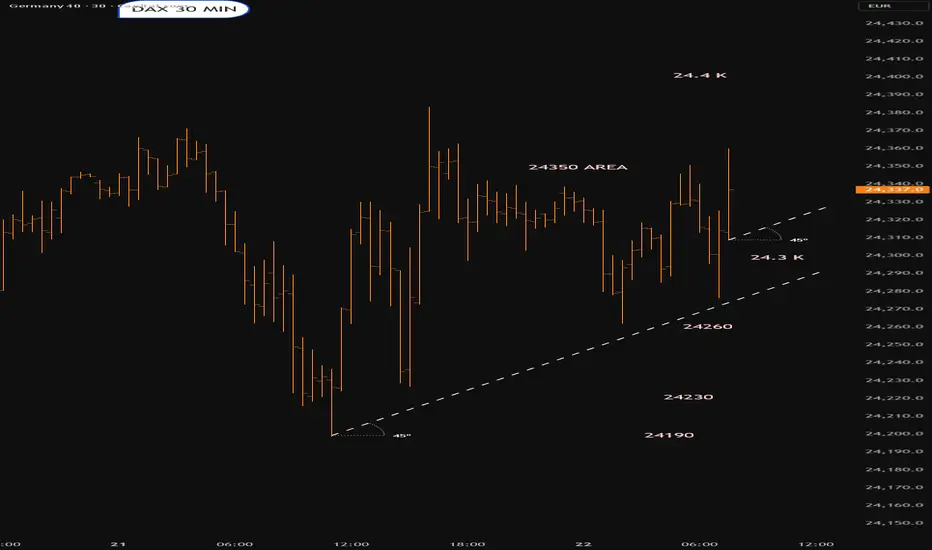
DAX into the open.Tuesday 21st OctoberThat looks to be the pattern we are trading.Uneless that resitance gets blown out.Lets see what happens

Expecting lower prices on German dax ( 15-10-2025)1. there is a very likely that DAX will sell off after sweeping Asian session's highs from the 4hr AOI
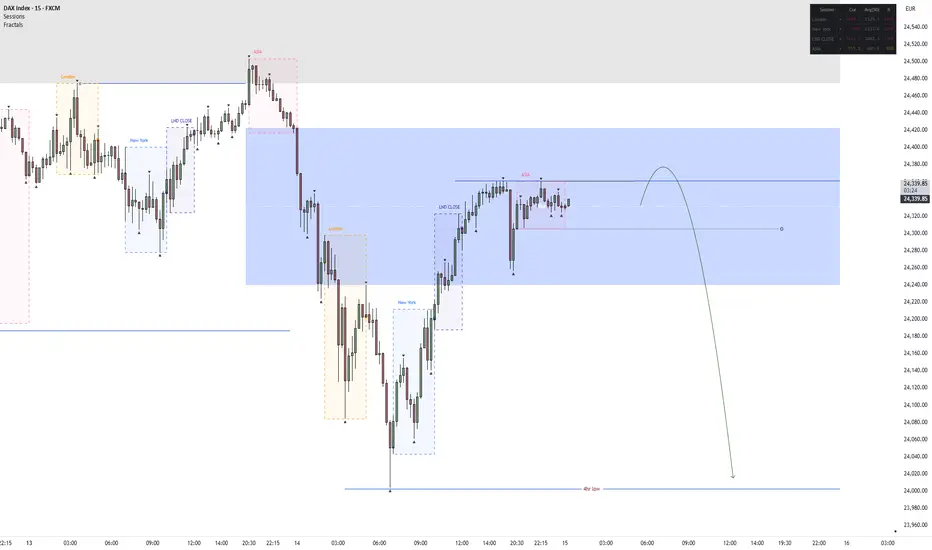
GER40 Review October 14 2025Short-term price movement ideas.
The price has completed a monthly liquidity grab, after which we received confirmation on the weekly chart — forming the conditions for a downward move, at least toward the weekly long FVG.
At the moment, price has tested the daily short FVG, from which a potential 4H structure break and new FVG are forming. If this break occurs, the next step would be to wait for the 4H area of interest; upon confirmation, short positions could be opened with the target of taking out the previous low.
Be flexible, adapt to the market, and the results will come quickly. Good luck to everyone.

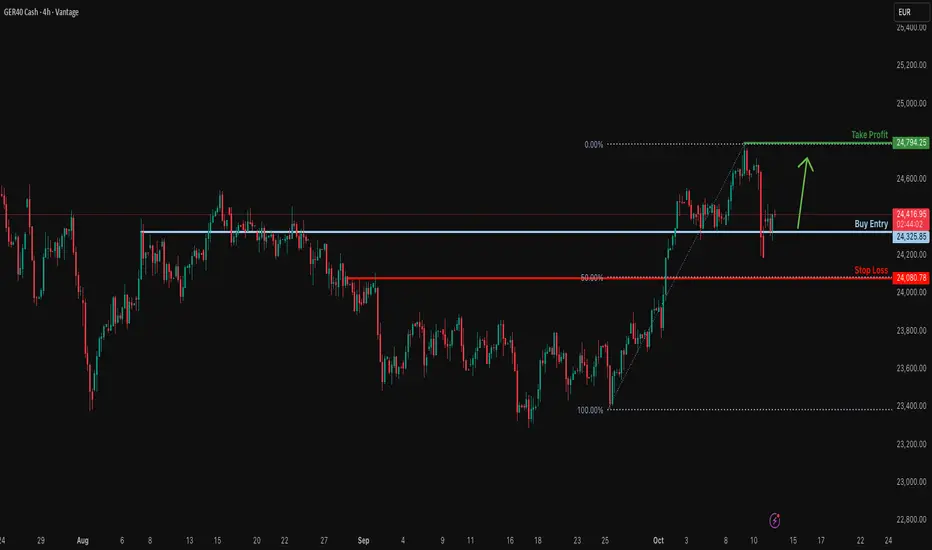
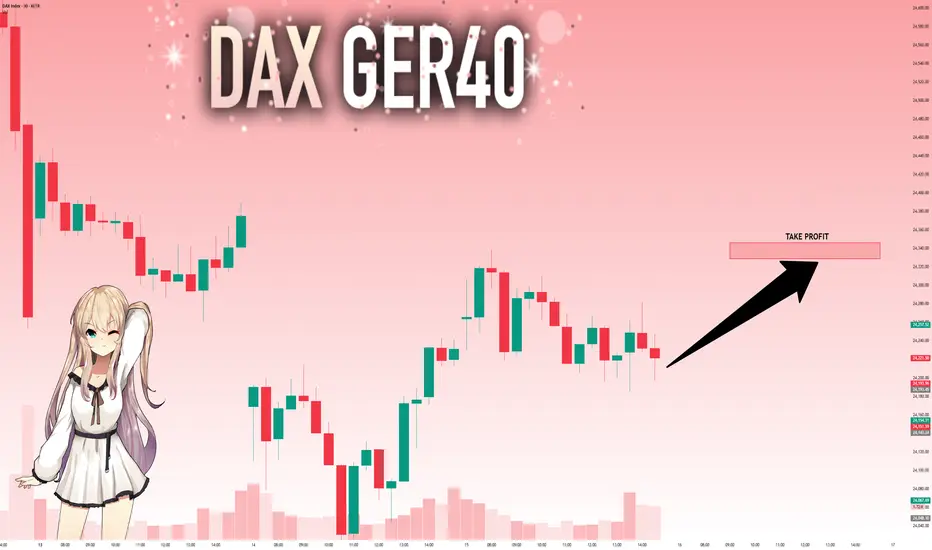
Bullish continuation setup?GER40 has bounced off the support level, which is an overlap support and could potentially rise from this level to our take profit.
Entry: 24,325.85
Why we like it:
There is an overlap support level.
Stop loss: 24,080.78
Why we like it:
There is a pullback support that lines up with the 50% Fibonacci retracement.
Take profit: 24,794.25
Why we like it:
There is a swing high resistance level.
Enjoying your TradingView experience? Review us!
Please be advised that the information presented on TradingView is provided to Vantage (‘Vantage Global Limited’, ‘we’) by a third-party provider (‘Everest Fortune Group’). Please be reminded that you are solely responsible for the trading decisions on your account. There is a very high degree of risk involved in trading. Any information and/or content is intended entirely for research, educational and informational purposes only and does not constitute investment or consultation advice or investment strategy. The information is not tailored to the investment needs of any specific person and therefore does not involve a consideration of any of the investment objectives, financial situation or needs of any viewer that may receive it. Kindly also note that past performance is not a reliable indicator of future results. Actual results may differ materially from those anticipated in forward-looking or past performance statements. We assume no liability as to the accuracy or completeness of any of the information and/or content provided herein and the Company cannot be held responsible for any omission, mistake nor for any loss or damage including without limitation to any loss of profit which may arise from reliance on any information supplied by Everest Fortune Group.

DAX, Weak StillDespite the huge recovery in US indices over the past few days, DAX continued to be weak and even made new lows yesterday. Could see further downside to 23700-800 or so, confluence of supports before a strong bounce.
Of course, a lot depends on how US indices perform today. SPX need to hold at current 6730 level, NDX 24980 and come down for this plan to work out.


Sell Germany 40 Index#Dax broke 24185 support levels on the daily chart.
The short term trend is down.
ShortTrading the DAX (German stock index) involves significant risk. The DAX is highly volatile and can move sharply in either direction due to economic data, political events, or global market sentiment.
When trading the DAX — whether through CFDs, futures, or ETFs — you are often using leverage, which means you control a large position with a small amount of capital. While leverage can increase potential profits, it can also magnify losses, and you may lose more than your initial investment if risk is not managed properly.

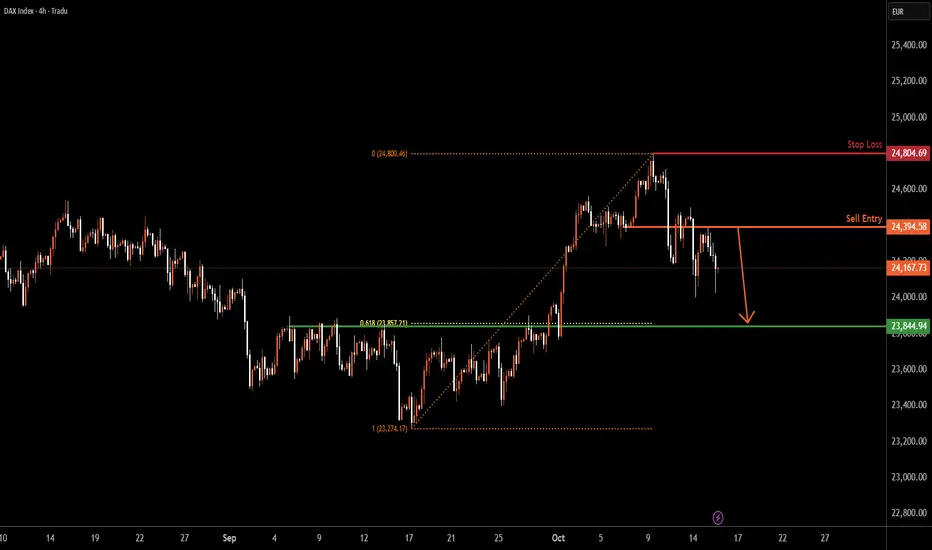
GER30 H4 | Sharp Bearish Decline ExpectedGER30 has rejected the sell entry, which is an overlap resistance, and could drop from this level to the downside
Sell entry is at 24,394.58, which is an overlap resistance.
Stop loss is at 24,656.71, which is a swing high resistance.
Take profit is at 23,844.94, whichis a pullback support that aligns with he 61.8% Fibonacci retracement.
High Risk Investment Warning
Trading Forex/CFDs on margin carries a high level of risk and may not be suitable for all investors. Leverage can work against you.
Stratos Markets Limited (tradu.com ):
CFDs are complex instruments and come with a high risk of losing money rapidly due to leverage. 65% of retail investor accounts lose money when trading CFDs with this provider. You should consider whether you understand how CFDs work and whether you can afford to take the high risk of losing your money.
Stratos Europe Ltd (tradu.com ):
CFDs are complex instruments and come with a high risk of losing money rapidly due to leverage. 66% of retail investor accounts lose money when trading CFDs with this provider. You should consider whether you understand how CFDs work and whether you can afford to take the high risk of losing your money.
Stratos Global LLC (tradu.com ):
Losses can exceed deposits.
Please be advised that the information presented on TradingView is provided to Tradu (‘Company’, ‘we’) by a third-party provider (‘TFA Global Pte Ltd’). Please be reminded that you are solely responsible for the trading decisions on your account. There is a very high degree of risk involved in trading. Any information and/or content is intended entirely for research, educational and informational purposes only and does not constitute investment or consultation advice or investment strategy. The information is not tailored to the investment needs of any specific person and therefore does not involve a consideration of any of the investment objectives, financial situation or needs of any viewer that may receive it. Kindly also note that past performance is not a reliable indicator of future results. Actual results may differ materially from those anticipated in forward-looking or past performance statements. We assume no liability as to the accuracy or completeness of any of the information and/or content provided herein and the Company cannot be held responsible for any omission, mistake nor for any loss or damage including without limitation to any loss of profit which may arise from reliance on any information supplied by TFA Global Pte Ltd.
The speaker(s) is neither an employee, agent nor representative of Tradu and is therefore acting independently. The opinions given are their own, constitute general market commentary, and do not constitute the opinion or advice of Tradu or any form of personal or investment advice. Tradu neither endorses nor guarantees offerings of third-party speakers, nor is Tradu responsible for the content, veracity or opinions of third-party speakers, presenters or participants.
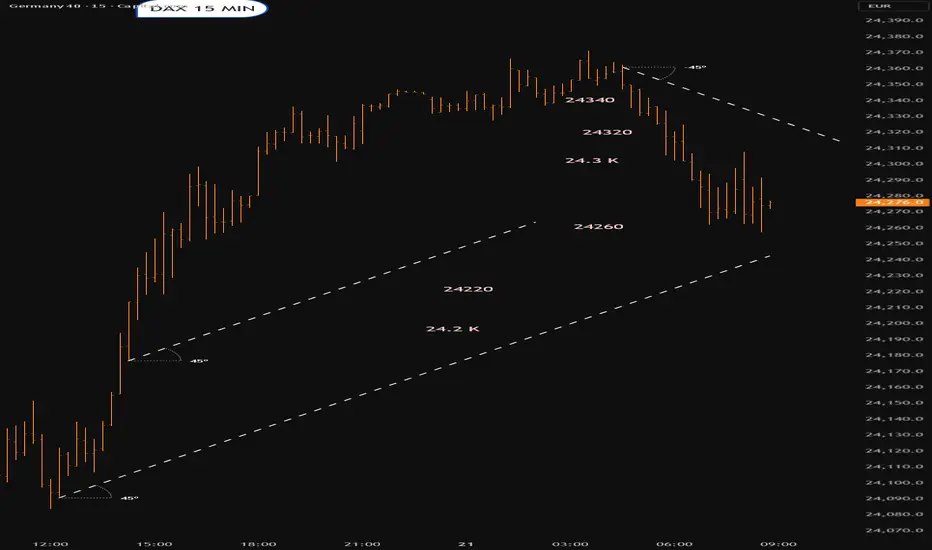
DAX overbought pullback supported at 23970The DAX remains in a bullish trend, with recent price action indicating a potential overbought pullback within the broader uptrend.
Support Zone: 23970 – a key level from previous consolidation. Price is currently testing or approaching this level.
A bullish rebound from 23970 would confirm ongoing upside momentum, with potential targets at:
24490 – initial resistance
24580 – psychological and structural level
24770 – extended resistance on the longer-term chart
Bearish Scenario:
A confirmed break and daily close below 23970 would weaken the bullish outlook and suggest deeper downside risk toward:
23870 – minor support
23770 – stronger support and potential demand zone
Outlook:
Bullish bias remains intact while the Dax40 holds above 23970. A sustained break below this level could shift momentum to the downside in the short term.
This communication is for informational purposes only and should not be viewed as any form of recommendation as to a particular course of action or as investment advice. It is not intended as an offer or solicitation for the purchase or sale of any financial instrument or as an official confirmation of any transaction. Opinions, estimates and assumptions expressed herein are made as of the date of this communication and are subject to change without notice. This communication has been prepared based upon information, including market prices, data and other information, believed to be reliable; however, Trade Nation does not warrant its completeness or accuracy. All market prices and market data contained in or attached to this communication are indicative and subject to change without notice.


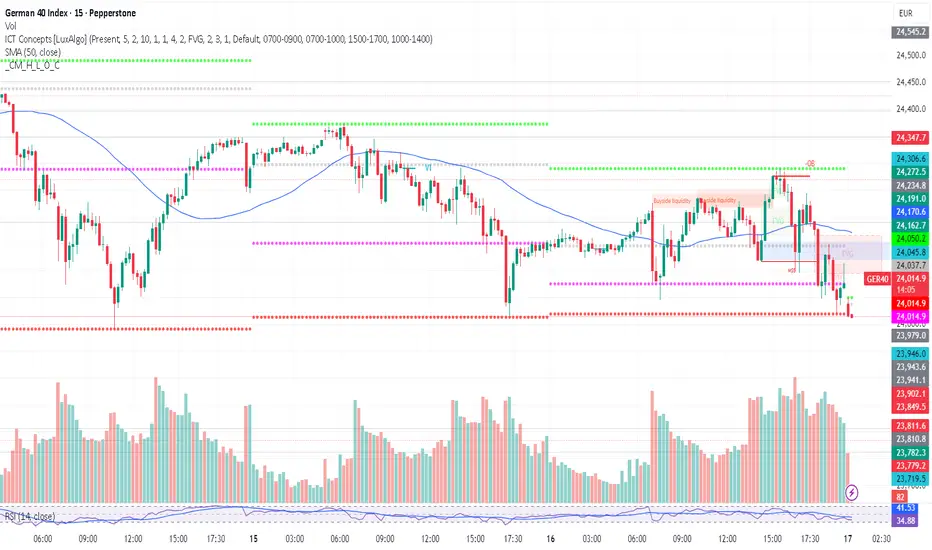
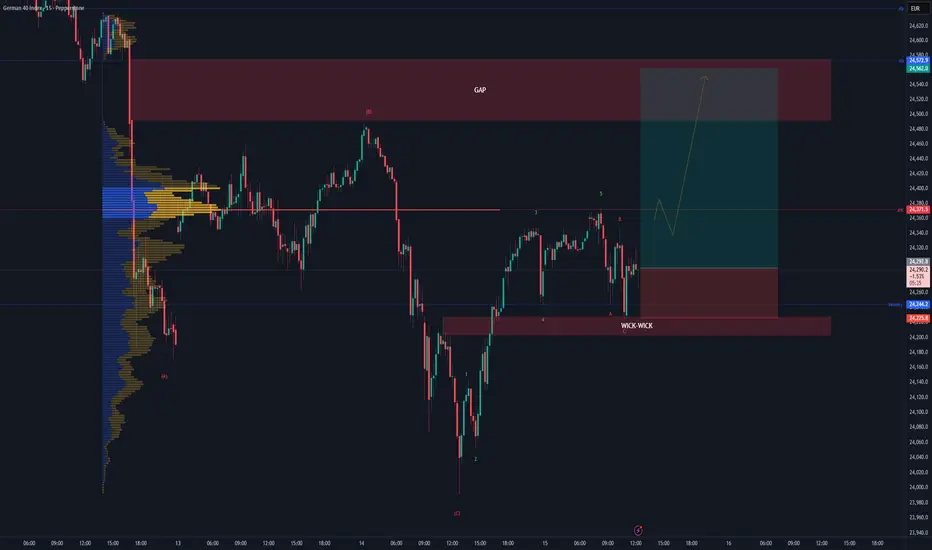
GER40 Review October 16 2025Short-term price movement ideas.
After testing the daily short FVG, the price provided further confirmation on the daily chart, indicating the potential to continue working in the downward direction. At the moment, the main area of interest is the 4H short FVG. If it gets confirmed on the 1H timeframe, a short position can be considered next, with the target being the equal lows.
Be flexible, adapt to the market, and the results will come quickly. Good luck to everyone.

DAX: Will Go Up! Long!
My dear friends,
Today we will analyse DAX together☺️
The recent price action suggests a shift in mid-term momentum. A break above the current local range around 24,193.45 will confirm the new direction upwards with the target being the next key level of 24,328.,98 and a reconvened placement of a stop-loss beyond the range.
❤️Sending you lots of Love and Hugs❤️
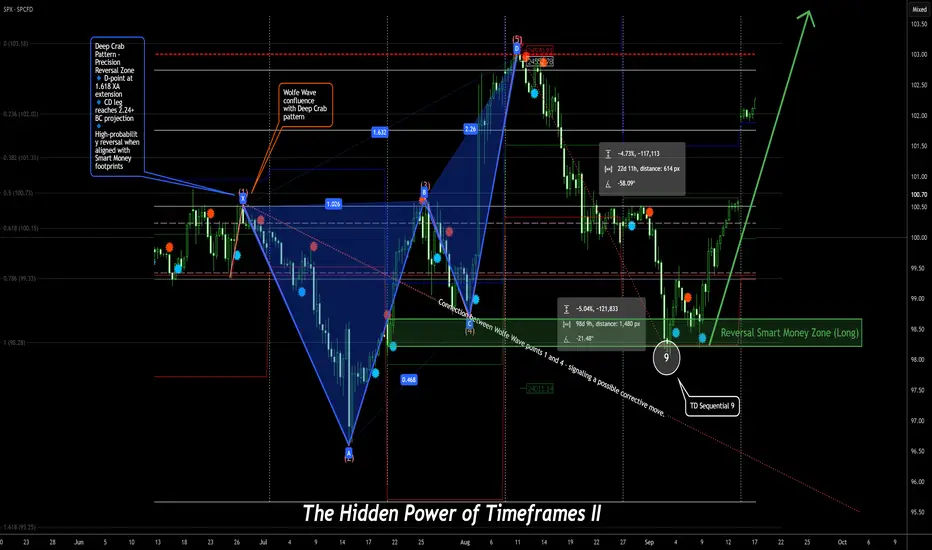
The Hidden Power of Timeframes – Part 2 🔮 The Hidden Power of Timeframes – Part 2 Connection Confluence” – The Invisible Architecture of Precise Trades
Seeing the Invisible
Welcome to Part 2.
If Part 1 gave you clarity on how timeframes interact, we now go one level deeper — into the unseen forces that move beneath the surface of every chart.
🧠 The question is:
“How can I recognize where structure is headed — before it even forms?”
🧠 It’s Not Just About Alignment – It’s About Multi-Timeframe Confluence
The magic doesn’t lie in one indicator or one pattern.
It’s born in the interplay of powerful concepts:
🌀 Wolfe Waves forming at the edges of Order Blocks
🧬 Harmonic Patterns merging with RSI or MACD divergences
🔢 TD Sequential counts signaling exhaustion at precise turning points
🕯️ Japanese Candlesticks confirming what orderflow already whispers
🔐 Smart Money footprints revealing where the crowd dreams — and where those dreams get crushed
This is more than technical analysis.
This is about reading intention — before it becomes visible.
⏳ Multi-Timeframe Fractals – The Echo of the Market
The market is fractal.
What unfolds on a 15-minute chart can mirror the Daily — and often previews the next big move on the Weekly.
📌 Example Scenario:
✅ Bullish divergence on the 4H chart
✅ Aligns with a Gartley pattern on the Daily
✅ Completes just as a TD9 count signals exhaustion on the Weekly
✅ While retesting a monthly liquidity pool
That’s not coincidence — that’s Signal Confluence.
And those who read it are always one step ahead of the market.
🛰️ Smart Money & Orderflow – Trade the Why, Not Just the What
Smart Money doesn’t chase candles.
It trades intent, imbalance, and psychology.
🛠️ Tools of the Trade:
Fair Value Gaps (FVG)
Order Blocks
Liquidity Sweeps
Breaker Blocks
Displacement & Inducement
Retail traders chase patterns.
Smart Money chases the dreams of retail.
🔗 The Real Edge: Seeing Connections Others Miss
A Wolfe Wave is just a shape
An Elliott Wave is just a count
A TD9 is just a number
But when…
🌀 A Wolfe Wave forms during the 5th Elliott Wave
🔢 Ends with a TD9 at a liquidity high
🔐 Inside an Order Block...
💥 That’s not just technicals — that’s chess on the chart.
That’s how real precision is born.
That’s how you anticipate moves weeks — or even months — in advance.
🧭 The Meta Skill: Navigating Confluence Across Timeframes
You don’t need to know everything.
You just need to:
✔️ Recognize when timeframes align
✔️ Feel where systems converge on one idea
✔️ Avoid forcing trades when there’s no synergy
✔️ Only act when the market’s story is consistent across all levels
A true edge doesn’t come from more tools —
It comes from clarity in complexity.
🧩 Bonus Insight: Alignment Within a Single Timeframe
Timeframe confluence is powerful.
But don’t underestimate the strength of multiple high-probability signals inside just one timeframe.
Example:
In a 4H chart:
Wolfe Wave
Harmonic Pattern
Orderflow Zone
Divergence
…all pointing to the same reversal area.
That’s not clutter — that’s weighted confluence.
These moments often deliver the most decisive trades.
💬 Comment below – or share this with someone who’s always fighting their own timeframes.
🚀 Let’s trade with precision — not prediction.