nas100 4HTrading Outlooks for the Week Ahead
In this series of analyses, we review short-term trading outlooks and perspectives.
As can be seen, in each analysis there is a key support/resistance zone close to the current price of the asset. The market’s reaction to or breakout from these levels will determine the next price movement toward the specified targets.
Important Note: The purpose of these trading outlooks is to highlight critical price levels ahead and the market’s potential reactions to them. The analyses provided are by no means trading signals!
NQCUSD trade ideas

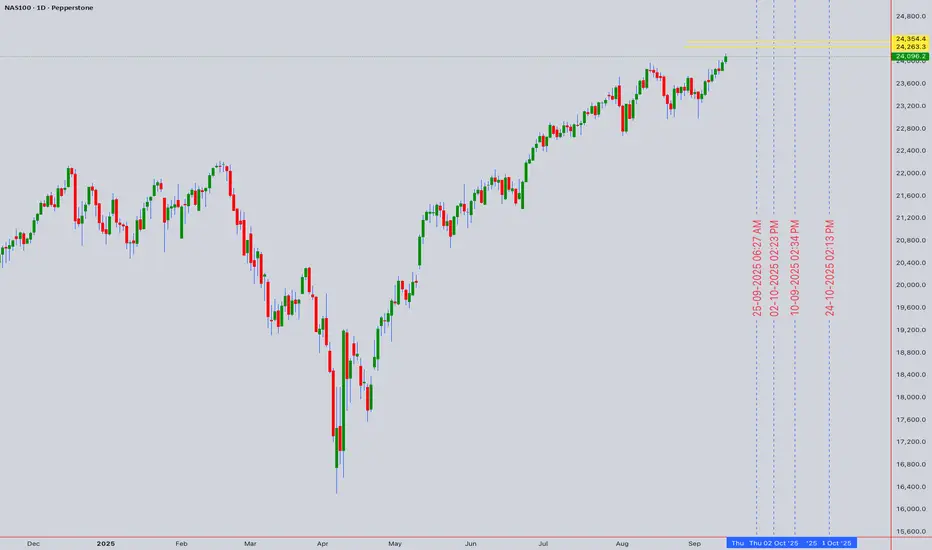
NAS100 Forecast & Projection📊 NAS100 Forecast | Intraday & Swing Outlook 🚀📉 (11th Sept 2025)
🕵️ Market Context
NAS100 closed at 24,096.
Global equities remain volatile due to inflation, Fed policy outlook, and tech earnings season.
Short-term sentiment: Neutral to Slightly Bullish.
Swing sentiment: Bullish while above 23,500 key support.
🧩 Technical Framework
Candlesticks: Bullish engulfing spotted on H4, suggesting buyers defend 23,800 zone.
Elliott Wave: Current move resembles Wave 3 extension with corrective pullbacks near 23,750–23,900.
Wyckoff: Distribution signs absent, market in late accumulation.
Gann Analysis: 24,200–24,250 forms a key resistance square.
Ichimoku Cloud: Price above Kumo (H4/D1), bullish confirmation if 24,300 breaks.
Support/Resistance:
Major Support: 23,500 / 23,750
Major Resistance: 24,300 / 24,750
📈 Indicators Snapshot
RSI (H1): 58 → room to climb before overbought.
Bollinger Bands: Price hugging upper band → momentum bullish, risk of overextension.
VWAP (D1): Holding above daily VWAP → bullish bias intraday.
MA Cross: 50 EMA > 200 EMA (Golden Cross) → swing uptrend intact.
⚡ Intraday Levels & Strategy
🔑 Buy Zone: 23,820 – 23,900 (pullback entry).
🎯 Targets: 24,150 / 24,300 / 24,450.
🛑 Stop Loss: Below 23,700.
⚠️ Bear Trap Alert: A dip under 23,800 with quick rebound signals strong accumulation.
🌀 Swing Trading Levels & Strategy
🔑 Buy Zone: 23,500 – 23,700.
🎯 Medium-Term Targets: 24,600 / 25,000 / 25,500.
🛑 Stop Loss: Below 23,300 (weekly close).
📌 If 24,750 breaks → bullish continuation toward 25,800.
❗ If 23,500 breaks → swing bias shifts bearish to 22,800.
📊 Pattern Watch
🦅 Head & Shoulders invalidated (bullish continuation favored).
🦋 Harmonic Bullish Gartley forming near 23,750 (PRZ zone).
🚨 Watch for Bull Trap above 24,300 → confirmation needed before chasing longs.
🧭 Final Outlook
Intraday Bias: Buy dips toward 23,820–23,900.
Swing Bias: Accumulate above 23,500 for 25,000+.
Market remains buy-the-dip mode while above 23,500.
Risk management 🔑: Keep SL tight as volatility persists.
💡 NAS100 traders should balance intraday momentum with swing accumulation zones. The broader structure favors upside continuation, but resistance at 24,300 must break cleanly for momentum to sustain.
For individuals seeking to enhance their trading abilities based on the analyses provided, I recommend exploring the mentoring program offered by Shunya Trade. (Website: shunya dot trade)
I would appreciate your feedback on this analysis, as it will serve as a valuable resource for future endeavors.
Sincerely,
Shunya.Trade
Website: shunya dot trade
Nasdaq bullish trendThe Nasdaq trend is completely bullish and we expect a reversal and price correction within this range so that we can enter a buy position. Fundamentally, this index is completely bullish.

NASDAQ | H2 Double Top | GTradingMethodHello Traders! 👋
🧐 Market Overview:
CPI is out today — and it could be the spark the NASDAQ needs. Price is stalling at the previous all-time high, and that’s where I’m watching closely.
I’ve been tracking a double top on the daily for a while now, and today the H2 chart is starting to show the same structure. That kind of multi-timeframe alignment doesn’t happen often.
📊 Trade Plan:
I’ve entered a starter short on the daily structure. If the H2 confirms, I’ll scale in with a second position.
Risk/Reward:
Entry:
Stop Loss:
Take Profit 1 (50%):
Take Profit 2 (50%):
💡 GTradingMethod Tip:
Double tops work best when paired with other signals. In my system, I look for:
- RSI negative divergence
- Lower volume on the second top
- A confirmation candle close within my entry range
This reduces false signals and adds conviction.
🙏 Thanks for reading! Do you trade double tops?
📌 Disclaimer:
This is not financial advice. This content is to track my trading journey and for educational purposes only.

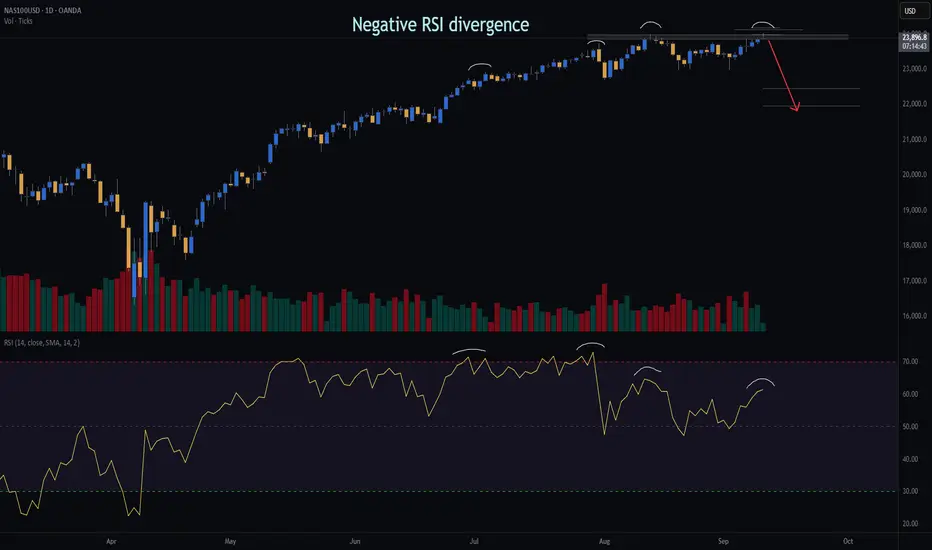
NASDAQ | Daily Double Top | GTradingMethodHello Traders 👋
🧐 Market Overview:
I’ve opened a short on the NASDAQ based on a clear double top setup that formed yesterday. Several of my key variables aligned, giving this trade a high-probability edge:
Negative RSI divergence → showing weakening buying momentum
Lower volume on the second top → indicating exhaustion
Daily candle closure within threshold → confirming structure validity
📊 Trade Plan:
RR: 9.1
Entry: 23 931
Stop Loss: 23 178
Take Profit 1 (50%): 22 453
Take Profit 2 (50%): 21 969
💡 GTradingMethod Tip:
When trading reversal patterns like double tops, I always wait for confirmation across multiple variables (momentum, volume, candle structure). This increases probability and reduces false entries.
🙏 Thanks for checking out my post!
Follow me for more setups and let me know — do you see this double top holding, or is there more upside left in the NASDAQ?
📌 Disclaimer:
This is not financial advice. This content is to track my trading journey and for educational purposes only.
Liquidity Voids: Where Price Runs Through Empty Space█ Liquidity Voids: Where Price Runs Through Empty Space
Big moves don’t just “happen”, they happen because either buyers or sellers step aside and let price run.
A liquidity void is what’s left behind when that happens: an area on the chart where price traded with very little volume, leaving a ‘hole’ in market participation.
This is not just another fair value gap. A typical FVG can form on normal volume during strong momentum. A liquidity void specifically signals a displacement under thin conditions, meaning the move was too easy, and price often comes back to check that area later.
█ What Exactly Is a Liquidity Void?
Think of the order book as a ladder of bids and asks. Normally, price moves step by step as orders fill at each level. But when there aren’t enough orders (low liquidity), price jumps levels and that jump is your void.
On a chart, it shows up as:
A large, one-directional candle with very small or no wicks overlapping neighbors.
Little or no volume relative to the move’s size (thin participation).
Price displacement that looks almost “too clean” — no hesitation, just a straight run.
These clues tell you price didn’t just move on heavy buying/selling, it moved through empty space.
⚪ Liquidity Void Detector
Use this free Liquidity Void Detector indicator to spot liquidity voids. It signals when the market makes a relatively sharp move on comparatively low volume, helping you spot these voids in real time.
█ Why Low Volume Matters
⚪ Not All Gaps Are Voids
A fair value gap can form on high participation, think of a breakout candle with heavy volume and institutional backing. That’s an accepted price move.
⚪ Voids Are Different
A liquidity void happens when the market skips prices because there was no one there to trade. It’s an inefficient move that the market often wants to revisit and “fill in” once participation returns.
⚪ Volume as the Filter
When volume is below its own average (or below a trend baseline), it tells you this wasn’t a “healthy” move, it was a thin-book displacement.
█ How Traders Use This
⚪ Mark the Zone
Draw the high and low of the candle(s) that created the void. This is your “inefficiency zone.”
⚪ Wait for the Return
Voids often act like magnets. Price often reverses and retests or fills the void, but it can just as easily slice through the zone once revisited, as thin liquidity offers little resistance.
█ What Research Show
Academic studies on price gaps find that immediate fills are rare, but the probability of fill rises over time. Downward voids (panic selling) fill faster on average than upward voids.
Crypto traders track CME Bitcoin gaps and report over 80–90% eventually get filled, but timing is unpredictable.
Volume-adjusted strategies outperform simple gap-filling because they focus on inefficient moves, not every gap. The key is filtering for thin participation.
█ Bottom Line
Liquidity voids are not just gaps, they are evidence of skipped prices under low participation.
They tell you where price moved “too easily,” leaving behind unfinished business.
Learn to filter for low-volume displacements, mark those zones, and watch how often price comes back to rebalance them. This turns a random candle into a predictive level, one that can guide your mean reversion trades or act as a support/resistance flip in trending markets.
-----------------
Disclaimer
The content provided in my scripts, indicators, ideas, algorithms, and systems is for educational and informational purposes only. It does not constitute financial advice, investment recommendations, or a solicitation to buy or sell any financial instruments. I will not accept liability for any loss or damage, including without limitation any loss of profit, which may arise directly or indirectly from the use of or reliance on such information.
All investments involve risk, and the past performance of a security, industry, sector, market, financial product, trading strategy, backtest, or individual's trading does not guarantee future results or returns. Investors are fully responsible for any investment decisions they make. Such decisions should be based solely on an evaluation of their financial circumstances, investment objectives, risk tolerance, and liquidity needs.

NAS100 - New ATH in Overbought TerritoryDear Friends in Trading,
Overbought - Rising Wedge - Divergence - Be Careful
4HR + 12Hr only touching RSI 70% at this time.
NASDAQ printing new ATH's on Rate Cut Bets
Let me know if anything is unclear.
I sincerely hope my point of view offers a valued insight.
Thank you for taking the time study my analysis.
buy nas100Nothing much to say, just buy nas100 and close trade 10 minute before market closes tonight

Nas100 Trade Set Up Sep 12 2025www.tradingview.com
Price has made a ATH and closed above a 4h swing high so im overall bullish. I want to see a pullback into the key level or a sweep of SSL followed by a 1m IFVG to continue higher

NSDQ100 bullish reaction to rate-cut expectationsUS CPI and a sharp rise in jobless claims (+263k vs. +235k expected, Texas-driven distortions aside) reinforced the narrative of a cooling labour market. Equities rallied on the lower rates outlook: S&P 500 (+0.85%) and Nasdaq (+0.72%) closed at fresh records, with the Magnificent 7 up +1.13%. Breadth was strong (436 S&P advancers, Russell 2000 +1.83%). Oracle (-6.23%) was a notable laggard after recent gains. Meanwhile, OpenAI’s potential $100bn+ restructuring with Microsoft and a UK data center buildout highlight continued AI momentum. On the geopolitical front, US-China talks (Bessent–He Lifeng) and a possible Xi-Trump meeting, plus progress with India, suggest tentative thawing in trade and tech relations.
Conclusion (Nasdaq-100):
The combination of softer labour data, rate-cut expectations, and sustained AI optimism is a constructive backdrop for the Nasdaq-100. Short-term pullbacks (e.g., Oracle) appear stock-specific, while breadth and AI-linked capex support further upside. Near-term, dips remain buyable unless geopolitics disrupt risk sentiment.
Key Support and Resistance Levels
Resistance Level 1: 24200
Resistance Level 2: 24380
Resistance Level 3: 24600
Support Level 1: 23500
Support Level 2: 23320
Support Level 3: 23125
This communication is for informational purposes only and should not be viewed as any form of recommendation as to a particular course of action or as investment advice. It is not intended as an offer or solicitation for the purchase or sale of any financial instrument or as an official confirmation of any transaction. Opinions, estimates and assumptions expressed herein are made as of the date of this communication and are subject to change without notice. This communication has been prepared based upon information, including market prices, data and other information, believed to be reliable; however, Trade Nation does not warrant its completeness or accuracy. All market prices and market data contained in or attached to this communication are indicative and subject to change without notice.

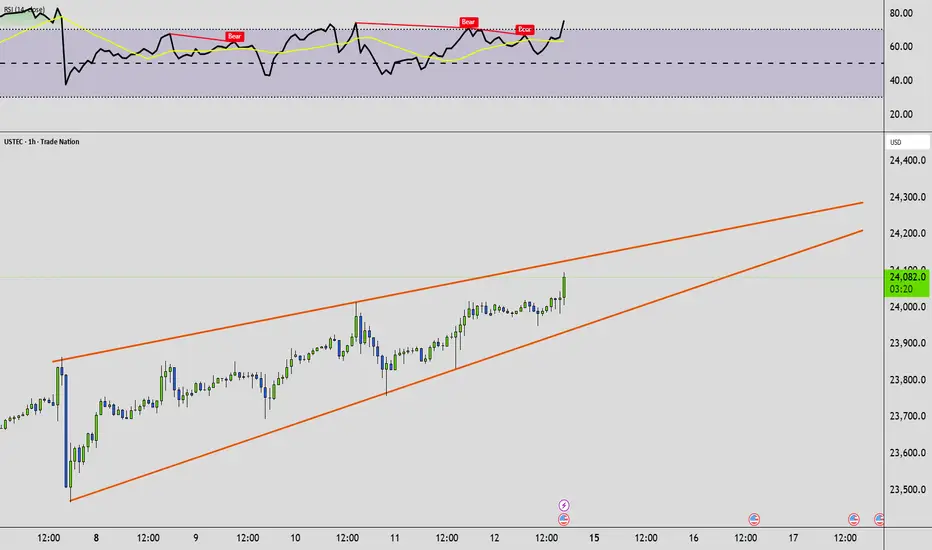
UPDATE: USTEC100 ready to rally through stratosphere to 24,936 USTEC100 is priming itself for some great upside on the daily.
Which means investors are piling into stocks which will drive the prices up and send the index through the stratosphere.
The technicals are very basic, W Formation - Price broken above the 20MA and 200MA and above the neckline.
And so we can easily see the target of 24,936.
🚀 Fed easing hopes → Softer inflation + weak PPI/PPI data raise chances for interest rate cuts, which tend to boost growth/high valuation tech stocks.
💡 AI & innovation tailwinds → Big tech companies keep delivering in AI, semis, cloud etc., giving strong fundamental support.
📈 Strong technicals / trend structure → Price breaking past resistance zones, holding trendline support, indicating bulls are stepping in.
🌍 Risk-on sentiment & dollar weakness → When investors are more willing to take risk (and the USD softens), tech tends to benefit more.
⏳ Pullbacks seen as buying opportunities → Dips have been shallow, and support zones are holding, giving room for further advance.
Disclosure: I am part of Trade Nation's Influencer program and receive a monthly fee for using their TradingView charts in my analysis.

NAS100 Buy Setup – Sept 12, 2025🚀
Tapped 4H POI 🔑 + weak rejections 📉 = buyers stepping in 💪.
Looking for buys above 23,985 → targets 24,000+ 🎯📈

Nasdaq Eyes 24,240 ATH as PPI LoomsUSNAS100 – Overview
The Nasdaq 100 maintained bullish momentum, retesting support at 23,695 before pushing higher again.
Technical Outlook:
📈 As long as price trades above the 23,870 pivot, bullish momentum is expected to continue toward a new ATH at 24,090 → 24,240.
📉 If the PPI release comes in hotter than expected, it may weigh on the index. A confirmed stabilization below 23,860 would open the way for a pullback toward 23,690.
Key Levels:
Pivot: 23,870
Resistance: 24,090 – 24,240
Support: 23,695 – 23,510
Bias: Bullish above 23,870; bearish correction only if price stabilizes below 23,860, with deeper downside toward 23,690

NASDAQ100 HIGH PROBABILITY SETUP SOON!!!🚨 NAS100 HIGH PROBABILITY SELL SETUP 🚨
* Here We Can See Clearly The Next Potential Move For US100 Coming Hours/Days.
* Keep Your Eyes Close On Your Trading Positions.
* Happy PIP Hunting Traders.
FXKILLA.

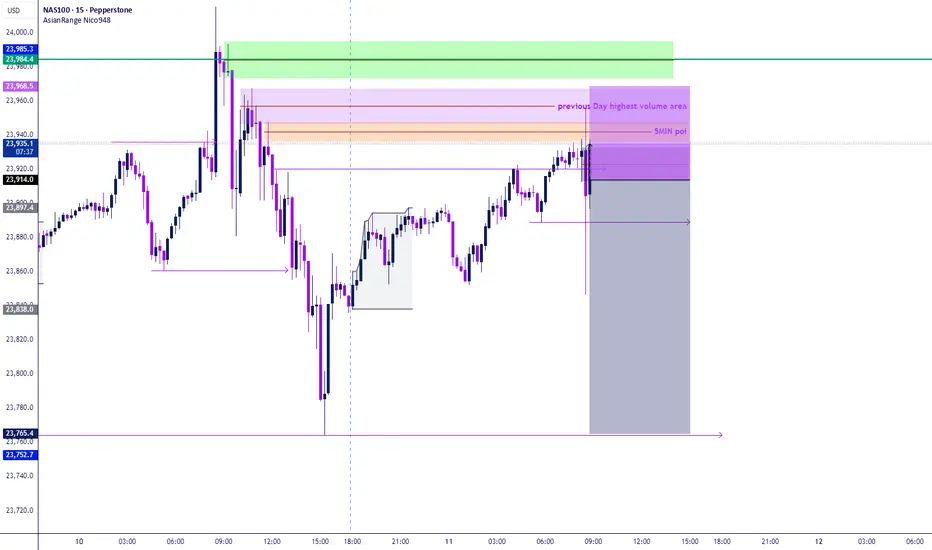
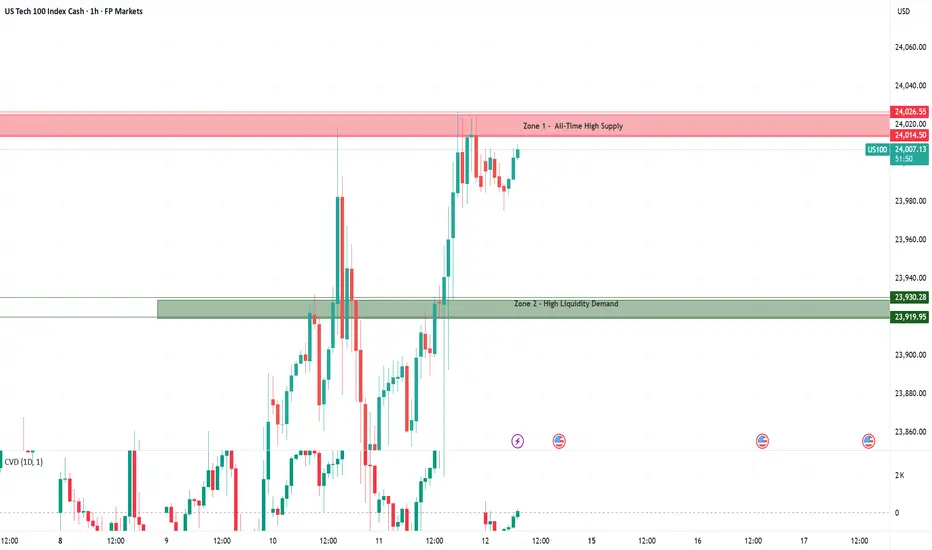
Nas100 – Today’s Key Trading ZonesTrading zones
Zone 1 – All-Time High Supply (24,014 – 24,026)
This zone sits at the all-time high, where volatility and liquidity hunts are often at their peak. Sellers are likely to defend aggressively here, making sharp rejections common. A clean breakout and hold above would indicate strong buyer conviction and could open the door for further momentum into uncharted territory.
Zone 2 – High Liquidity Demand (23,920 – 23,930)
This demand zone represents a high-liquidity pocket created by prior consolidation. Buyers are expected to step in here on pullbacks, providing potential long setups. However, if the zone fails to hold, it may flip into resistance and trigger continuation downside moves.
With price trading near all-time highs, only two zones are marked today. Volatility at record levels makes price action less structured, leaving limited data to build reliable zones from. As a result, focus remains on the all-time high supply zone above and the high-liquidity demand zone below as the key areas for potential reaction.
Sentiment in the US100 is cautiously positive but fragile. Strong tech momentum and expectations of Fed rate cuts support the index, while softer labor data and cooling producer prices ease pressure on yields. Still, higher-than-expected CPI reminds investors that inflation risks remain, keeping markets on edge near all-time highs.
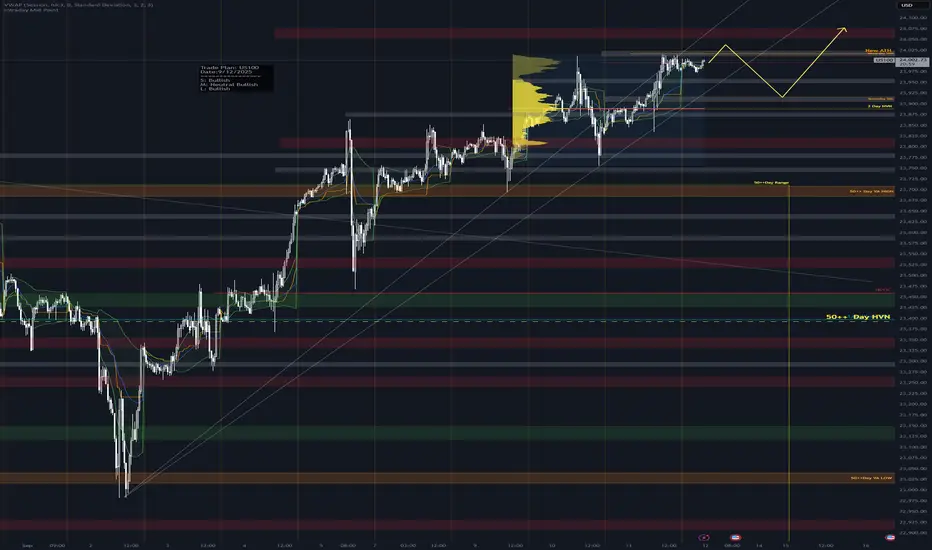
Daily Trade Plan: US100Trade Plan: US100
Date:9/12/2025
================
Smaller Timeframe : Bullish
Medium Timeframe : Neutral Bullish
Larger Timeframe : Bullish
================
If price trying to break higher but fail. Price should pull back to 2 day HVN level. Especially "Yesterday value area low" zone. It coud be set as a lounching point of bullish move to make a new all time high.
NasdaqNasdaq continues its bullish rally, after the last attempt to break above this key level failed, 24000 was finally broken. Let's head to 24100

Nas100 600 pip set upwww.tradingview.com
Nas played out perfectly, closing above a key level, inverting a 5m FVG, retesting that IFVG then targeting PDH to secure 600 pips(60 points)

NAS still charging HighsEverything explained in video, please let me know if I may have missed any details!

US100 Strong Bullish Bias! Buy!
Hello,Traders!
US100 keep trading in
A strong uptrend and
The index is now trying
To breakout the key
Horizontal level of 23,940
So IF the breakout is
Confirmed we will be
Expecting a further
Bullish move up
Buy!
Comment and subscribe to help us grow!
Check out other forecasts below too!
Disclosure: I am part of Trade Nation's Influencer program and receive a monthly fee for using their TradingView charts in my analysis.

NASDAQ MARKET STRUCTURE , WHERE NAS GO ? Selling Nasdaq Now Price 2400
Reason Double Top
Takedown The Buy Side Liquidity
Target Sell Side Liquidity
Buying Nasdaq Pending
Buy Nasdaq Cisd ( 23,330)
Buy Nasdaq OB ( 23,10 )

Nas100 Trade Set Up Sep 11 2025www.tradingview.com
Price is staying closed above key levels and has created a long wick so i will want to see price tap into 50% of the wick before continuing higher to PDH

NAS100 | Rejection from previous day highest volume arealets try again since price has swept the ATH and created a change in structure for reversals