Nasdaq 100 Analysis: Index Hits All-Time HighNasdaq 100 Analysis: Index Hits All-Time High
As the chart shows, today the Nasdaq 100 index has, for the first time in history, climbed above the 24,500 level.
According to media reports, bullish sentiment was driven by the long-awaited Fed decision to cut interest rates for the first time in 2025.
Although the Fed also indicated it would remain cautious about further cuts, the easing acted as a bullish catalyst for the entire stock market – European equities also advanced today, with technology companies leading the way.
Technical Analysis of the Nasdaq 100
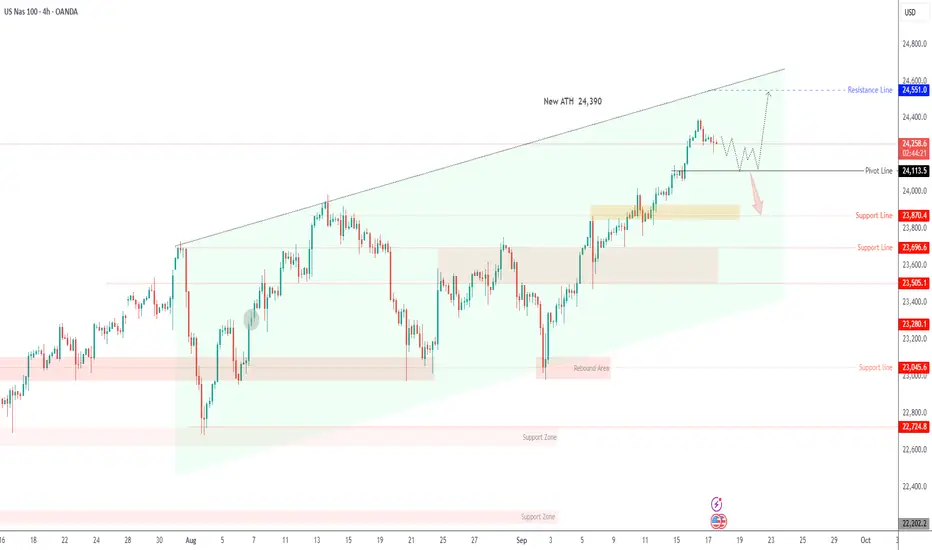
When looking at the Nasdaq 100 index within the context of the September rally (highlighted by the blue channel), we note the following:
→ In mid-September, price action reflected market optimism, as the index traded in the upper half of the channel – with resistance at the upper boundary (R) and support at line S.
→ Yesterday’s volatility spike produced a similar move (marked with an arrow) to the one we highlighted in today’s earlier gold analysis, namely a sharp reversal from the lower boundary of the channel (essentially a bullish engulfing pattern, albeit less clear due to volatility and the chosen timeframe).
Following the reversal from the lower boundary, which unfolded aggressively (a sign of bullish conviction), the price advanced steadily, breaking through key levels:
→ the midline of the blue channel;
→ the R2 resistance line shown in red;
→ the former all-time high at 24,165.
Moreover, the index’s behaviour around 24,300 demonstrated the persistence of buyers – the price moved above a cluster of local resistances and then extended its rally.
Bearish view:
→ bullish momentum has pushed the RSI indicator into overbought zone;
→ when attempting to break above the psychological 24,500 level, the price failed to hold, suggesting a false bullish breakout.
Given the above, we could assume that optimism prevails in the market, supported by the Fed’s decision:
→ on the one hand, further gains towards the upper boundary of the blue channel may take place;
→ on the other hand, the market may be overheated and vulnerable to a correction (for instance, back towards the blue midline).
This article represents the opinion of the Companies operating under the FXOpen brand only. It is not to be construed as an offer, solicitation, or recommendation with respect to products and services provided by the Companies operating under the FXOpen brand, nor is it to be considered financial advice.
NQCUSD trade ideas


Nasdaq 100 Eyes 24,550–25,050 if Fed Signals Dovish ToneUSNAS100 – Technical Overview
The Nasdaq remains in focus as traders await the Federal Reserve’s rate decision later this week.
Markets largely expect a 25 bps cut, but the key driver will be Chair Powell’s tone on inflation, labor-market weakness, and tariff risks.
Earlier record highs across U.S. indexes were fueled by tech strength and optimism over U.S.–China trade talks, while gold’s surge to new highs underscores strong safe-haven demand.
Technical Outlook
📉 Correction phase
Price is expected to retest 24,240 → 24,115 before attempting another bullish leg.
A sustained drop below 24,110 would expose deeper support at 23,870.
📈 Bullish continuation
Holding above 24,240 – 24,115 keeps the broader uptrend intact.
Once consolidation is complete, a renewed rally targets 24,550 → 24,800, with a potential extension to 25,050 if the Fed delivers a more dovish message.
Key Levels
Pivot: 24,380
Resistance: 24,550 – 24,800 – 25,050
Support: 24,240 – 24,115 – 23,870
📌 Market Context:
A 25 bps Fed cut may offer moderate support for tech-heavy indices, while a more aggressive 50 bps cut could accelerate the next breakout toward fresh ATHs. Conversely, a hawkish tone from Powell could trigger a deeper correction before the next leg higher.

Again, with short term NAS 100 idea.Risk Reward ratio is one of the most important things in trading, never forget to apply safety measures to every trading plan you have.

NAS100 H4 | Bullish continuation in playUS100 has bounced off the buy entry at 23,984.23, which is a pullback support and could rise from this level to the upside.
Stop loss is at 23,721.86, which is an overlap support.
Take profit is at 24,853.60, which aligns with the 61.8% Fibonacci projection.
High Risk Investment Warning
Trading Forex/CFDs on margin carries a high level of risk and may not be suitable for all investors. Leverage can work against you.
Stratos Markets Limited (tradu.com ):
CFDs are complex instruments and come with a high risk of losing money rapidly due to leverage. 65% of retail investor accounts lose money when trading CFDs with this provider. You should consider whether you understand how CFDs work and whether you can afford to take the high risk of losing your money.
Stratos Europe Ltd (tradu.com ):
CFDs are complex instruments and come with a high risk of losing money rapidly due to leverage. 66% of retail investor accounts lose money when trading CFDs with this provider. You should consider whether you understand how CFDs work and whether you can afford to take the high risk of losing your money.
Stratos Global LLC (tradu.com ):
Losses can exceed deposits.
Please be advised that the information presented on TradingView is provided to Tradu (‘Company’, ‘we’) by a third-party provider (‘TFA Global Pte Ltd’). Please be reminded that you are solely responsible for the trading decisions on your account. There is a very high degree of risk involved in trading. Any information and/or content is intended entirely for research, educational and informational purposes only and does not constitute investment or consultation advice or investment strategy. The information is not tailored to the investment needs of any specific person and therefore does not involve a consideration of any of the investment objectives, financial situation or needs of any viewer that may receive it. Kindly also note that past performance is not a reliable indicator of future results. Actual results may differ materially from those anticipated in forward-looking or past performance statements. We assume no liability as to the accuracy or completeness of any of the information and/or content provided herein and the Company cannot be held responsible for any omission, mistake nor for any loss or damage including without limitation to any loss of profit which may arise from reliance on any information supplied by TFA Global Pte Ltd.
The speaker(s) is neither an employee, agent nor representative of Tradu and is therefore acting independently. The opinions given are their own, constitute general market commentary, and do not constitute the opinion or advice of Tradu or any form of personal or investment advice. Tradu neither endorses nor guarantees offerings of third-party speakers, nor is Tradu responsible for the content, veracity or opinions of third-party speakers, presenters or participants.

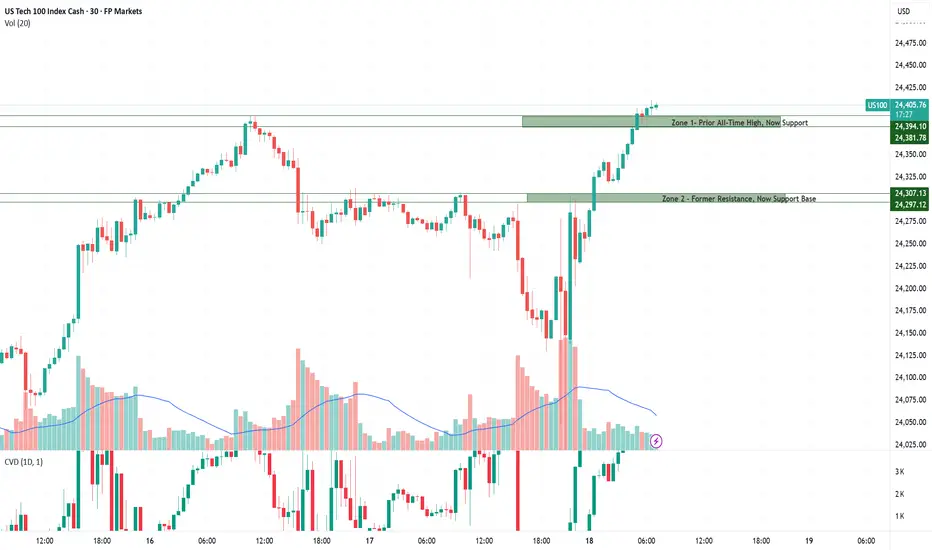
Nas100 - Trading zones at all time highWith price pushing into fresh all-time highs, reliable technical zones become harder to define due to the lack of historical data. This increases uncertainty and makes it essential to treat the zones as guidance rather than fixed buy or sell levels. Volatility tends to rise around record territory, so traders should remain cautious.
Zone 1 – Prior All-Time High, Now Support:
Yesterday’s all-time high has now turned into a support zone after being broken to the upside. This level may hold as a launchpad for further bullish continuation, but traders should remain cautious — if price drops back below, it could trigger a sharp reversal.
Zone 2 – Former Resistance, Now Support Base:
This area has been tested multiple times, making it a high-activity zone. Yesterday it acted as resistance, but after being broken, it now serves as support. Buyers may defend this area on a retest, but if it fails, momentum could shift quickly to the downside.
This area has been tested multiple times, making it a high-activity zone. Yesterday it acted as resistance, but after being broken, it now serves as support. Buyers may defend this area on a retest, but if it fails, momentum could shift quickly to the downside.
Market sentiment turned cautiously optimistic after the Fed delivered its first 25bp rate cut of the year, lowering the policy rate to 4.00–4.25%. Hopes for further easing later in 2025 are supportive for growth stocks and the Nasdaq-100, yet Powell’s remarks highlighted lingering risks from both inflation and a cooling labor market. As a result, volatility remains elevated, and while the bias is tilted higher, confidence in sustained momentum is still fragile.
NAS100 - Last Quarter Hype or Abyss?Dear Friends in Trading,
Interesting Read:
investinglive.com
Rate cuts invigorate buying optimism at this time:
1.Investing Institutions are undeterred by "overbought conditions"
2. Will I follow the buying Hype?
3. Marching towards 25000 or a cliff?
4. Am I dragged along into extreme red to maximize annual institutional profits?
5. What does the overbought conditions tell me is the current fair market value?
23700
I sincerely hope my point of view offers a valued insight.
Thank you for taking the time study my analysis.

FOMC has cleared liquidity levels around this technical rangeNews Drivers do not overpower technicals, the fundamentally driven movements are just banging around into huge money pending orders. No way around these mechanics.
That what we saw today, and what will continue to happen forever and ever 💎 Not saying it will always be a ricochet like today, but the orders are always there.

Short term idea for NAS100Simplicity is the best, I am using any complicated way of trade. Just draw some lines and do the trade.

78.60% PUSH-UP (nas100)All technicals are pointing towards a big push upwards (NAS100).
Keep risk to a limit on this one. Let's see how she plays out.

SHORT ON NASNAS has created a nice rising channel (bearish reversal pattern) and is starting to push outside of the channel to the downside.
I will be selling nas to the previous low looking to catch 800-900 points.

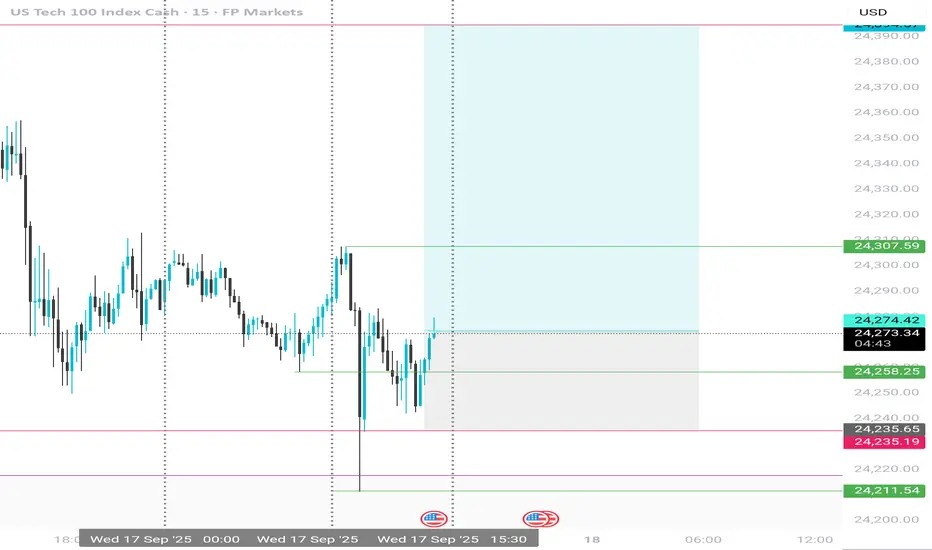
Nas100 Trade Set Up Sep 17 2025www.tradingview.com
Price swept PDL already and has come up but there is a 1h FVG that it will need to invert to go any higher to PDH or price will push lower, target SSL before possibly coming back up

US NAS100Preferably suitable for scalping and accurate as long as you watch carefully the price action with the drawn areas.
With your likes and comments, you give me enough energy to provide the best analysis on an ongoing basis.
And if you needed any analysis that was not on the page, you can ask me with a comment or a personal message.
Enjoy Trading ;)

NSDQ100 awaits Fed rate decision supported at 23940Nasdaq 100 Trading Takeaways
Fed in focus: Markets expect a 25bp cut today, though risks of larger/smaller moves exist with potential dissents on both dovish and hawkish sides. Trump’s newly sworn-in appointee Miran may push for 50bp, while Schmid could dissent hawkishly. This adds event risk and volatility for tech stocks.
Macro backdrop: Trump state visit to the UK highlights investment pledges and a potential US-UK tech partnership, which could support sentiment in large-cap tech.
Market moves:
S&P 500 (-0.13%) pulled back from record highs.
Nasdaq leadership held firm: Magnificent 7 (+0.55%) hit a new record, showing resilience even as breadth weakened.
Broader weakness evident – third straight day of more decliners than advancers.
Sector divergence: Energy (+1.73%) outperformed on higher Brent crude (+1.53%), but tech still provided upside leadership.
Implication for Nasdaq 100:
Short-term: Expect heightened sensitivity to Fed outcome – dovish signals/50bp risk would boost mega-cap tech, while hawkish dissent could trigger profit-taking.
Medium-term: Tech remains the relative outperformer, with new highs in the Magnificent 7 signaling continued defensive growth positioning despite weaker breadth.
Key Support and Resistance Levels
Resistance Level 1: 24470
Resistance Level 2: 24600
Resistance Level 3: 24800
Support Level 1: 23940
Support Level 2: 23760
Support Level 3: 23430
This communication is for informational purposes only and should not be viewed as any form of recommendation as to a particular course of action or as investment advice. It is not intended as an offer or solicitation for the purchase or sale of any financial instrument or as an official confirmation of any transaction. Opinions, estimates and assumptions expressed herein are made as of the date of this communication and are subject to change without notice. This communication has been prepared based upon information, including market prices, data and other information, believed to be reliable; however, Trade Nation does not warrant its completeness or accuracy. All market prices and market data contained in or attached to this communication are indicative and subject to change without notice.

Nasdaq longLooking for longs again .
Asian lows have been swept.
Manipulation amd reversal to the upside.
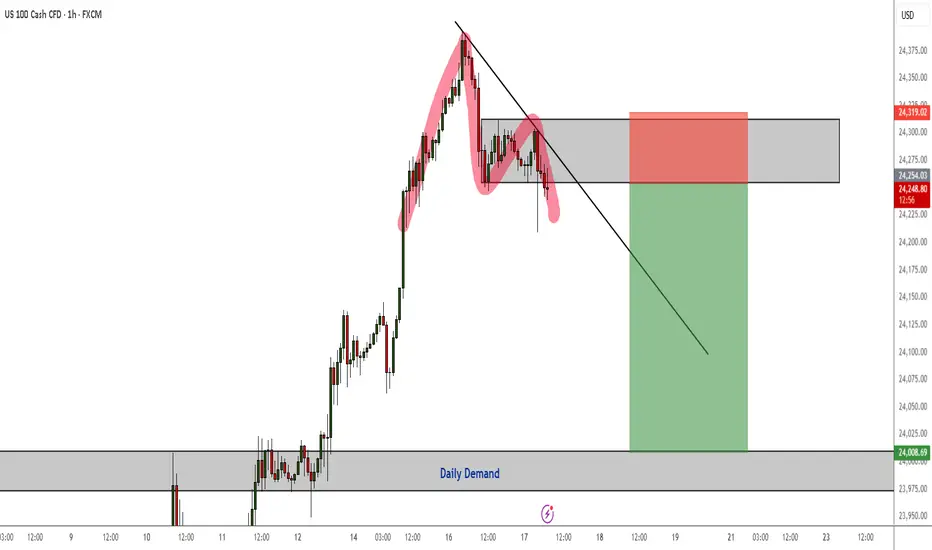
NAS100 Pressure to the Downside Continues - Double Top RejectionPressure to the downside will likely resume today for NQ as we now have a double top rejection pattern as confirmation to short.
I am aiming for the daily demand zone for my TP.

NAS100 Sideways Market | Key Resistance Rejection Ahead?The NAS100 index is currently trading within a sideways market structure, holding between 23,000 support and 24,000 resistance.
Recent rejection at resistance shows sellers defending the upper range.
CHoCH and BOS patterns confirm short-term structure shifts.
If price fails to break and sustain above 24,000, a move back towards the 23,400–23,200 demand zone is possible.
Only a clear breakout above 24,000 would shift bias to bullish continuation.
This setup highlights a range-bound market where patience is key—watch for confirmation before positioning.
This analysis is for educational purposes only and does not constitute financial advice. Trade at your own risk.

USNAS100 Braces for Fed Decision – Key Pivot at 24,300USNAS100 – Overview
The Nasdaq is set for a highly volatile session as markets await the Federal Reserve’s rate decision later today.
Traders widely expect a 25 bps cut, but a surprise 50 bps cut—though less likely—would signal stronger confidence in stable inflation and U.S. economic health, fueling a strong bullish rally.
Even if the Fed delivers the expected 25 bps cut, the key market mover will be Chair Powell’s press conference and the updated dot plot, which could reshape expectations for future easing.
Technical Outlook
📉 Bearish scenario
While trading below 24,300, price shows potential for a pullback toward 24,115.
A confirmed break below 24,115 would extend the bearish move toward 23,870 → 23,700.
📈 Bullish scenario
Stabilization above 24,115 keeps the broader uptrend intact.
A breakout above 24,300 would confirm bullish momentum, targeting 24,550 → 24,700 → 24,850.
📌 Market Context:
50 bps cut + dovish Powell → strong bullish breakout above 24,300 toward 24,550+.
25 bps cut + cautious guidance → moderate moves; price may remain range-bound or retest 24,115 before resuming higher.
Hawkish tone → deeper correction toward 23,870 or lower.
Central bank week ahead!Central bank week ahead! We've got interest rate decisions out from the Bank of Canada, FED, Bank of England and Bank of Japan.
BoC 17/09 - 25bps cut 94% - First on the chopping board is the BoC who are set to reduce interest rates by 0.25%. This comes amid steady inflation, holding below the 2% target and below recent expectations for an increase, currently at 1.9%. They've also seen unemployment rising to 7.1%, the highest level since 2021. The BoC has acknowledged the weakening labour market but are expected to follow a wait and see approach after todays cut. Current rates 2.75%
FED 17/09 - 25bps cut 98% - The FED's first rate decision after some very rocky labour market data and a surprise dovish tilt from Powell at Jackson Hole. Inflation remains sticky but the FED has stated that their current focus is set on labour market weakness. As well as the rates, we will also receive updated economic and interest rate projections, likely to carry much more weighting and longer term direction. In the economic projections we'll be looking out for the dot plot, GDP, employment and inflation to gauge future expectations for FED rates. This could undermine or support the rate cuts to trade with caution. Current rates 4.25-4.50%
BoE 18/09 - HOLD 100% - The BoE is set to hold rates steady at 4.00% amid elevated inflation data and recently positive labour market data. Inflation data came in lower than consensus earlier this week but still remains well above target at 3.8%. In the previous BoE meeting we saw a surprise hawkish tilt in the way of MPC voting.
2 members shifted from voting to cut to voting for a hold and the scales are expected to remain fairly heavy on the hold side tomorrow. The member voting and minutes will provide much needed context to the potential hold to come. Current rates 4.00%
BoJ 19/09 - HOLD 87% - Rounding a busy week off with the BoJ who is set to hold rates at 0.50%. There has been some hawkish comments from the BoJ in recent times as inflation holds around 3.1% and unemployment recovers from 2.5% to 2.3% but amid political turbulence a bold move from the BoJ in this decision is less likely. However the other potential would be for a surprise rate hike with a current probability of 11%. The BoJ is no stranger to surprises so will be looking out for any action or comments made to support future JPY strength or weakness. Current rates 0.50%
These fresh rates provide the opportunity for divergences between monetary policy. This could park the continuation higher for pairs such as EURUSD and GBPUSD if the fed sticks to a more dovish tilt and supports this in their economic projections.
Other currency pairs such as AUDCAD and AUDNZD provide some clear divergence with the RBA holding higher rates and the BoC and RBNZ cutting with lower rates. Any clear pullbacks within these assets could provide opportunity to get long and hold through for a bigger move

Naz 100 .Bulls are there.Rez is loomingTrend is up.No sign of a turn as yet.Could quite easily pop higher

Nas100 – Today's Trading Zones Analysis 17 sep.Trading Zones
As price trades around all-time highs, the amount of historical data to build strong zones is limited. This makes the current levels less reliable, and traders should approach them primarily as guidance rather than decisive turning points.
Zone 1 – All-Time High / Yesterday’s High:
This area marks the recent record peak. While it can act as resistance in the short term, its strength is uncertain due to limited data. Price reactions here may be volatile and driven more by sentiment than structure.
Zone 2 – Yesterday’s Low:
A lighter support level that can provide intraday reactions but lacks deep structural confirmation. Best used as a reference point rather than a major decision area.
Zone 3 – Strong Support / High Profitability for Momentum:
This is the most significant zone on the chart, where strong buyers have previously stepped in. It carries a higher probability of triggering a strong reaction. That reaction could unfold as a bounce higher if demand holds, or as a sharp move lower if the zone breaks decisively.
All eyes are on today’s Fed meeting , where markets widely expect a 25bp rate cut. While the move is largely priced in, the real focus will be on Powell’s tone and the updated dot plot, which will guide expectations for the pace of easing ahead. Sentiment in the US100 remains cautiously optimistic, supported by strong tech momentum and softer inflation data, but with price trading at record highs, volatility is likely to spike if the Fed delivers any surprises.

Is NASDAQ going for a correction or Stop Hunt?Are we on the right track? If I missed anything please let me know in the comments 🙏🏾
