Beyond the Chart - NAS100 Through Technicals & FundamentalsCAPITALCOM:US100 Update 📉
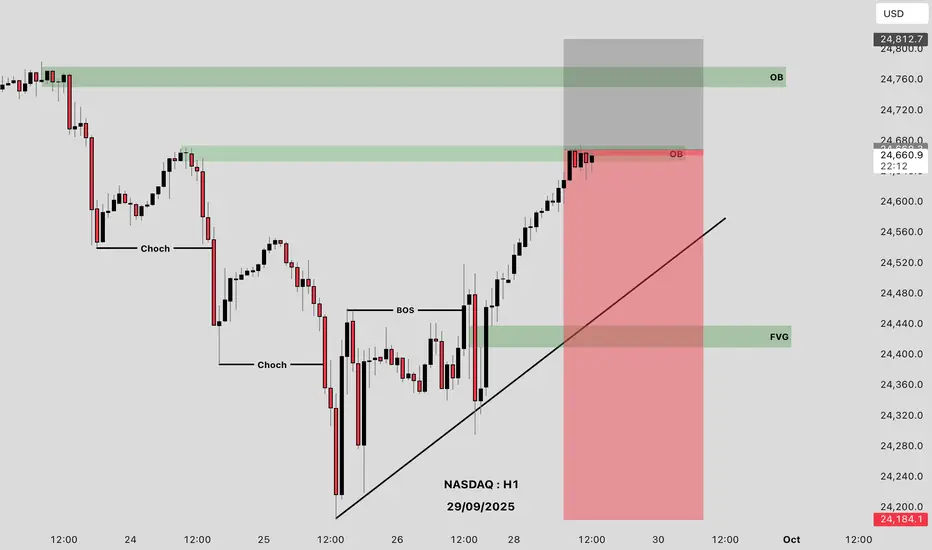
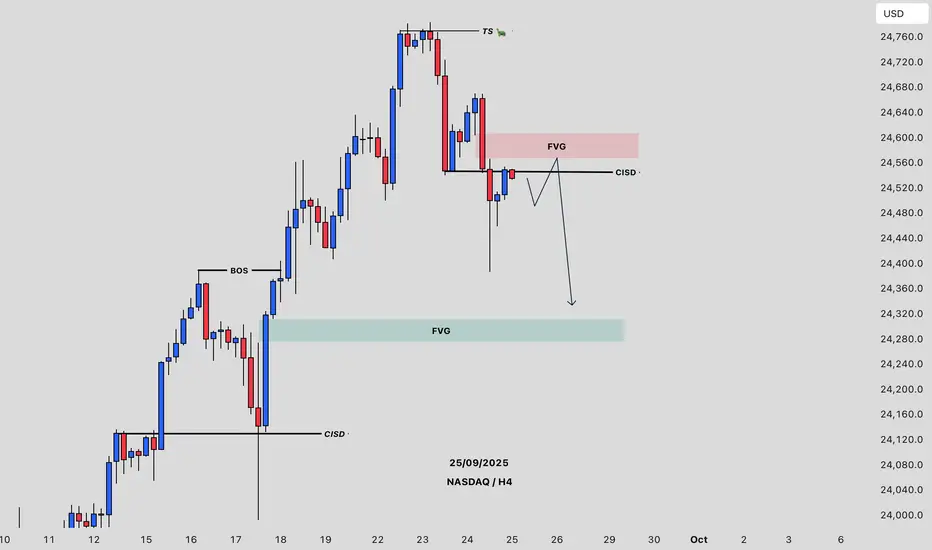
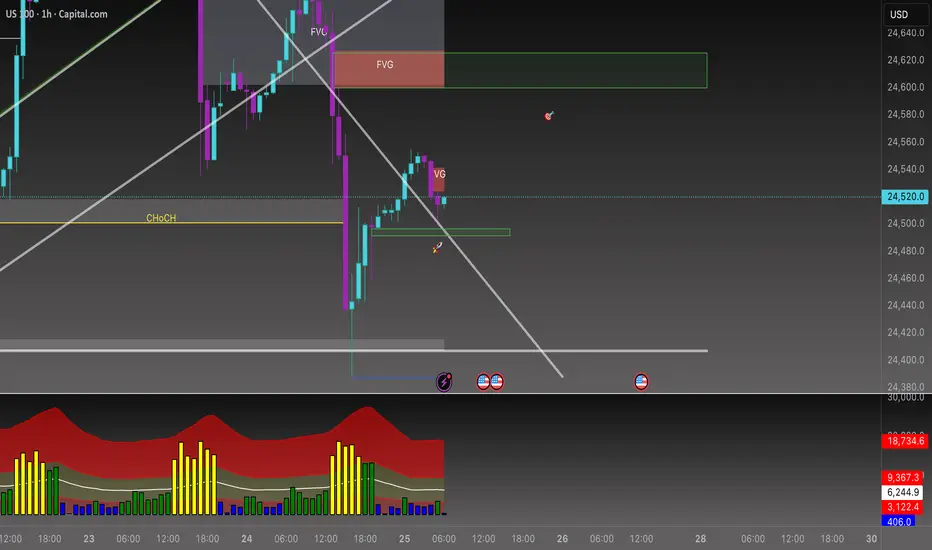
The trendline I drew yesterday played out perfectly. After the Bearish FVG + rejection, the trend broke and a second Bearish FVG formed right after.
NASDAQ Daily Analysis 📊
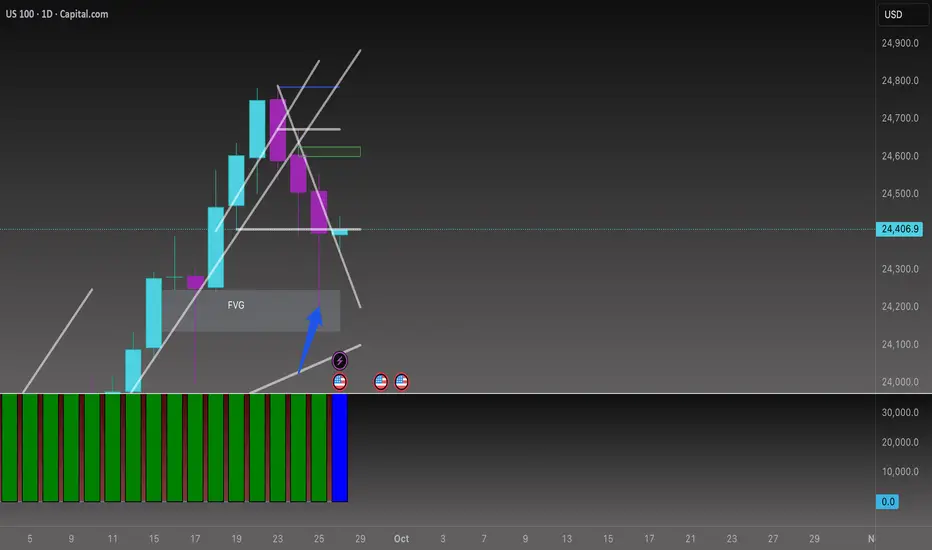
On the daily chart, the FVG formed on Sep 15th has been revisited, but price couldn’t hold in this zone and was quickly rejected. The trendline I’ve drawn is still active and guiding the move.
👉 If a bullish candle forms above the trend, I’ll be looking at 24,543 as a buy point.
👉 If sellers take control and push price below the trend, we could see a move down toward the FVG region at 24,340.
⚡Bottom line:
• If Core PCE cools off → bullish continuation fits.
• If Core PCE runs hot → expect sellers to take control.
NQCUSD trade ideas
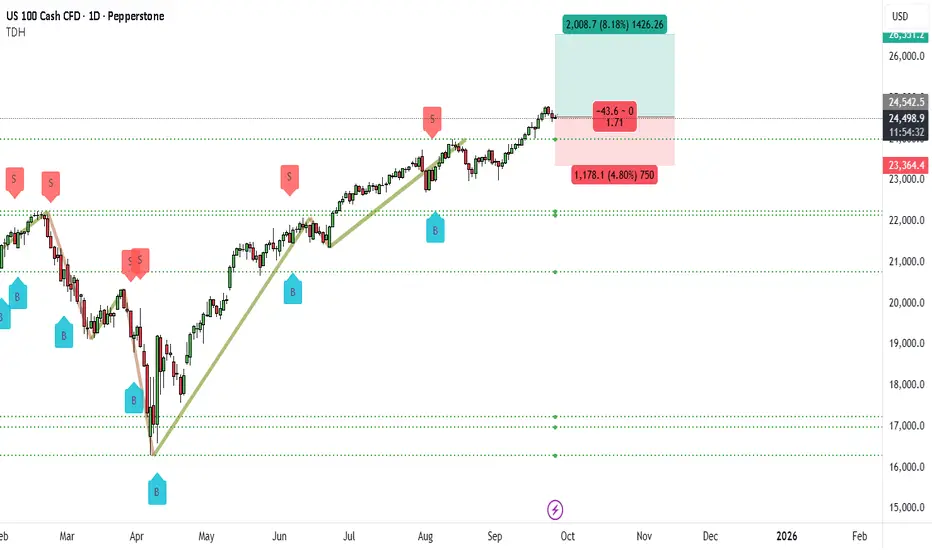
NAS100 Bullish Scenario, Will The Trend Be Followed?The US100 (NASDAQ) daily chart shows a very strong bullish structure. Since April, the index has been in a steady uptrend, creating higher highs and higher lows. Recently, price broke through the important 24,000 zone and is now consolidating just under 24,542. This consolidation at the highs is a healthy sign of strength, suggesting buyers are preparing for the next leg up.
The zone between 24,000 and 24,200 is now a major support base. As long as the market holds above this region, the bullish outlook remains intact. The next major target sits near 26,551, which lines up with an 8% projected upside move. Momentum remains with the bulls, and dips toward support are likely to be bought up quickly.
📌 Trade Setup (Bullish)
• Entry: 24,500 (current market or on breakout above 24,542)
• Stop-Loss: 23,364
• Take-Profit: 26,551
• Risk/Reward: ~1:1.7
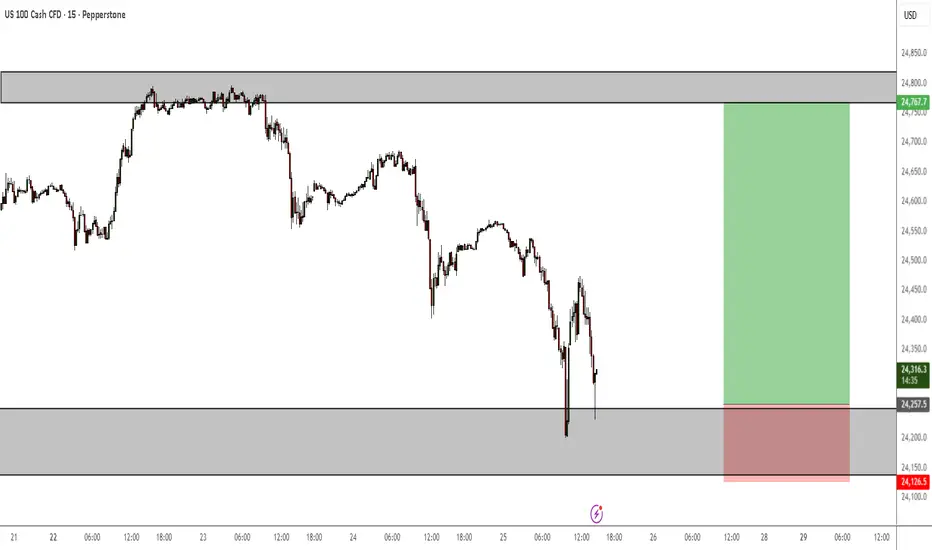
US NAS 100Preferably suitable for scalping and accurate as long as you watch carefully the price action with the drawn areas.
With your likes and comments, you give me enough energy to provide the best analysis on an ongoing basis.
And if you needed any analysis that was not on the page, you can ask me with a comment or a personal message.
Enjoy Trading ;)

NASDAQ H1 OUTLOOKLets Nasdaq Sell
Reasons
Bearish Order Block
Who Is With Me Comment Your Opinion
Good Luck Guys
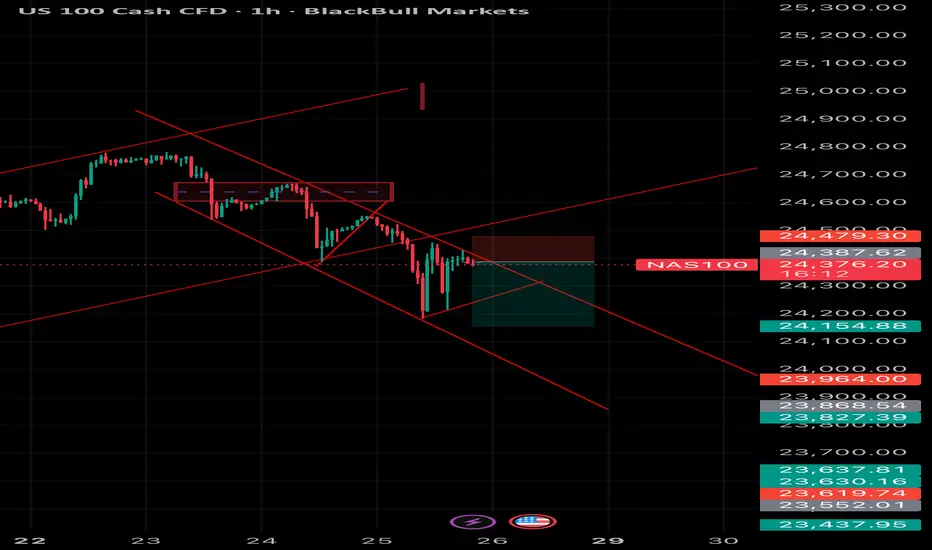
NAS100 Technical Analysis 1 Hour Chart📉 NAS100 Technical Analysis (1H Chart)
NAS100 is trading around 24,374 and continues to respect a strong descending channel, signaling bearish momentum.
• Trend: Price rejected the previous supply zone (24,470 – 24,500) and failed to break above resistance, confirming sellers are still in control.
• Entry Zone: The retest of broken support turned resistance around 24,387 – 24,479 shows bearish rejection with downside continuation likely.
• Target Levels:
• First target: 24,154 (mid-channel support)
• Next target zone: 23,960 – 23,827 (lower channel support)
• Invalidation: A clean 1H close above 24,500 would invalidate this bearish structure and could trigger a corrective move higher.
👉 Short-term bias remains bearish while under 24,500 with room for continuation toward 24,150 – 23,900.
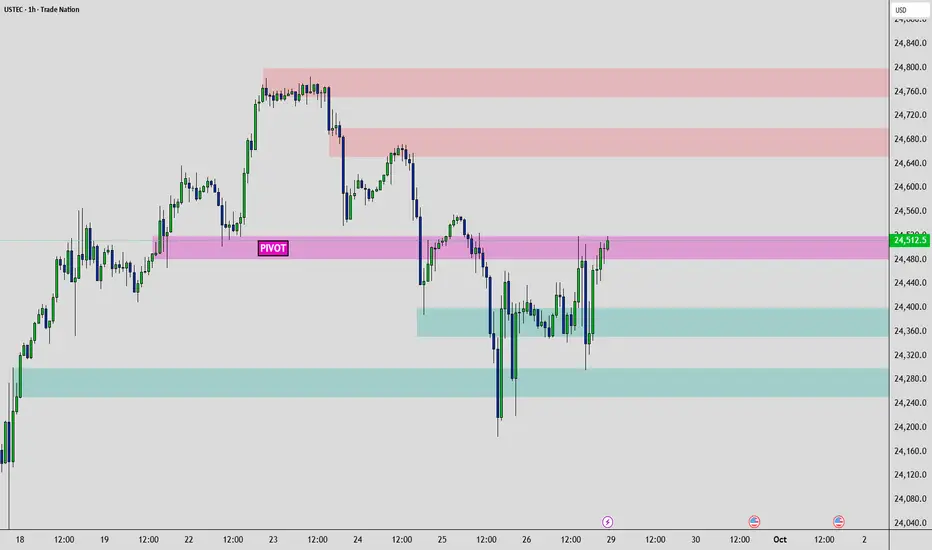
NAS100 - TRADER EDGE
🎯 KEY PIVOT ZONE
🟧SUPPLY ZONE: 24,480 - 24,520
Multiple session POCs clustered in this range
Highest volume VRVP node concentration
Critical resistance where price is currently struggling
📊 PRICE TARGETS
UPSIDE TARGETS ⬆️
T1: 24,650 - 24,700
T2: 24,750 - 24,800
DOWNSIDE TARGETS ⬇️
T1: 24,350 - 24,400
T2: 24,250 - 24,300
⚡⚡ EDGE - HIGHEST PROBABILITY PLAY
Short from 24,480-24,520 supply zone targeting 24,350+ with stop above 24,550
🔍 KEY CONFIRMATION SIGNALS
✅ Rejection at current supply zone with volume
✅ Break below 24,450 support with momentum
✅ Volume expansion on downside moves
📈 TRADE SETUP
🔴PRIMARY BIAS: BEARISH
Short Setup from Supply Zone:
Entry: 24,480 - 24,520 (on rejection/weakness)
Stop Loss: Above 24,550
Target 1: 24,350 - 24,400
Target 2: 24,250 - 24,300
Risk/Reward: 1:4+ ratio
🔄 BIAS FLIP CONDITIONS
🟢TURNS BULLISH IF:
Clean break above 24,550 with strong volume
Hold above 24,520 on any pullback attempt
Volume expansion above pivot zone indicating fresh buying
⚡Then Target:
24,650 - 24,700 (first)
24,750 - 24,800 (extension)
⚠️ RISK MANAGEMENT
Max Risk: 40 points per position
Position Size: Adjust to 1-2% account risk
Time Stop: End of 4-hour session if no movement
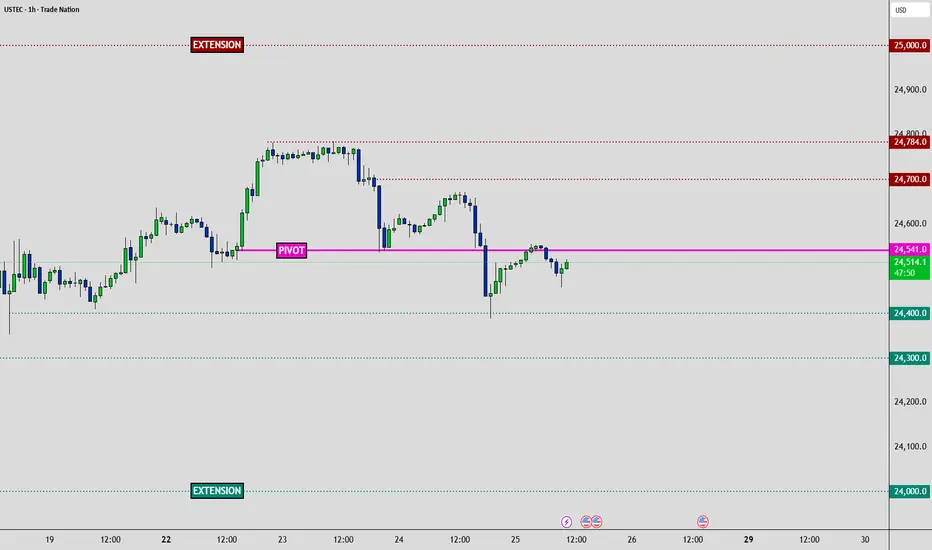
USTEC - 2 Day Traders Edge📈Technical:
MARKET BIAS: Neutral (consolidating at HVN pivot, high-rate sensitivity)
PIVOT ZONE: 24,541 (Exact HVN level)
🥇 Traders Edge - Actionable & Tactical
TRADE SETUPS:
🟧 Risk Warning: Core PCE surprise = 200+ point moves
🟧 Special Risk: High beta to rate moves via PCE
↕️ Bias Flip: Break below 24,400 (bearish) | above 24,700 (bullish)
🟢Long Setup:
• Entry above Pivot | Stop 24,450 | TP: 24,650 | 24,750 | 24,850 - Extended Breakout
🔴Short Setup:
• Entry below 24,400| Stop Above Pivot | TP: 24,300 | 24,000 - Extended Breakdown
🎯KEY LEVELS:
• Strong Resistance: 24,700 | 24,784
• Strong Support: 24,400 | 24,300 | 24,100 | 24,000
🎯PRICE TARGETS:
• Bullish Path: 24,700 → 24,784 → 25,000 (Extended breakout)
• Bearish Path: 24,400 → 24,300 → 24,000 (Extended breakdown)
🚨HIGH-IMPACT EVENTS (48H): (NY Time Zone)
• Sep 25 | 08:30 GDP Q2 Final: 3.3% vs -0.5% → Growth supports tech multiples
• Sep 26 | 08:30 Core PCE MoM: 0.2% vs 0.3% → TECH RATE SENSITIVITY
• Sep 26 | 08:30 Personal Spending: 0.5% vs 0.5% → Tech demand proxy
• Sep 26 | 10:00 Michigan Sentiment: 55.4 → Growth stock appetite
🛑 MASTER RISK EVENT
🟧Friday September 26 | 08:30 (NY Time Zone)
🟧 Core PCE Price Index (MoM) - Forecast: 0.2% vs Previous: 0.3%
🟧 Critical Impact: Fed's preferred inflation gauge determines rate path and USD strength
• Gold: Collapse risk if hot print
• Equities: Rate repricing volatility
• Sectors: Tech rotation sensitivity
⚠️ RISK MANAGEMENT PROTOCOL
• Reduce position sizes before Friday 08:30 EDT
• USD strength reversals impact Gold heavily
• Tech high beta to rate repricing
• Month-end flows amplify volatility
________________________________________
Analysis based on Session Volume POC clusters and HVN methodology
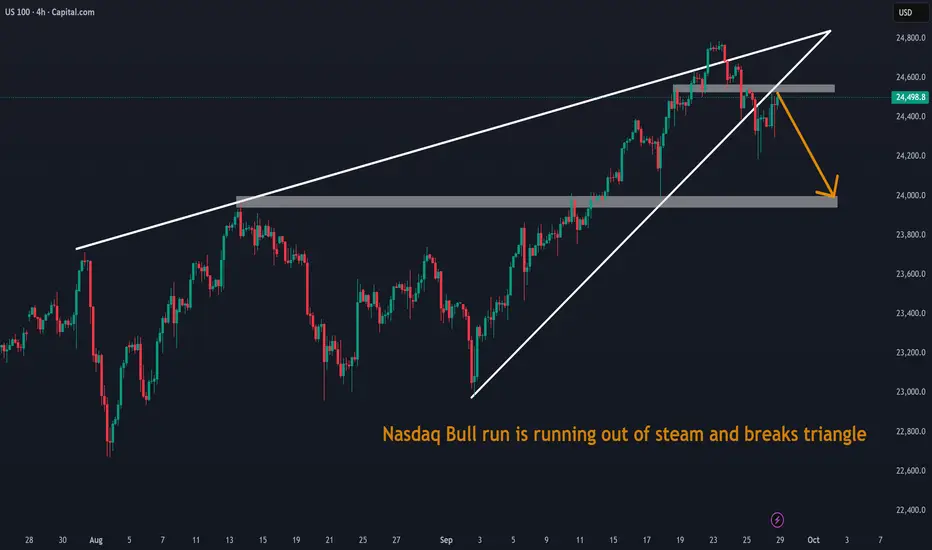
Nasdaq Bull run is running out of steam and breaks triangleNasdaq Bull run is running out of steam and breaks triangle.
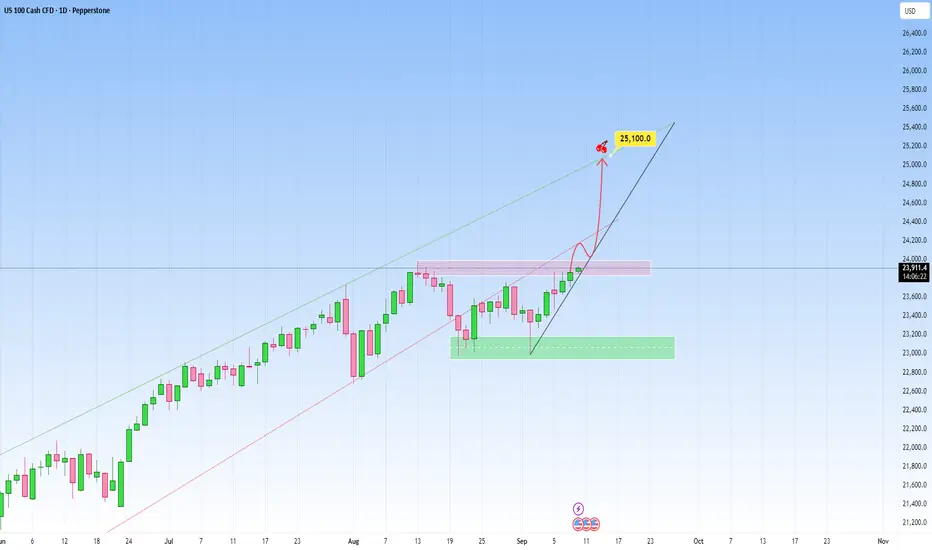
NAS100 Outlook: Recent rise has been steady!Market context on NAS100 remains bullish clearly. The most recent move saw a steady recovery, heading towards the upper boundary of the newly projected channel. And this right here is another great opportunity to get involved.
The market is likely in the early stages of a new impulsive leg to the upside right here.
We could also have short-term consolidation or pullback, then a continuation toward the upper boundary but I believe the latter is more plausible.
My target will be at 25,100.
2025 vs 2024 Growth comparison and OutlookPEPPERSTONE:NAS100 PEPPERSTONE:NAS100 2025 growth % is now more or less where 2024 was at the same date (+16% YTD) the difference is that last year in September Fed cut 0.5% and there was a bright future with inflation really going down, unemployment low and election coming. This year instead we have for the last quarter a GDP that is slowing , higher inflation (it did not decrease vs last September) and definitely a worst employment situation..So in 2022 NAS100 did another 10% from sep to dec 2024 to get to 26% . I really doubt we will do the same this year.(it would mean closing 2025 at 26400!...Just too put thinks in perspective PEPPERSTONE:NAS100 PEPPERSTONE:NAS100 2025 growth % is now more or less where 2024 was at the same date (+16% YTD) the difference is that last year in September Fed cut 0.5% and there was a bright future with inflation really going down, unemployment low and election coming. This year instead we have for the last quarter a GDP that is slowing , higher inflation (it did not decrease vs last September) and definitely a worst employment situation..So in 2022 NAS100 did another 10% from sep to dec 2024 to get to 26% . I really doubt we will do the same this year.(it would mean closing 2025 at 26400!...Just too put thinks in perspective
NASDAQ100 HIGH PROBABILITY SETUP SOON!!!🚨 NAS100 HIGH PROBABILITY BUY SETUP 🚨
* Here We Can See Clearly The Next Potential Moves For US100 Coming Hours/Days.
* Keep Your Eyes Close On Your Trading Positions.
* Happy PIP Hunting Traders.
FXKILLA.

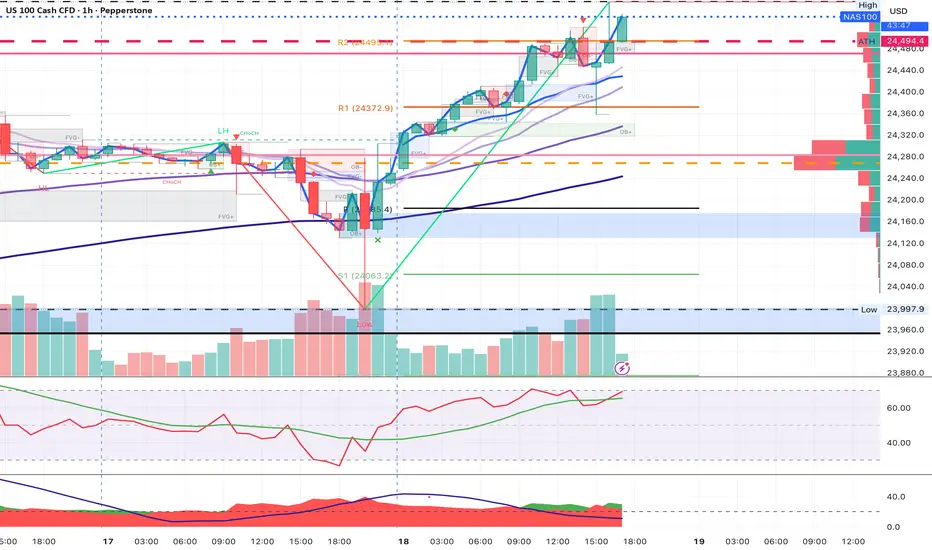
Nasdaq 100 Analysis: Index Hits All-Time HighNasdaq 100 Analysis: Index Hits All-Time High
As the chart shows, today the Nasdaq 100 index has, for the first time in history, climbed above the 24,500 level.
According to media reports, bullish sentiment was driven by the long-awaited Fed decision to cut interest rates for the first time in 2025.
Although the Fed also indicated it would remain cautious about further cuts, the easing acted as a bullish catalyst for the entire stock market – European equities also advanced today, with technology companies leading the way.
Technical Analysis of the Nasdaq 100
When looking at the Nasdaq 100 index within the context of the September rally (highlighted by the blue channel), we note the following:
→ In mid-September, price action reflected market optimism, as the index traded in the upper half of the channel – with resistance at the upper boundary (R) and support at line S.
→ Yesterday’s volatility spike produced a similar move (marked with an arrow) to the one we highlighted in today’s earlier gold analysis, namely a sharp reversal from the lower boundary of the channel (essentially a bullish engulfing pattern, albeit less clear due to volatility and the chosen timeframe).
Following the reversal from the lower boundary, which unfolded aggressively (a sign of bullish conviction), the price advanced steadily, breaking through key levels:
→ the midline of the blue channel;
→ the R2 resistance line shown in red;
→ the former all-time high at 24,165.
Moreover, the index’s behaviour around 24,300 demonstrated the persistence of buyers – the price moved above a cluster of local resistances and then extended its rally.
Bearish view:
→ bullish momentum has pushed the RSI indicator into overbought zone;
→ when attempting to break above the psychological 24,500 level, the price failed to hold, suggesting a false bullish breakout.
Given the above, we could assume that optimism prevails in the market, supported by the Fed’s decision:
→ on the one hand, further gains towards the upper boundary of the blue channel may take place;
→ on the other hand, the market may be overheated and vulnerable to a correction (for instance, back towards the blue midline).
This article represents the opinion of the Companies operating under the FXOpen brand only. It is not to be construed as an offer, solicitation, or recommendation with respect to products and services provided by the Companies operating under the FXOpen brand, nor is it to be considered financial advice.

US NAS100Preferably suitable for scalping and accurate as long as you watch carefully the price action with the drawn areas.
With your likes and comments, you give me enough energy to provide the best analysis on an ongoing basis.
And if you needed any analysis that was not on the page, you can ask me with a comment or a personal message.
Enjoy Trading ;)

NAS100 Pullback and Liquidity Sweep in H4 Demand. Time to LongNQ has given a nice deep pullback into H4 demand. Time to pull the trigger.
US100 Will Keep Growing! Buy!
Hello,Traders!
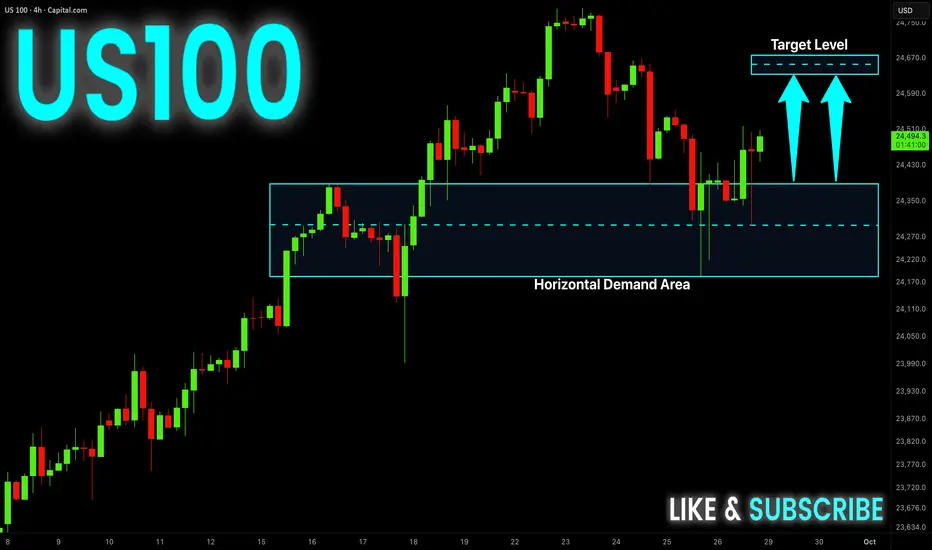
US100 Price reacts from the horizontal demand area, shifting order flow bullish. SMC structure favors upside with liquidity targets set at 24,670 zone. Time Frame 4H.
Buy!
Comment and subscribe to help us grow!
Check out other forecasts below too!
Disclosure: I am part of Trade Nation's Influencer program and receive a monthly fee for using their TradingView charts in my analysis.
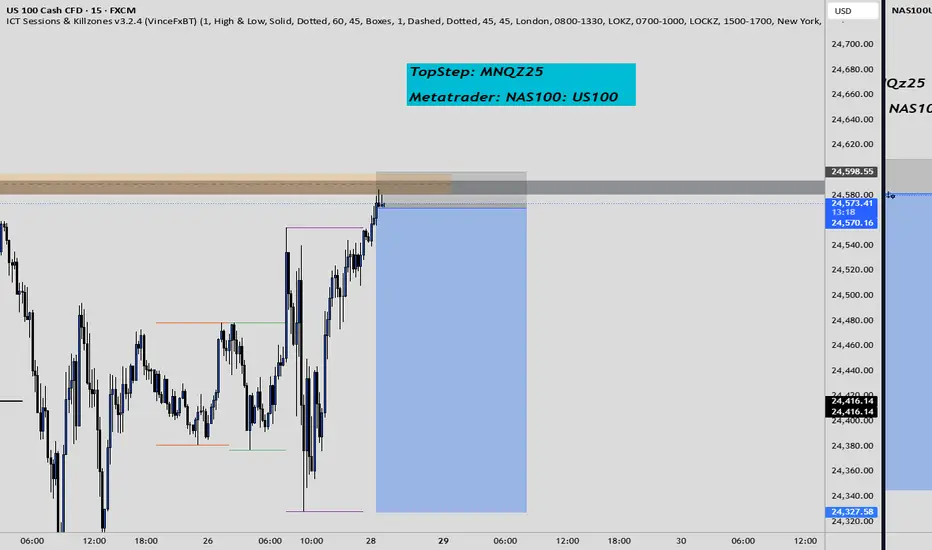
Beyond the Chart - NAS100 Through Technicals & FundamentalsNAS100 has just completed its move into the Discount PD Array zone I highlighted yesterday. On the 1H timeframe, I pointed out the prevailing bearish trend and marked this area as a key target. Once price tapped the zone, sellers lost momentum and buyers stepped in, shifting market control.
Now we’re seeing an inverse Z formation, with a Fair Value Gap (FVG) and a Breaker Block (BB) cutting across the structure. If buyers step in again, as they did in the earlier PD Array, my upside target will be 24,580.
NAS100We looking for buying opportunities as the market is now in a continuous momentum to the upside resulting in buying opportunities|30 MIN TIMEFRAME

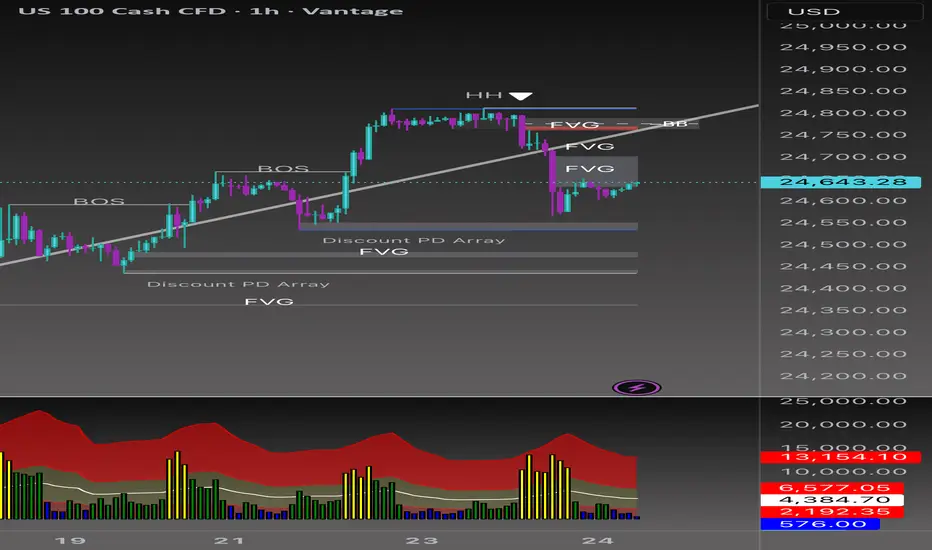
Beyond the Chart - NAS100 Through Technicals & Fundamentals📉 NAS100 VANTAGE:NAS100
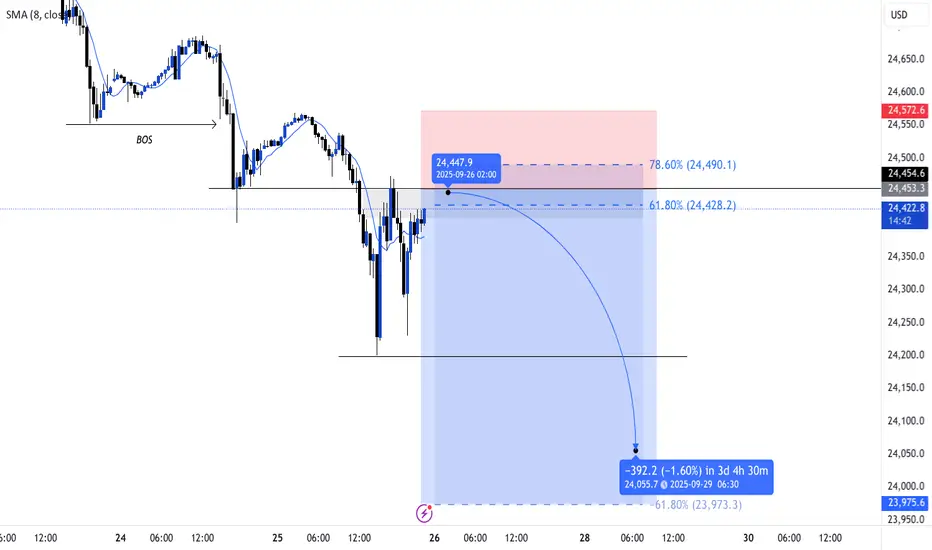
Short Bias Analysis (1H Chart)
The market recently formed a Higher High (HH) followed by a Break of Structure (BOS) to the downside, suggesting a potential bearish shift. This move left behind multiple Fair Value Gaps (FVGs), now acting as supply zones.
Key Points
• Liquidity grab above the HH, followed by strong bearish momentum.
• Two FVGs aligning with short bias.
• Current retracement into inefficiencies offers a potential short entry.
• Downside targets: Discount PD Array and lower FVGs (24,480–24,440).
Trade Idea
• Entry Zone: 24,700–24,750 (upper FVG)
• Stop Loss (SL): Above 24,800 (invalidates bearish idea)
• Take Profit 1 (TP1): 24,560
• Take Profit 2 (TP2): 24,440
Risk management remains key 🔑 if price closes above the upper FVG/BB zone, short bias is invalidated.
NAS100 - Last Quarter Hype or Abyss?Dear Friends in Trading,
Interesting Read:
investinglive.com
Rate cuts invigorate buying optimism at this time:
1.Investing Institutions are undeterred by "overbought conditions"
2. Will I follow the buying Hype?
3. Marching towards 25000 or a cliff?
4. Am I dragged along into extreme red to maximize annual institutional profits?
5. What does the overbought conditions tell me is the current fair market value?
23700
I sincerely hope my point of view offers a valued insight.
Thank you for taking the time study my analysis.

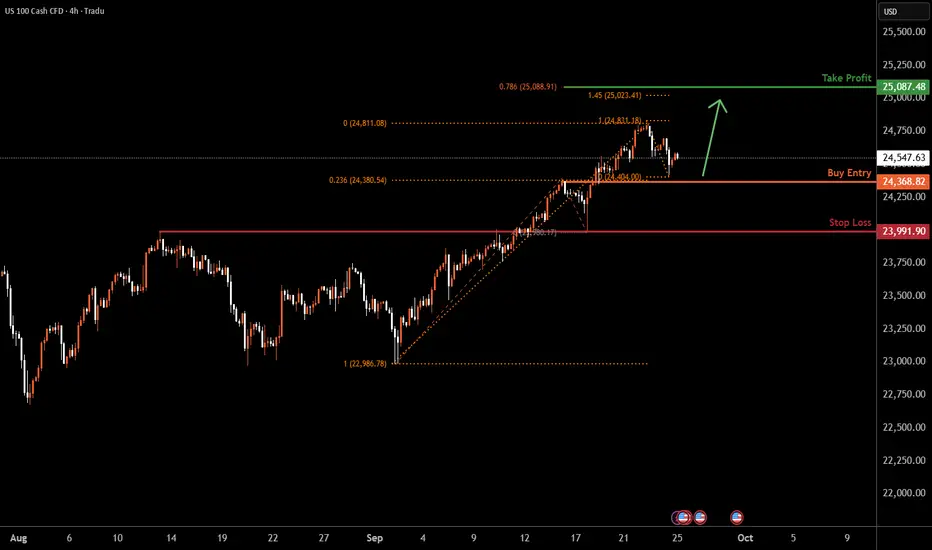
NAS100 H4 | Bullish momentum to extend?NAS100 is falling towards the buy entry at 24,368.82, which is a pullback support that aligns with the 23.6% Fibonacci retracement and could bounce from this level to the upside.
Stop loss is at 23,991.90, which is an overlap support.
Take profit is at 24,087.48, which aligns with the 78.6% Fibonacci projection and the 161.8% Fibonacci extension.
High Risk Investment Warning
Trading Forex/CFDs on margin carries a high level of risk and may not be suitable for all investors. Leverage can work against you.
Stratos Markets Limited (tradu.com ):
CFDs are complex instruments and come with a high risk of losing money rapidly due to leverage. 65% of retail investor accounts lose money when trading CFDs with this provider. You should consider whether you understand how CFDs work and whether you can afford to take the high risk of losing your money.
Stratos Europe Ltd (tradu.com ):
CFDs are complex instruments and come with a high risk of losing money rapidly due to leverage. 66% of retail investor accounts lose money when trading CFDs with this provider. You should consider whether you understand how CFDs work and whether you can afford to take the high risk of losing your money.
Stratos Global LLC (tradu.com ):
Losses can exceed deposits.
Please be advised that the information presented on TradingView is provided to Tradu (‘Company’, ‘we’) by a third-party provider (‘TFA Global Pte Ltd’). Please be reminded that you are solely responsible for the trading decisions on your account. There is a very high degree of risk involved in trading. Any information and/or content is intended entirely for research, educational and informational purposes only and does not constitute investment or consultation advice or investment strategy. The information is not tailored to the investment needs of any specific person and therefore does not involve a consideration of any of the investment objectives, financial situation or needs of any viewer that may receive it. Kindly also note that past performance is not a reliable indicator of future results. Actual results may differ materially from those anticipated in forward-looking or past performance statements. We assume no liability as to the accuracy or completeness of any of the information and/or content provided herein and the Company cannot be held responsible for any omission, mistake nor for any loss or damage including without limitation to any loss of profit which may arise from reliance on any information supplied by TFA Global Pte Ltd.
The speaker(s) is neither an employee, agent nor representative of Tradu and is therefore acting independently. The opinions given are their own, constitute general market commentary, and do not constitute the opinion or advice of Tradu or any form of personal or investment advice. Tradu neither endorses nor guarantees offerings of third-party speakers, nor is Tradu responsible for the content, veracity or opinions of third-party speakers, presenters or participants.