same stratlooking for first 1m resistance in this order block.
short it back to thsi main support zone
NQCUSD trade ideas
NAS100 ShortElite analysis
Discretionary trade with confirmations
Targeting London liquidity
Executed on the 30 second time frame

Short term idea for NAS100Simplicity is the best, I am using any complicated way of trade. Just draw some lines and do the trade.


Nas100 Trade Set Up Sep 22 2025www.tradingview.com
Price is trading in between PDH/PDL and is approaching a 4h FVG so if it respects it i will look for internal bearish structure IFVG on the 1m to take sells to SSL levels

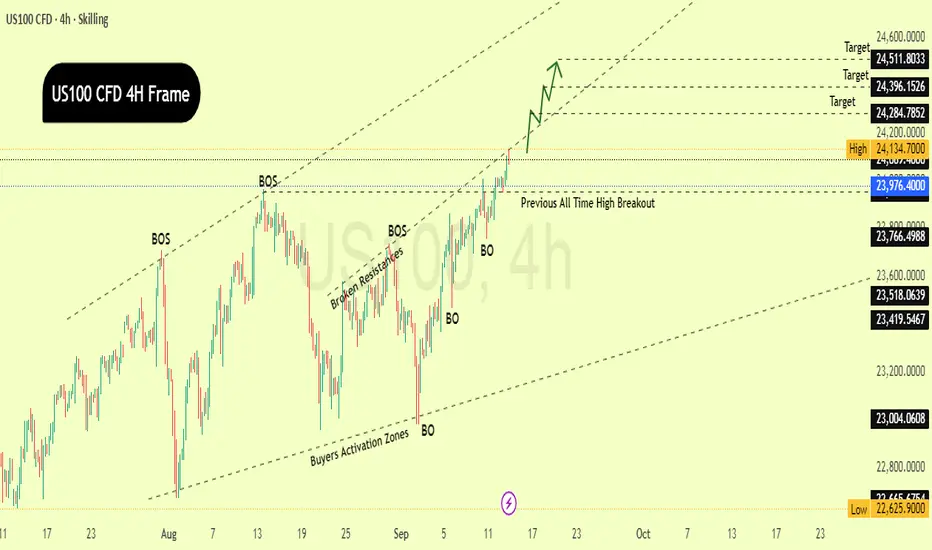
US100 Breaks All-Time High – Bullish Targets Ahead!This 4-hour chart of the US100 (Nasdaq) shows a strong bullish trend supported by multiple breakouts (BO) and break of structure (BOS) signals over the past few weeks. After retesting and bouncing from key buyer activation zones, the price has consistently broken through previous resistance levels.
Most notably, the index has just broken above its previous all-time high around 23,976, signaling strong momentum and potential for further upside. The price is currently hovering near 24,089, with key short-term targets marked at:
Target : $24,284
Target : $24,396
Target : $24,511
These targets align with the upper boundary of a rising parallel channel, suggesting the bulls are in control for now.
The chart projects a continuation of this bullish move, with a stair-step rally expected if the current breakout holds. As long as the price stays above the breakout zone and respects the structure, the upside targets remain in play.
In short: US100 is showing solid bullish strength, breaking above its previous highs with clear upside potential.
Educational Idea.
Here we go again, the 4th trade idea for NASDAQ.Trade what you see, not what you feel. After three consecutive wins on NASDAQ, let's see if this will be the fourth? I don't intend to show off here, but I want to learn to be more disciplined with my trading and increase my confidence. And who knows, this might also be useful for others.

US NAS 100Preferably suitable for scalping and accurate as long as you watch carefully the price action with the drawn areas.
With your likes and comments, you give me enough energy to provide the best analysis on an ongoing basis.
And if you needed any analysis that was not on the page, you can ask me with a comment or a personal message.
Enjoy Trading ;)

NAS100Nasdaq-100 (NAS100) Performance on September Options Expiration Days (2015–2024)
Based on historical data for the Invesco QQQ ETF (which tracks the Nasdaq-100), below is the daily performance on the third Friday of September each year—the standard options expiration day. The result is "Rise" if the closing price increased from the previous trading day's close, or "Fall" if it decreased. Data is sourced from reliable financial records, including adjusted closing prices.
- 2015: Fall (-0.45%)
- 2016: Rise (+0.32%)
- 2017: Rise (+0.62%)
- 2018: Fall (-0.20%)
- 2019: Rise (+0.11%)
- 2020: Fall (-1.18%)
- 2021: Fall (-1.25%)
- 2022: Fall (-1.69%)
- 2023: Fall (-1.13%)
- 2024: Fall (-0.19%)

US NAS100Preferably suitable for scalping and accurate as long as you watch carefully the price action with the drawn areas.
With your likes and comments, you give me enough energy to provide the best analysis on an ongoing basis.
And if you needed any analysis that was not on the page, you can ask me with a comment or a personal message.
Enjoy Trading ;)

Buy Nas100Nas is bullish and will continue buying. There are two possible buy entries, being the demand zone, or the liquidity grab zone. Do not enter a trade on the demand zone unless there is another confirmation on lower time frames. Remember it is Friday tomorrow, and the market can be very manipulative on Friday. Do not force trades, there is nothing wrong with not having a trading day. Trade what you see, and not what you feel.

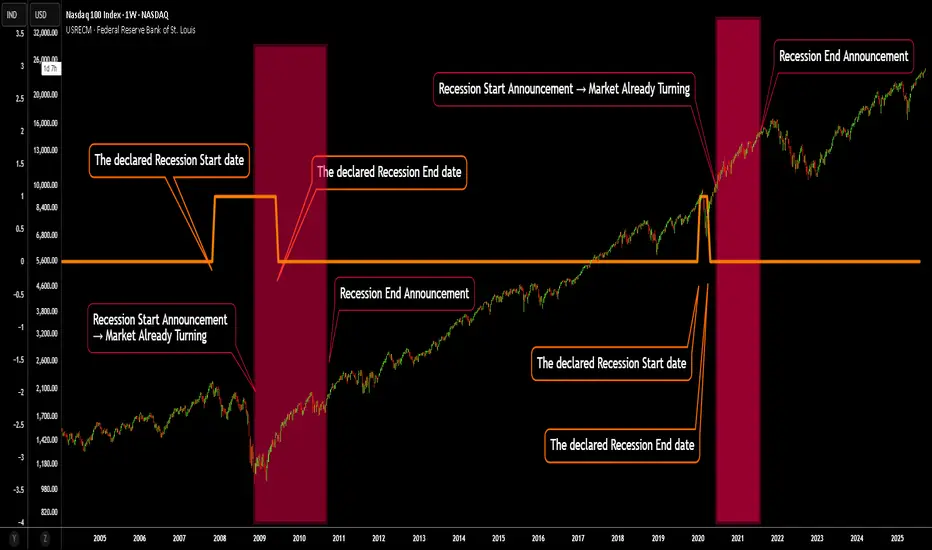
Recession “Announcements” vs. Reality — A Contrarian SignalMost traders anchor their sentiment to the official declarations of a recession. But here’s the catch: by the time policymakers and institutions announce “we are in a recession”, the contraction has almost always run its course.
If you are waiting for an official announcement we are in a recession in order to get out, It will be too late. You will likely be selling to the smart money buying for the eventual rise.
The game is rigged against the novice trader relying on generally available news.
On the chart:
The orange line marks the actual recession periods identified by economic data.
The red background shading highlights when the recession was officially recognized and reported.
Notice the lag: announcements consistently come after the worst is already behind us. Historically, these “recognition windows” line up closer with market bottoms than with tops.
👉 The key takeaway:
When you hear that a recession has been declared, it’s often not a sell signal — it’s closer to a buy signal. By then, the market has already priced in the pain, and recovery is underway.
This perspective flips conventional wisdom on its head: don’t fear the announcement — see it as confirmation that the worst is behind us. And do not wait for it to tell you we are going in to a recession, look at what the smart money is doing, what insiders are doing, what the banks are doing. Many thin that lower interest rates means a boost to business. But they are wrong.
Banks will charge as much as they think the economy can sustain. If Interest rates are rising, they know that business will be doing better. Falling interest rates tells you the banks know they can not get away with charging more and the economy is tanking.
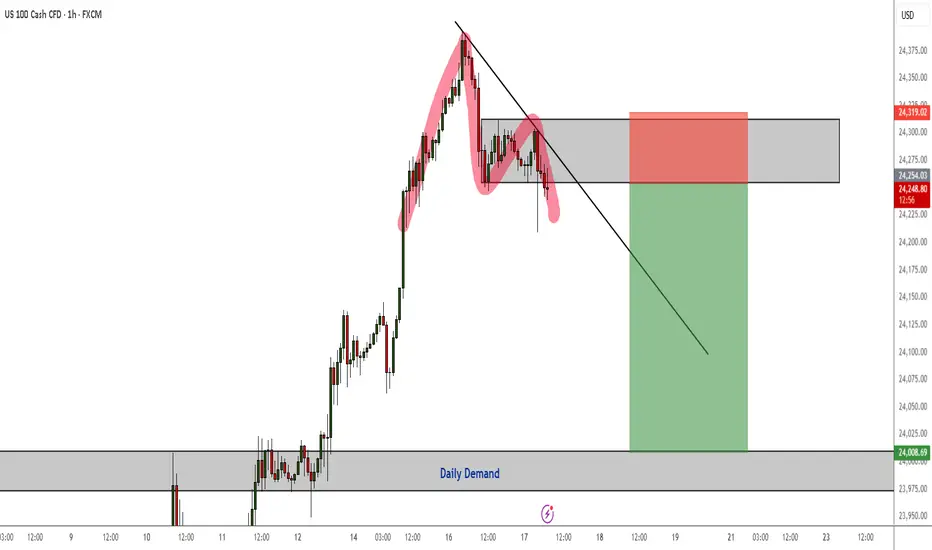
NAS100 Pressure to the Downside Continues - Double Top RejectionPressure to the downside will likely resume today for NQ as we now have a double top rejection pattern as confirmation to short.
I am aiming for the daily demand zone for my TP.
NASDAQ100 HIGH PROBABILITY SETUP SOON!!!🚨 NAS100 HIGH PROBABILITY SELL SETUP 🚨
* Here We Can See Clearly The Next Potential Move For US100 Coming Hours/Days.
* Keep Your Eyes Close On Your Trading Positions.
* Happy PIP Hunting Traders.
FXKILLA.

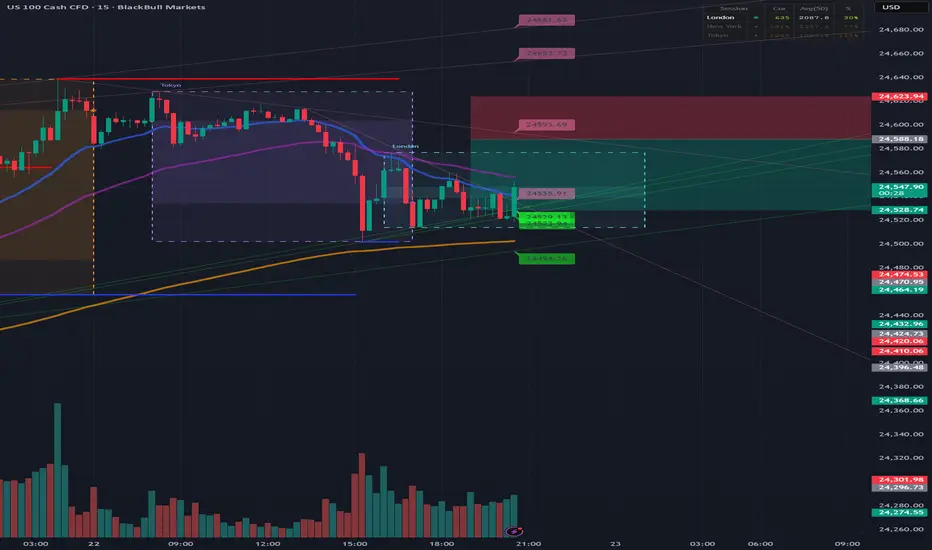
NAS100 Technical Forecast: Key Levels & Traps🚀 NAS100 Technical Forecast: Key Levels & Traps 🐻
*Analysis as of Sept 20, 2025 (12:50 AM UTC+4)*
📊 Overall Market Context:
Price: 24,610. Geopolitical events remain a key volatility driver. Current price action suggests a cautious market seeking direction after recent moves.
🔍 Key Technical Indicators:
• RSI (14): Neutral zone (~50). No strong overbought/oversold signal.
• Bollinger Bands (20): Price near the middle band, indicating balanced volatility.
• Moving Averages: Watching for a potential bearish crossover on the 4H chart. Key resistance at the 50-EMA.
• VWAP: Current price trading around the session's VWAP; a break above signals intraday bullish bias.
🎯 Critical Support & Resistance:
• Immediate Resistance: 24,800 -> 25,000 (Psychological)
• Strong Resistance: 25,250 (Previous High)
• Immediate Support: 24,500 -> 24,300
• Strong Support: 24,000 (Key Level)
⚠️ Pattern Watch:
• Bull Trap Risk: A false breakout above 24,800 could lure buyers before a drop.
• Bear Trap Risk: A sharp rejection from 24,300 could trap sellers before a rally.
• No clear Harmonic or Elliott Wave pattern on lower timeframes; monitoring for setup.
📈 Intraday Trading (5M-1H Charts):
• BUY (Long): Above 24,650, targeting 24,800. Stop Loss: 24,550.
• SELL (Short): Below 24,500, targeting 24,300. Stop Loss: 24,650.
*Confirmation: Use 5-min RSI divergence and volume spikes.*
📉 Swing Trading (4H-Daily Charts):
• BUY Swing: On a bullish reversal candle at 24,300 support, target 25,000+. SL below 24,000.
• SELL Swing: On a rejection at 24,800 resistance, target 24,000. SL above 25,100.
*Wait for a 4H close above/below key levels for confirmation.*
🎲 Risk Management:
Always use a 1:2 Risk/Reward ratio. Protect your capital.
For individuals seeking to enhance their trading abilities based on the analyses provided, I recommend exploring the mentoring program offered by Shunya Trade. (Website: shunya dot trade)
I would appreciate your feedback on this analysis, as it will serve as a valuable resource for future endeavors.
Sincerely,
Shunya.Trade
Website: shunya dot trade
📝 TRADING CHECKLIST
Before entering any position:
- ✅ Confirm volume supports move
- ✅ Check RSI for divergences
- ✅ Verify multiple timeframe alignment
- ✅ Set stop loss before entry
- ✅ Calculate position size
- ✅ Review correlation with DXY/SPX
- ✅ Check economic calendar
- ✅ Assess market sentiment
⚠️Disclaimer: This post is intended solely for educational purposes and does not constitute investment advice, financial advice, or trading recommendations. The views expressed herein are derived from technical analysis and are shared for informational purposes only. The stock market inherently carries risks, including the potential for capital loss. Therefore, readers are strongly advised to exercise prudent judgment before making any investment decisions. We assume no liability for any actions taken based on this content. For personalized guidance, it is recommended to consult a certified financial advisor.

NAS100 Short SetupTrend: Bullish
Divergence: Bearish
Continuation Pattern : None
Reversal Pattern: Double Top
Bias: Bearish
Scenario: Sell Stop at Neckline breakout
Trade Plan
Stop Loss 24750
Entry Level 24400
TP1 24230

3rd Short term trade with NASDAQAfter two consecutive profits on the NASDAQ, I hope this third trade will also yield satisfactory result. A good risk-reward ratio is crucial in trading.

NSDQ100 volatility, triple-witching could exaggerate swings.Nasdaq 100 Trading Drivers
Macro backdrop:
US data came in strong:
Jobless claims fell to 231k (vs. 240k exp; prior 264k).
Continuing claims declined to 1.92m (vs. 1.95m exp).
Philly Fed survey surged to 23.2 (vs. 1.7 exp), an 8-month high.
This eased US slowdown fears and reinforced risk-on sentiment.
Equities:
Nasdaq +0.94% → new record high.
Tech/semis led: Intel (+22.8%) strongest S&P performer after Nvidia’s $5bn investment and US gov’t stake news. Philadelphia Semiconductor Index +3.6%.
Momentum broadened → Russell 2000 +2.5%, first record high since 2021.
Rates:
Treasuries sold off on strong data → 10yr yield +1.7bps to 4.11%, 30yr +3.4bps. Higher yields a potential headwind if sustained.
Event risk:
Trump–Xi call (9 a.m. ET): key for TikTok’s US future & broader trade tone. Risk of mixed headlines given tensions (China soybeans skip, Gaza criticism, Taiwan aid freeze).
BoJ surprise: announced unwind of $4.2bn/year ETF holdings → dampened global risk tone.
US triple-witching: options/futures expiries today → elevated intraday volatility likely.
Nasdaq 100 Trading Takeaway
Bullish momentum intact: record highs fueled by tech & semiconductor leadership.
Short-term watchpoints: Trump–Xi headlines and BoJ shift may inject volatility; triple-witching could exaggerate swings.
Key risk: rising US yields may cap upside if bond sell-off deepens.
Bias: Still risk-on / buy dips near-term, but position sizing should account for headline-driven volatility today.
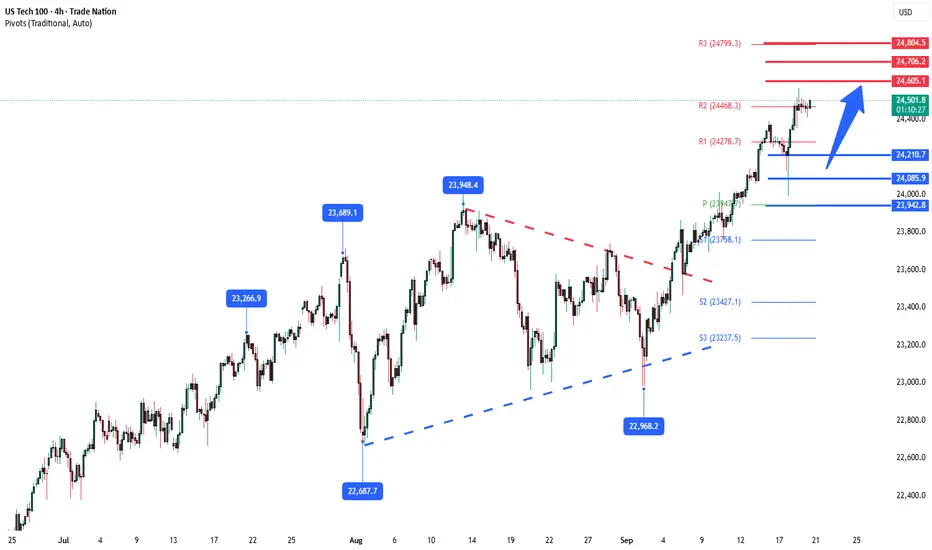
Key Support and Resistance Levels
Resistance Level 1: 24600
Resistance Level 2: 24710
Resistance Level 3: 24800
Support Level 1: 24210
Support Level 2: 24085
Support Level 3: 24940
This communication is for informational purposes only and should not be viewed as any form of recommendation as to a particular course of action or as investment advice. It is not intended as an offer or solicitation for the purchase or sale of any financial instrument or as an official confirmation of any transaction. Opinions, estimates and assumptions expressed herein are made as of the date of this communication and are subject to change without notice. This communication has been prepared based upon information, including market prices, data and other information, believed to be reliable; however, Trade Nation does not warrant its completeness or accuracy. All market prices and market data contained in or attached to this communication are indicative and subject to change without notice.
Key risk: rising US yields may cap upside if bond sell-off deepens.
Bias: Still risk-on / buy dips near-term, but position sizing should account for headline-driven volatility today.
Key Support and Resistance Levels
Resistance Level 1: 24600
Resistance Level 2: 24710
Resistance Level 3: 24800
Support Level 1: 24210
Support Level 2: 24085
Support Level 3: 24940
This communication is for informational purposes only and should not be viewed as any form of recommendation as to a particular course of action or as investment advice. It is not intended as an offer or solicitation for the purchase or sale of any financial instrument or as an official confirmation of any transaction. Opinions, estimates and assumptions expressed herein are made as of the date of this communication and are subject to change without notice. This communication has been prepared based upon information, including market prices, data and other information, believed to be reliable; however, Trade Nation does not warrant its completeness or accuracy. All market prices and market data contained in or attached to this communication are indicative and subject to change without notice.
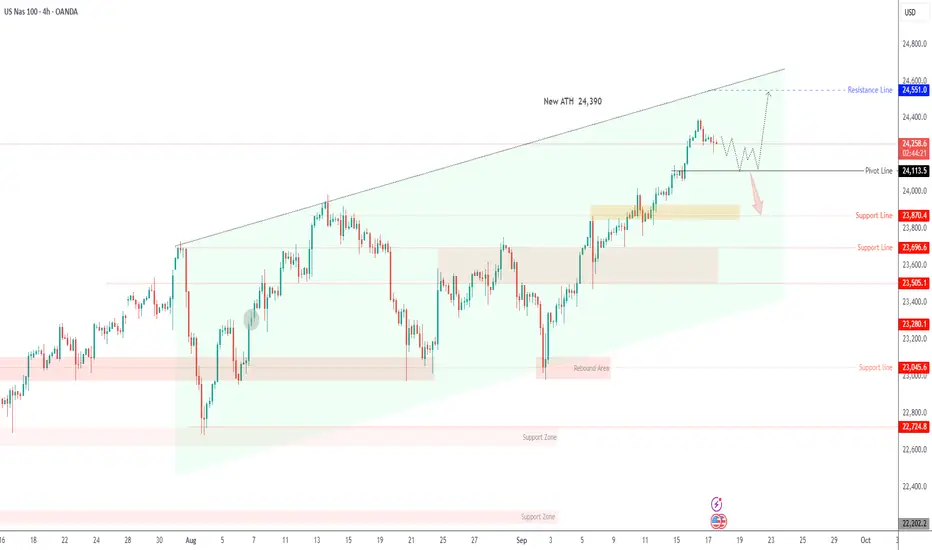
USNAS100 Braces for Fed Decision – Key Pivot at 24,300USNAS100 – Overview
The Nasdaq is set for a highly volatile session as markets await the Federal Reserve’s rate decision later today.
Traders widely expect a 25 bps cut, but a surprise 50 bps cut—though less likely—would signal stronger confidence in stable inflation and U.S. economic health, fueling a strong bullish rally.
Even if the Fed delivers the expected 25 bps cut, the key market mover will be Chair Powell’s press conference and the updated dot plot, which could reshape expectations for future easing.
Technical Outlook
📉 Bearish scenario
While trading below 24,300, price shows potential for a pullback toward 24,115.
A confirmed break below 24,115 would extend the bearish move toward 23,870 → 23,700.
📈 Bullish scenario
Stabilization above 24,115 keeps the broader uptrend intact.
A breakout above 24,300 would confirm bullish momentum, targeting 24,550 → 24,700 → 24,850.
📌 Market Context:
50 bps cut + dovish Powell → strong bullish breakout above 24,300 toward 24,550+.
25 bps cut + cautious guidance → moderate moves; price may remain range-bound or retest 24,115 before resuming higher.
Hawkish tone → deeper correction toward 23,870 or lower.
NAS100 longits broke weekly resistance and i think its going to go up from this current price, since its the stockmarket the tp is high cause of how it moves. long term swing.


Direction bias on Nas100I'm bullish on nas100 and to continue the bullish run I'm expecting a pull back to sweet the inducement liquidity low then continue to the upside.

Nas100 Trade Set Up Sep 18 2025www.tradingview.com
price swept PDH and changed state on the 1h and created a 15m FVG so i want to see a retest of the CISD or 15m FVG, respect them to see bearish structure to the downside towards PDL but if price inverts 15m FVG i will look for buys
