NAS100 longits broke weekly resistance and i think its going to go up from this current price, since its the stockmarket the tp is high cause of how it moves. long term swing.
NQCUSD trade ideas


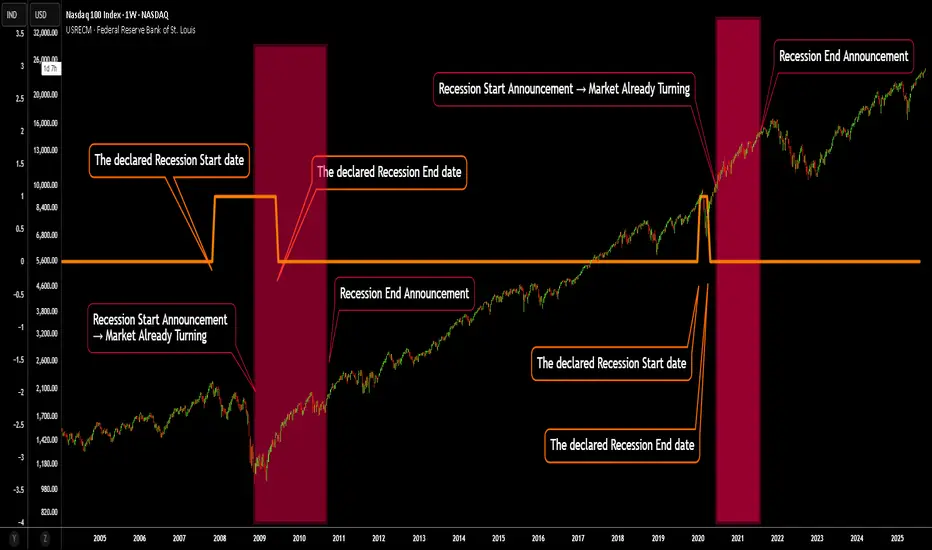
Recession “Announcements” vs. Reality — A Contrarian SignalMost traders anchor their sentiment to the official declarations of a recession. But here’s the catch: by the time policymakers and institutions announce “we are in a recession”, the contraction has almost always run its course.
If you are waiting for an official announcement we are in a recession in order to get out, It will be too late. You will likely be selling to the smart money buying for the eventual rise.
The game is rigged against the novice trader relying on generally available news.
On the chart:
The orange line marks the actual recession periods identified by economic data.
The red background shading highlights when the recession was officially recognized and reported.
Notice the lag: announcements consistently come after the worst is already behind us. Historically, these “recognition windows” line up closer with market bottoms than with tops.
👉 The key takeaway:
When you hear that a recession has been declared, it’s often not a sell signal — it’s closer to a buy signal. By then, the market has already priced in the pain, and recovery is underway.
This perspective flips conventional wisdom on its head: don’t fear the announcement — see it as confirmation that the worst is behind us. And do not wait for it to tell you we are going in to a recession, look at what the smart money is doing, what insiders are doing, what the banks are doing. Many thin that lower interest rates means a boost to business. But they are wrong.
Banks will charge as much as they think the economy can sustain. If Interest rates are rising, they know that business will be doing better. Falling interest rates tells you the banks know they can not get away with charging more and the economy is tanking.
Nas100 Trade Set Up Sep 18 2025www.tradingview.com
price swept PDH and changed state on the 1h and created a 15m FVG so i want to see a retest of the CISD or 15m FVG, respect them to see bearish structure to the downside towards PDL but if price inverts 15m FVG i will look for buys

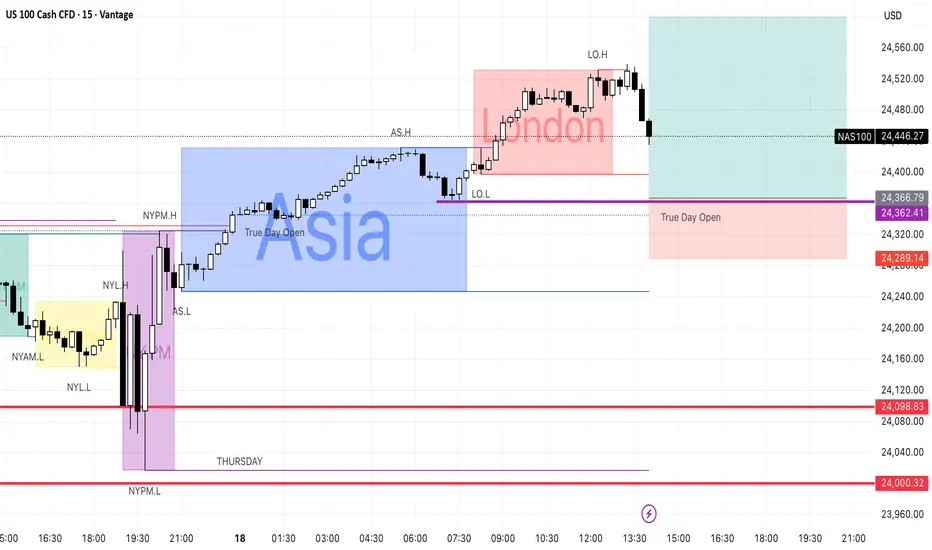
sweep London lows and up we go !!I believe price will sweep liquidity at the London low the I believe price will head back up past the todays London highs.
US NAS 100Preferably suitable for scalping and accurate as long as you watch carefully the price action with the drawn areas.
With your likes and comments, you give me enough energy to provide the best analysis on an ongoing basis.
And if you needed any analysis that was not on the page, you can ask me with a comment or a personal message.
Enjoy Trading ;)

Nasdaq 100 Eyes 24,550–25,050 if Fed Signals Dovish ToneUSNAS100 – Technical Overview
The Nasdaq remains in focus as traders await the Federal Reserve’s rate decision later this week.
Markets largely expect a 25 bps cut, but the key driver will be Chair Powell’s tone on inflation, labor-market weakness, and tariff risks.
Earlier record highs across U.S. indexes were fueled by tech strength and optimism over U.S.–China trade talks, while gold’s surge to new highs underscores strong safe-haven demand.
Technical Outlook
📉 Correction phase
Price is expected to retest 24,240 → 24,115 before attempting another bullish leg.
A sustained drop below 24,110 would expose deeper support at 23,870.
📈 Bullish continuation
Holding above 24,240 – 24,115 keeps the broader uptrend intact.
Once consolidation is complete, a renewed rally targets 24,550 → 24,800, with a potential extension to 25,050 if the Fed delivers a more dovish message.
Key Levels
Pivot: 24,380
Resistance: 24,550 – 24,800 – 25,050
Support: 24,240 – 24,115 – 23,870
📌 Market Context:
A 25 bps Fed cut may offer moderate support for tech-heavy indices, while a more aggressive 50 bps cut could accelerate the next breakout toward fresh ATHs. Conversely, a hawkish tone from Powell could trigger a deeper correction before the next leg higher.

FOMC has cleared liquidity levels around this technical rangeNews Drivers do not overpower technicals, the fundamentally driven movements are just banging around into huge money pending orders. No way around these mechanics.
That what we saw today, and what will continue to happen forever and ever 💎 Not saying it will always be a ricochet like today, but the orders are always there.

78.60% PUSH-UP (nas100)All technicals are pointing towards a big push upwards (NAS100).
Keep risk to a limit on this one. Let's see how she plays out.

SHORT ON NASNAS has created a nice rising channel (bearish reversal pattern) and is starting to push outside of the channel to the downside.
I will be selling nas to the previous low looking to catch 800-900 points.

US NAS100Preferably suitable for scalping and accurate as long as you watch carefully the price action with the drawn areas.
With your likes and comments, you give me enough energy to provide the best analysis on an ongoing basis.
And if you needed any analysis that was not on the page, you can ask me with a comment or a personal message.
Enjoy Trading ;)

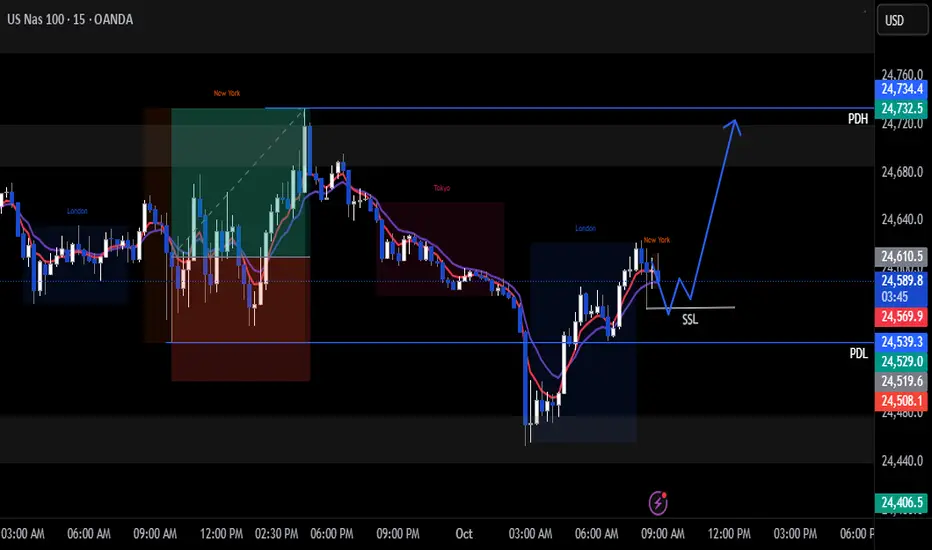
Nas100 Trade Set Up Oct 1Price swept PDL in London session and pushed up so i am bullish today once price sweeps internal SSL to target PDH
www.tradingview.com
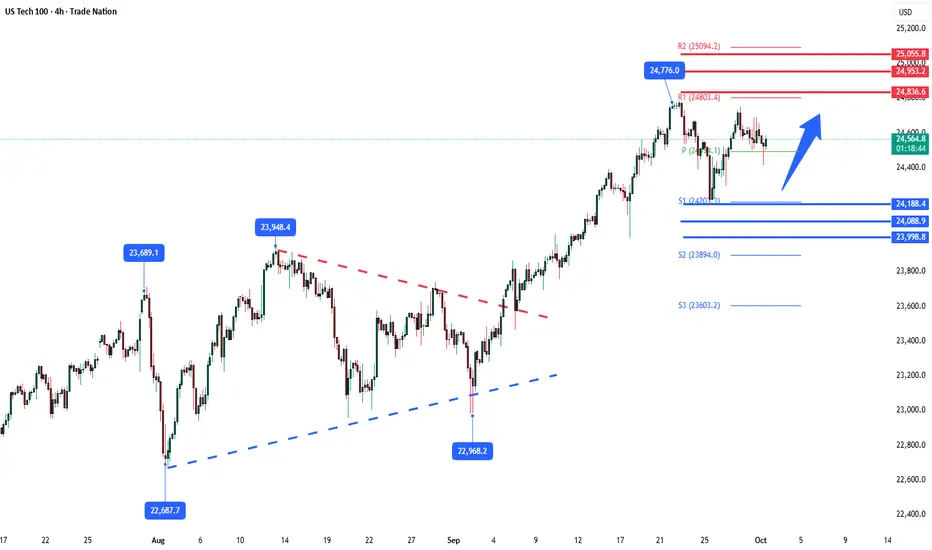
NSDQ100 Key Trading Levels Key Support and Resistance Levels
Resistance Level 1: 24835
Resistance Level 2: 24950
Resistance Level 3: 25055
Support Level 1: 24190
Support Level 2: 24090
Support Level 3: 24000
This communication is for informational purposes only and should not be viewed as any form of recommendation as to a particular course of action or as investment advice. It is not intended as an offer or solicitation for the purchase or sale of any financial instrument or as an official confirmation of any transaction. Opinions, estimates and assumptions expressed herein are made as of the date of this communication and are subject to change without notice. This communication has been prepared based upon information, including market prices, data and other information, believed to be reliable; however, Trade Nation does not warrant its completeness or accuracy. All market prices and market data contained in or attached to this communication are indicative and subject to change without notice.
Long NQ, structure breakLong NQ around 24590
Reason: structure break to the upside after liquidity grab
SLs 50-80 points or below structure blocks on m5.
TP1 24720
TP2 24770

ghost in the machineImportant Disclaimer for Foreign Currency Exchange / Trading : This material is for information only and does not constitute any offer or solicitation to buy or sell. The risk of loss in foreign exchange trading can be substantial.


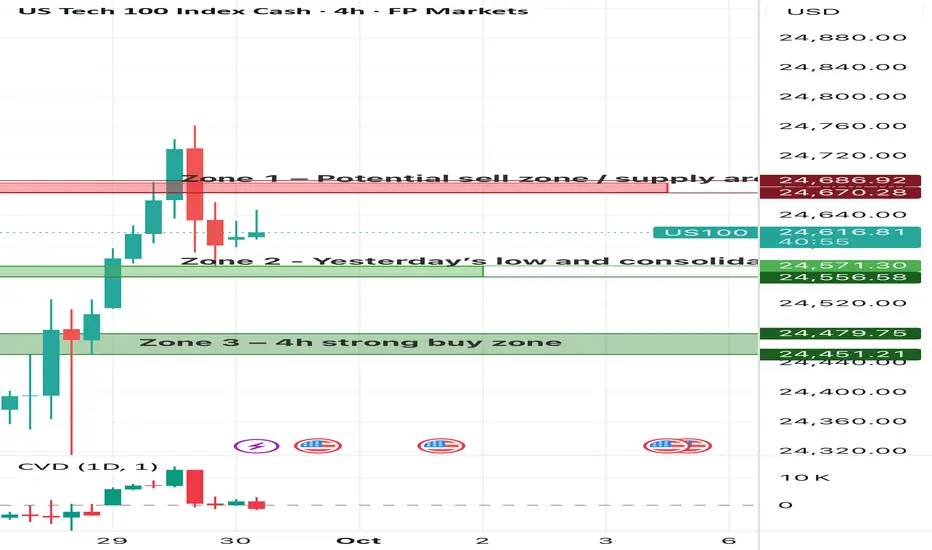
Nas100 Trading ZonesTechnical Outlook
Zone 1 - Potential sell zone / supply area
Price is now trading below this level, which means the zone has shifted into a potential supply area. If the market retests this zone, sellers may step back in to defend it. Only a clean breakout and sustained hold above would flip the bias bullish and open the way for higher targets.
Zone 2 - Yesterday’s low and consolidation
This zone is an immediate support area. Price has reacted here before, and buyers will likely defend it again in the short term. A decisive break below would shift sentiment towards a deeper pullback and open the door for a test of Zone 3.
Zone 3 - Strong buy zone
This is the most significant demand area on the chart. It has shown strong buyer absorption in previous sessions and could provide a solid base for a rebound. If price revisits this level, aggressive buyers may step in, but a clean breakdown here would flip the overall bias to bearish.
Overall, sentiment around the Nasdaq-100 is positive but cautiously optimistic. Technical indicators continue to point toward further upside, with moving averages aligned in a bullish structure and strong momentum in the tech sector driven by AI and growth expectations. At the same time, fundamentals remain supportive, as investors anticipate potential rate cuts and a stable inflation backdrop in the U.S.
However, risks are still present. A significant share of retail traders are positioned short, suggesting that not all market participants are convinced of the rally’s sustainability. This creates a tension between institutional optimism and retail caution, which could lead to heightened volatility.
In short, the Nasdaq-100 currently trades with bullish momentum and constructive fundamentals, but the market remains sensitive to macroeconomic data and external shocks that could quickly shift sentiment.
Nasdaq100 Breakout Map – Bullish Targets Ahead?🕵️♂️ NDX/US100 “NASDAQ100” Market Wealth Strategy Map (Swing/Day Trade) 🚀
📊 Plan: Bullish Bias (Swing/Day Trade)
🎯 Entry Idea (Thief Layering Style):
Using a layering strategy (multiple limit orders). My preferred buy zones are:
🟢 24,300
🟢 24,400
🟢 24,500
🟢 24,600
(Feel free to adjust/add layers based on your own style — flexibility is key.)
🔒 Protective Stop (Thief SL):
❌ Around 24,000 (but note: this is just my map, you can manage risk as per your own plan).
💰 Target Area (Profit Zone):
🚧 25,500 = strong resistance barricade + overbought region + potential bull trap.
✅ My preferred exit: 25,400 (just before the “police barricade” 🚓).
⚠️ Note for Thief OG’s:
I’m not recommending to only follow my SL/TP. This is an educational trade map, not a fixed financial call. Adapt, adjust, and take profits your way.
🔑 Key Catalysts & Correlation Map:
Tech Sector Strength: US100 often mirrors mega-cap tech momentum ( NASDAQ:AAPL , NASDAQ:MSFT , NASDAQ:NVDA ).
Risk-On/Off Mood: Watch TVC:VIX — if fear spikes, layers may fill quicker.
Dollar Impact: TVC:DXY weakness often fuels NASDAQ:NDX upside.
Bond Yields: Higher yields = pressure on tech. Keep TVC:US10Y in your radar.
📌 Other Related Charts to Watch:
SP:SPX / CME_MINI:ES1! → Correlated US equity benchmark.
TVC:DXY → Inverse correlation (watch dollar moves).
TVC:VIX → Volatility indicator for risk sentiment.
BITSTAMP:BTCUSD → Risk sentiment cousin, moves with tech flows sometimes.
✨ “If you find value in my analysis, a 👍 and 🚀 boost is much appreciated — it helps me share more setups with the community!”
⚠️ Disclaimer:
This is a Thief Style Trading Strategy Map — created for fun, educational purposes, and market observation only. Not financial advice. Trade at your own risk, ladies & gentlemen. 🕵️♂️💸
#NASDAQ100 #NDX #US100 #SPX #Stocks #Indices #Trading #SwingTrade #DayTrade #LayeringStrategy #ThiefTrader

29-09-2025 _ Short Term Bullish Idea _ NAS100 H11- Strong impulse to the upside.
2- Price above alligator with open mouth.
3- No Divergence against.
4- Therefore, one can expect a move to the upside.

Nas100 Trade Set Up Sep 29 2025Price is now bullish making HH/HL and trading above PDH so will want to see a sweep of SSl or a test of the 4h FVG to go higher towards BSL
www.tradingview.com

NAS100 - Stock Market Awaits Employment Data!The index is above the EMA200 and EMA50 on the four-hour time frame and is in its long-term ascending channel. If the upward momentum decreases, we can expect a correction to the demand range and buy Nasdaq in that range with an appropriate reward for the risk.
According to reports released over the weekend, UBS stated that there is a 93% probability of the U.S. economy entering a recession this year. This figure implicitly suggests that the country may already be in recession, though some analysts remain skeptical of such a direct conclusion. UBS’s projection is based on indicators such as personal income, consumption, industrial production, and employment.
The bank warned that the U.S. economy has reached “historically troubling levels,” though no outright collapse has yet occurred. Analysts at UBS described the economy as “weak, soft, and fragile,” while noting that a definitive declaration of recession has not been made.
In the United States, an official declaration of recession is the responsibility of the Business Cycle Dating Committee at the National Bureau of Economic Research (NBER), which typically makes such calls with a lag of 6 to 18 months after the recession has started. Their assessment relies on revised data covering GDP, employment, income, sales, and production, and they generally avoid premature decisions.
In the meantime, policymakers and markets tend to act on real-time indicators such as GDP estimates, jobs data, yield curve signals, and credit spreads. In practice, traders react more strongly to price movements than to formal definitions of recession.
Separately, Michael Feroli, chief U.S. economist at J.P. Morgan, dismissed Fed board member Steven Miran’s call for cutting rates to 2.5% or lower. The bank has maintained its forecast for gradual 25-basis-point cuts, targeting a range of 3.25% to 3.5% by early next year.
A potential Supreme Court case involving Fed board member Lisa Cook has also emerged as a “wild card,” since a ruling against her could undermine the positions of other members as well. J.P. Morgan has warned that politicization of the Federal Reserve would leave the institution more vulnerable to pressure from a Trump administration on monetary policy.
The U.S. dollar remained relatively strong this week, as investors continued to parse the Fed’s less-dovish stance. While the latest dot plot showed policymakers aligned with the market on two additional rate cuts this year, the median dot for 2026 pointed to only one more 25-basis-point reduction. By contrast, markets still expect as many as three cuts next year.
However, following Chair Jerome Powell’s cautious tone on Tuesday—emphasizing that the Fed must continue balancing the competing risks of elevated inflation and a weakening labor market—investors scaled back some of their bets.
Inflation risks remain significant. The OECD highlighted this week that the full effects of tariff hikes are still unfolding. What supports Powell’s cautious approach is that, despite signs of labor market weakness, the Fed’s own forecasts remain relatively optimistic, with economic activity showing resilience. The Atlanta Fed’s GDPNow model projects 3.3% growth for Q3.
Although last week’s inflation data failed to dampen market optimism for rate cuts—and equities continued their rally—the focus in the coming week will shift back to labor market conditions.
The week begins Monday with pending home sales data. On Tuesday, the JOLTS job openings report and the consumer confidence index will be released. Wednesday brings private-sector employment data from ADP, followed by the ISM Manufacturing PMI. On Thursday, weekly jobless claims will be published as usual.
All of these releases will build up to Friday’s critical nonfarm payrolls (NFP) report, widely seen as the market’s ultimate test.Investors will closely monitor whether recent labor market weakness persists, and whether the Fed can move another step toward a rate cut at the October meeting. Finally, the ISM Services Index will provide a more comprehensive picture of U.S. economic health.
Ahead of the jobs data, traders may also take note of remarks from several Fed officials, including Vice Chair Jefferson, New York Fed President Williams, Atlanta Fed President Bostic, Chicago Fed President Goolsbee, and Dallas Fed President Logan. The ADP and NFP releases on Wednesday will likely provide the first snapshot of September labor market performance.

NAS100 | Pullback From All-Time Highs – Two ScenariosNASDAQ pushing new all-time highs. Watching for a short-term reversal into buying zones.
Aggressive: Tighter stop, risk around recent double bottom.
Conservative: Wider stop, allowing liquidity sweep below structure.
