USXUSD trade ideas

dxy-1Ddollar index has a bearish gaurd to close it's cycle and sweep the liquidities to provide its fuel to form new HHs...

Dollar short-term BULLISH until proven otherwiseCAPITALCOM:DXY
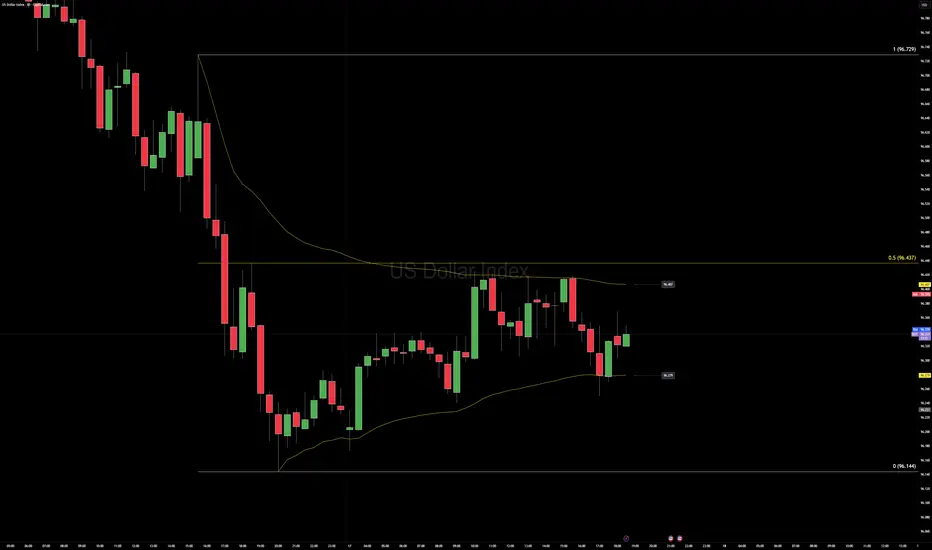
After a deep liquidity sweep down to ~95.80 followed by a sharp buying response, a string of higher lows, and a higher high into the 97.39–97.78 area. Price is currently pausing just above the shaded Daily BPR.
That sequence (sweep → big rejection → higher low → higher high) is the technical basis for a bullish bias while price stays above the recent higher-low area.
Watching development for now...

Dollar Headed Higher?Looking at the price of the dollar from a daily perspective, we can see that price accumulated for about 3 full trading weeks. Manipulation took place soon after, followed by 3 strong bullish candles.
Now that bulls have entered the market after the manipulation, I fully expect the distribution to take place after retesting the bullish FVG.
Since this is the dollar we're talking about, this price movement will most likely affect the price of other assets including Gold and dollar pairs.
Targeting the daily POI/Medium BSL.

Dollar Index (DXY) – Pre-FOMC Rangebound PlayPrice is boxed between 96.20 and 96.40 as market makers build volume on both sides ahead of the Fed.
Key Levels
• 96.40 – top of the current node, first spot for squeeze fuel.
• 96.20 – base of the range, stop pockets just beneath.
Until the statement drops, expect tight, whipsaw action—classic pre-FOMC positioning. Patience over prediction.
The dark situation of the Dollar Index never endsThis week is the most important week of 2025, and the dollar’s situation is not good at all. It’s unclear what will happen by the end of the week with all the news coming out, and there’s a high chance that all our analyses — whether on coins, gold, or currency pairs — could turn out to be fake. ✅

Bearish drop off?The US Dollar Index (DXY) has rejected off the pivot and could drop to the 1st support.
Pivot: 97.85
1st Support: 96.61
1st Resistance: 98.70
Disclaimer:
The above opinions given constitute general market commentary, and do not constitute the opinion or advice of IC Markets or any form of personal or investment advice.
Any opinions, news, research, analyses, prices, other information, or links to third-party sites contained on this website are provided on an "as-is" basis, are intended only to be informative, is not an advice nor a recommendation, nor research, or a record of our trading prices, or an offer of, or solicitation for a transaction in any financial instrument and thus should not be treated as such. The information provided does not involve any specific investment objectives, financial situation and needs of any specific person who may receive it. Please be aware, that past performance is not a reliable indicator of future performance and/or results. Past Performance or Forward-looking scenarios based upon the reasonable beliefs of the third-party provider are not a guarantee of future performance. Actual results may differ materially from those anticipated in forward-looking or past performance statements. IC Markets makes no representation or warranty and assumes no liability as to the accuracy or completeness of the information provided, nor any loss arising from any investment based on a recommendation, forecast or any information supplied by any third-party.

DXY ShortThe Butterfly Harmonic pattern signals a strong bearish trend for TVC:DXY , starting at 97.9.
Eyes on potential targets: TP1 & TP2. 📉

The Dollar Index situation in the past weekThere’s no doubt that the Dollar Index is still in a downtrend. During this decline — while moving inside a channel — it managed, thanks to the news, to break the channel’s ceiling with relatively weak momentum. The probability of a pullback to the channel’s ceiling or even a return inside the channel is high because the momentum is weak. In any case, we’ll have to see how the dollar starts the coming week. ✅

DXY (US Dollar Index) AnalysisPrice is currently trading near 97.60 – 97.90, which is a strong resistance zone.
I’ll be waiting for bearish confirmation here before expecting downside momentum.
🔻 If sellers hold this level, we could see DXY drop further, aligning with bearish pressure on USD across correlated pairs (EURUSD bullish, GBPUSD bullish, Gold bullish).
Key Levels:
🔴 Resistance: 97.60 / 97.90
🟢 Target Zone: 95.00
📌 Trading Plan:
Wait for rejection at 97.60 – 97.90 before entering.
Look for sell setups targeting 95.00.
Correlation: Bearish DXY supports bullish momentum in major USD pairs.
⚠️ Risk management is key. Always wait for confirmation before taking positions.


Dollar Weekly WrapThe dollar ripped to fresh lows early in the week on the FOMC spark and is now set to close with a heavy bearish rejection candle.
Next week’s macro stack:
Tue – U.S. PMI flash
Thu – Q2 GDP final and Durable Goods
Fri – Personal Income/Spending and PCE
Price sits just below a five-week liquidity shelf around the 98.00 area.
Technically the market is oversold near the lower range, so high probability to target next week 98ich highs and lower on cross pairs. lets see how it will play out!

DXYThe US Dollar Index remains in a downtrend. If the support zone breaks out, I expect the bearish trend to continue. Otherwise, if the price reaches the resistance zone, it could decline again.

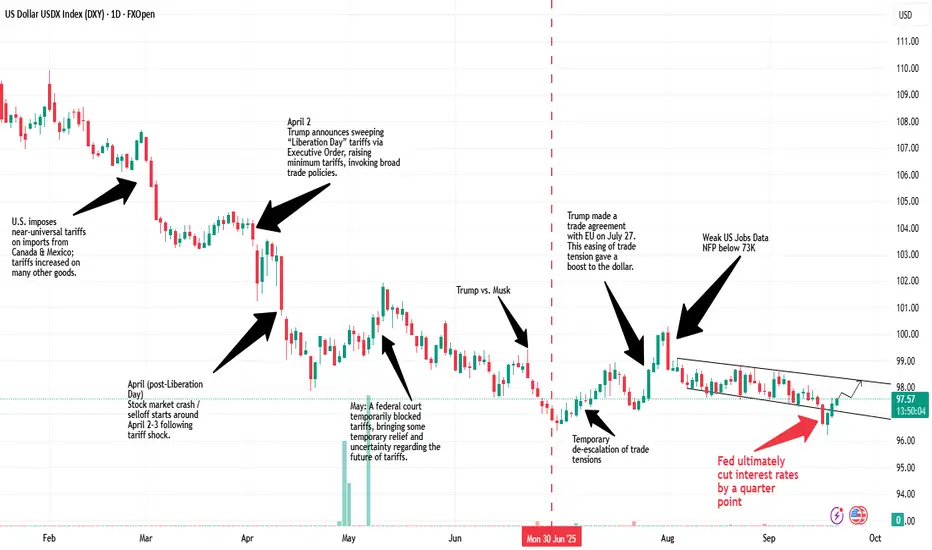
US Dollar Timeline: How Dollar is getting Destroyed Gradually The US Dollar Timeline: 2025
- The Dollar Index (DXY) has consistently weakened this year
- It fell more than 12.5% from the tops of 110 (Jan 2025) to the bottoms of 96.20, tested recently after Fed rate cuts.
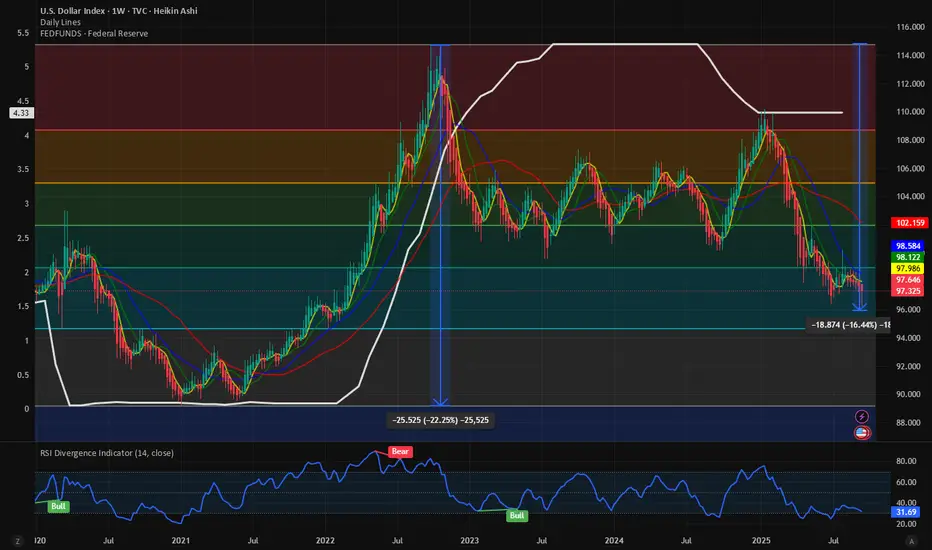
$DXY breaking down. Next level to watch 95. Year-end lows @ 90.Even if the Fed cutting cycle has just started, we are seeing major weakness in the TVC:DXY index prior to the easing cycle. It is quiet peculiar the bottom to top of the Fed hiking cycle matches exactly to the DXY index Cycle bottom in 2021 to cycle top to September 2022. With a drop in the Fed fund rate from 5.34% to 4.34%, which is close to 18%, and the DXY has also lost almost 17%. If the expectation is that there will be another 0.25% rate cut over the next few months which will takt the Fed fund rates to 4.09%, which is 23% from the recent highs of 5.34%. And surprisingly if we plot 23% lower from the ATH on the TVC:DXY Index then the index should reach 90 by the end of the year.
Verdict: With Fed rate lowering cycle ongoing the TVC:DXY index will lose more strength. 95 remains our short-term target and TVC:DXY to reach 90 by year end.

DXY at Major Support – Dollar Ready to Rebound?Today, I want to analyze the DXY index ( TVC:DXY ) for you. First, I must say that this week, US indexes can have an impact on the DXY index trend .
US indexes to be released this week:
Core PPI m/m: Tomorrow
PPI m/m: Tomorrow
Core CPI m/m: Thursday
CPI m/m: Thursday
CPI y/y: Thursday
Unemployment Claims: Thursday
Prelim UoM Consumer Sentiment: Friday
Prelim UoM Inflation Expectations: Friday
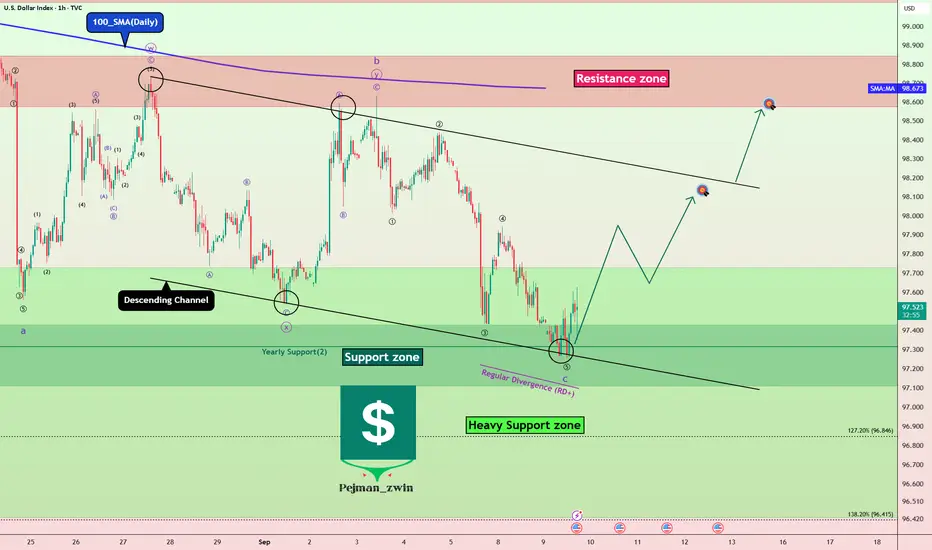
The DXY Index is currently moving near the Support zone($97.989-$97.834) , Yearly Support(2) , and the lower line of the descending channel .
In terms of Elliott Wave theory , it seems that the DXY index has managed to complete microwave 5 of the main wave C . The corrective structure is of the Zigzag Correction(ABC/5-3-5) type.
Also, we can see the Regular Divergence (RD+) between consecutive valleys .
I expect the DXY index to rise to at least $98.07(First Target) before the US indexes are announced.
Second Target: $98.56
Stop Loss(SL): $96.997
Note: With the DXY index rising, we can expect a correction in Gold( OANDA:XAUUSD ), Bitcoin( BINANCE:BTCUSDT ), and major Forex pairs (dollar strength).
Please respect each other's ideas and express them politely if you agree or disagree.
U.S. Dollar Index Analyze (DXYUSD), 1-hour time frame.
Be sure to follow the updated ideas.
Do not forget to put a Stop loss for your positions (For every position you want to open).
Please follow your strategy and updates; this is just my Idea, and I will gladly see your ideas in this post.
Please do not forget the ✅' like '✅ button 🙏😊 & Share it with your friends; thanks, and Trade safe.
DXYDXY seems like a correction will be coming before any push up.
Disclosure: We are part of Trade Nation's Influencer program and receive a monthly fee for using their TradingView charts in our analysis.

DXYDXY maintains a bearish bias, trading below last week’s open and confirming weakness with a series of lower highs and lower lows. Commitment of Traders (COT) data shows non-commercial traders reducing long positions and adding to shorts, reinforcing the downside outlook. As long as price holds beneath the current week open, bearish momentum is expected to persist, with any rallies into resistance or supply zones offering opportunities to align with the prevailing trend.

US Dollar Index (DXY) – Institutional Structural OutlookMacro Context
The Dollar Index is currently holding within a weekly demand zone after a prolonged distributive phase. The market is evaluating whether this region will act as a structural accumulation base or if deeper liquidity levels will be tested. Confirmation from COT reports will be crucial to validate institutional positioning.
Technical Structure
Breakout & Acceptance: The last major breakout is still respected, with price now consolidating above demand.
Demand Layers: Three clear demand zones are mapped:
Current Demand – where the market is attempting to accumulate.
Deep Discount Demand – a deeper structural level where liquidity could be absorbed if the first zone fails.
Extreme Deep Discount Demand – ultimate defensive layer, aligned with long-term rebalancing.
Accumulation: Price is building a smaller accumulation range, signaling potential preparation for an institutional move.
Projected Scenarios
Primary Bias (Accumulation/Long): If confirmed by COT, current accumulation may trigger a structural recovery of the Dollar, strengthening against weaker counterparts (AUD, NZD).
Invalidation: A clean break below the current demand would open the path towards deeper demand zones, reframing the context as continuation of distribution.
Confirmation & Monitoring
COT Reports: Weekly positioning will confirm whether institutional players are indeed accumulating or still unwinding Dollar exposure.
Volatility Index (VIX + EVZ): As timing filters for breakout confirmation.
Macro Drivers: Next Fed communications and global liquidity flows remain critical catalysts.
⚖️ Institutional Note: The DXY is at a decision point – smaller accumulation is visible, but validation from institutional flows (COT) is essential before considering a structural recovery.

Weekly Review: Dollar Weakness, Equities Rally, Crypto at resis'Abstract
This week’s market action painted a consistent story: the dollar fell hard, global yields softened, and equities rallied toward resistance.
Meanwhile, commodities (oil, gold, copper) strengthened, supporting a reflationary tone. The main caution flag: volatility gauges (VIX & VVIX) are rising, hinting that this risk‑on rally might not be bullet‑proof.
In crypto, BTC and ETH tested overhead resistance with weak volume — optimism is there, but conviction is not.
🚨 Special Focus: September 17th Fed Cut
The Federal Reserve’s September 17th policy decision is the most important catalyst this week. A rate cut at 2 PM EST has direct and immediate implications for all the moves outlined below:
Dollar Impact: Cuts weaken the dollar further, amplifying this week’s oversold DXY.
Yields: A cut locks in the recent fall in bond yields, making equities and gold more attractive.
Equities: Would justify current rallies but also risks looking like “policy panic”, which can spur volatility.
Commodities: Oil and Gold respond positively to looser policy → reflation + hedging.
Crypto: Historically benefits from Fed easing, but watch if BTC can actually break resistance when liquidity improves.
Interpretation: September 17th could either validate the risk‑on rally, or reverse it sharply if markets fear the Fed is cutting because economic weakness is worse than expected. Traders should mark 2 PM EST as a volatility event across Dollar, Yields, Equities, Commodities, and Crypto.
👉 Chart reference: US10Y
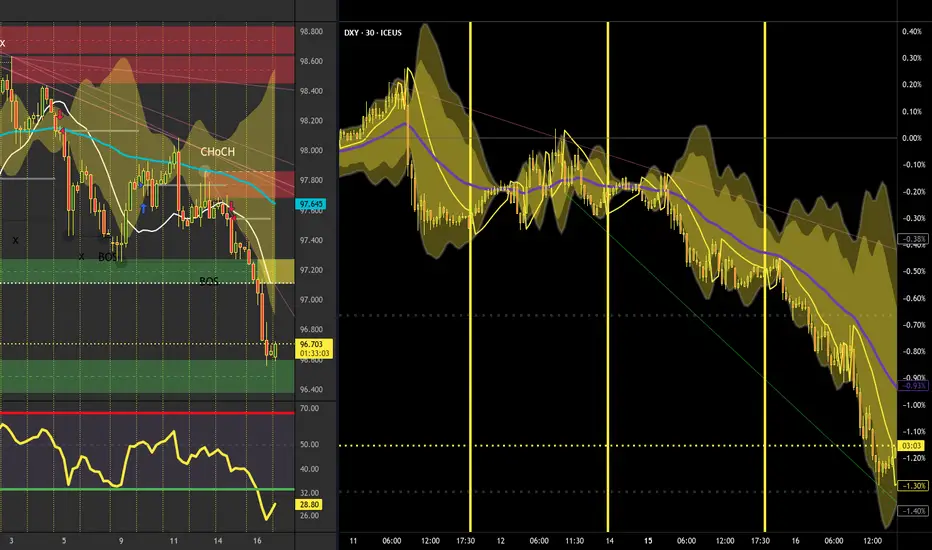
1. Dollar & FX: Oversold Break
DXY dropped to ~96.6, oversold on RSI (26) after repeated breaks of structure.
EURUSD surged past 1.18, entering overbought momentum.
USDJPY and USDCAD both slipped lower, aligning with dollar weakness.
USDINR weakened to 88.0 → 87.85 POI, showing INR strength matched with NIFTY breakout.
Interpretation: The dollar is oversold and losing momentum — normally bullish for risk assets. But extreme RSI means a technical bounce is possible.
👉 Chart here: DXY / EURUSD
2. Yields: Relief for Equities
US10Y at 4.03%, US30Y at 4.65% — both off highs, easing pressure on stocks.
CA10Y fell to 3.16%, tailwind for CAD and TSX.
IN10Y steady ~6.49%, supportive backdrop for India.
Interpretation: Lower yields = fresh air for equities. Bonds validating a mild risk‑on bias.
👉 Chart here: US10Y / Global Yields
3. U.S. Equities: Bulls in Control
S&P 500 at 6607, up ~2.9% this week, testing resistance.
Nasdaq 100 jumped 3.5%, now overbought on RSI.
Dow Jones up 1.7%, steady breadth support.
Interpretation: U.S. indices are riding the yield drop, but now pressing major resistance zones. Easy money for bulls is fading — the next leg requires stronger conviction.
👉 Chart here: SPX (NDX and DJI showing similar characteristic on their respective charts)
4. Global Equities: India & Canada Stand Out
NIFTY broke to 25,239, clean resistance breakout, INR strength aligned.
TSX surged 3.7% with oil, CAD, and yields falling in sync.
EuroStoxx (SX5E) consolidated flat — showing Europe still lagging.
Interpretation: The best relative strength came from India and Canada. Europe lagged, lacking energy leverage.
👉 Chart here: NIFTY / TSX
5. Commodities: Reflation Pulse
Oil climbed to $64.6, breaking resistance.
Gold at $3695 (+2.6%), safe‑haven demand still alive.
Copper to $4.70, break higher supportive for growth assets.
Interpretation: Energy and metals are supporting the equity rally. Gold rising alongside = investors hedging tail risk too.
👉 Chart here: Oil / Gold
6. Volatility: Under the Hood
VIX back up to 16.4, rising after being crushed.
VVIX surged to 104, volatility of vol is warning of unstable positioning.
IndiaVIX collapsed below 11, reflecting too much complacency locally.
Interpretation: While equities scream “bull!”, vol warns risk management is key. This is not free money.
👉 Chart here: VIX
7. Crypto: Resistance Check
BTC at 116.6k and ETH at 4.5k: both testing resistance with weak volumes.
BNB surged +5.7%, outperformed majors.
SOL held above 228–236, neutral bias.
XRP stuck near 3.0, chopping sideways.
Interpretation: Trend is up in sympathy with equities, but risk of rejection at resistance is very real. Without stronger volumes, crypto remains a “show me” trade.
👉 Chart here: BTC
💡 Big Picture Takeaway
Dollar tanking = equity and commodity rally fuel.
Yields easing = confirms risk‑on conditions.
Equities at resistance with rising vol = bulls in control, but fragility building.
Crypto is lagging in volume — it benefits from macro tailwind but not leading.
Best relative strength: NIFTY, TSX, Oil, Gold.
Fed rate cut on Sep 17 = the true decision point for trend continuation or reversal.
🎯 Conclusion — Risk‑On, But Fed Holds the Key
Markets rewarded risk this week as the dollar collapsed and yields faded. But overbought equities, crypto resistances, and rising volatility gauges warn that the move is not bullet‑proof.
The September 17th Fed cut at 2 PM is the ultimate test. If the cut is seen as proactive stimulus, the rally has room to extend. If it’s read as a panic signal, what looks like risk‑on could swiftly unwind.
✅ Bias for the coming week: constructive risk‑on until the Fed cut, then stand ready for sharp volatility.
📌 For traders: Buy dips in leaders (NIFTY, TSX, commodities) before the Fed — reduce leverage into decision. For investors: Stay allocated with hedges in vol and gold.
ICEUS:DXY FX_IDC:USDINR CMCMARKETS:USDCAD CMCMARKETS:EURUSD TVC:US10Y CBOE:SPX NASDAQ:NDX DJ:DJI NSE:NIFTY TSX:TSX TVC:SX5E NYMEX:CL1! OANDA:XAUUSD TVC:VIX CRYPTO:BTCUSD
possibility of uptrend The corrective pattern is expected to end and we will see the start of an uptrend. A break of the resistance trend line will be a confirmation of the uptrend.
If the index breaks through the support area, a downtrend scenario will be likely.

