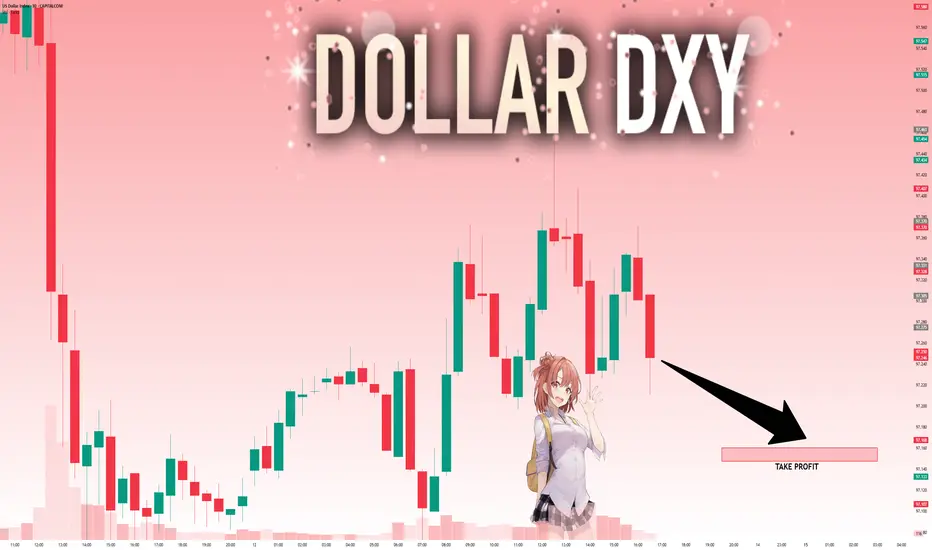
DXY - Updated trade (10sept)Still the very same outlook like the previous DXY trade only difference is that we re-entered at the very same price and extended SL below the LQC(candle that swept liquidity) and took our TP abit higher
USXUSD trade ideas

USD Index Technical Outlook – Key Buy & Sell LevelsThe U.S. Dollar Index (DXY) is currently trading inside a clear downward channel, showing a bearish market structure. Price is hovering near 98.23, just below the key resistance zone between 98.5 – 99.2, where Fibonacci retracement levels (0.382, 0.5, and 0.618) also align, making it a strong supply area. As long as price remains below this zone, the bias stays bearish, with potential downside targets at 97.5 and then 96.5, in line with the channel support and Fibonacci extensions. However, if buyers manage to push above 99.2, it would signal a possible trend reversal and shift the outlook towards bullish continuation. Overall, the structure suggests that the U.S. Dollar Index is more likely to face rejection near resistance and continue lower in the short term.
🔴 Sell Zone (Short Setup)
- 98.50 – 99.20 is a strong resistance area where price aligns with the Fibonacci retracement (0.382 – 0.618) and the upper channel trendline.
- Sell Trigger: If price shows rejection (bearish candles, wicks, or reversal patterns) within this zone.
🟢 Buy Zone (Long Setup)
- 97.50 – 96.50 area is the channel support and also near Fibonacci extension levels.
- Buy Trigger: Look for bullish confirmation (bounce, bullish engulfing, or rejection wicks).
Note
Please risk management in trading is a Key so use your money accordingly. If you like the idea then please like and boost. Thank you and Good Luck!

WILL THE BEARS CONTINUE TO BREAK THE BULLS' BACKS ???DXY ANALYSIS (Daily Timeframe).
On the 1st of July 2025 price began printing a sideways correction, wherein minute wave (a) terminated on the 1st of August 2025. Price is currently printing a minute wave (b) before a minute wave (c) to complete minor wave 4. Minute wave (c) may not take out the 100.257 levels due to the strength of the Bears.
Looking at higher times, weekly and monthly. We see that price created a long term bullish support. We have seen the first several touches of the support line between the 28th of April 2011 and the 29th of August 2011, a total of 10 touches. We have also seen the second touches on the trendline between the 6th of January 2021 and 7nth of May 2021, about 12 touches. We are currently witnessing the third touches on the trendline. Price has already touched once the trendline on the 30th of June 2025. We are still expecting more touches and a breakthrough into the trendline. Should bulls remain weak, we will see price retest and breakaway from the trendline.
#SabaliCapital
#TechnicalAnnalysis
#DXY

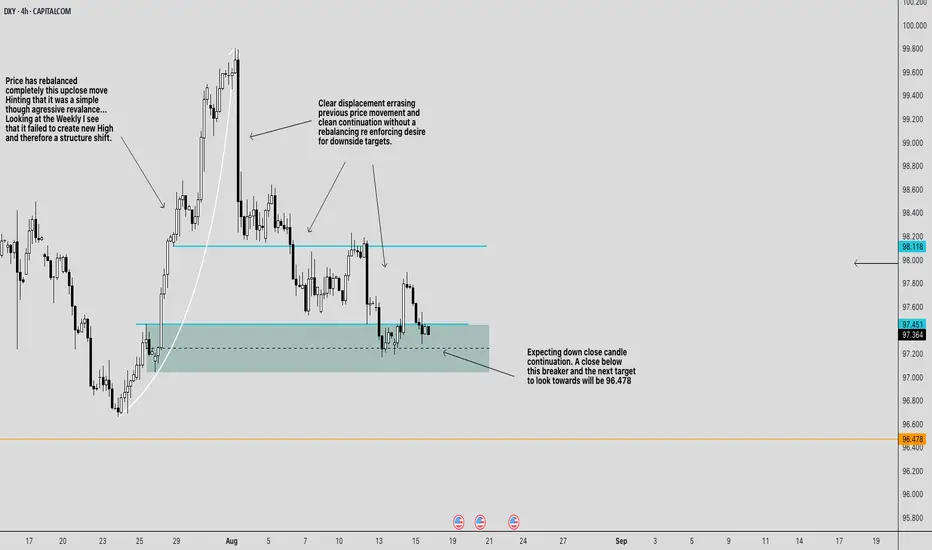
BEARISH CONTINUATION FOR DXYBearish Bias for CAPITALCOM:DXY
Weekly context:
The last up-move failed to print a new weekly high. Failing to create a shift in structure , so rallies are suspect.
4H structure:
We had a hard bearish displacement (large down candles) that erased prior price action and kept going without delivering a “full” rebalance. That usually means the price target remains lower .
The key zones on chart
Breaker / sell zone: \~ 97.45–97.75 (teal box). This is the prior bullish OB that failed (now acting as resistance).
Line in the sand: \~ 97.35–97.40 (dashed line through the teal). A decisive 4H close below here signals continuation.
Upside cap / invalidation area: 98.12 (cyan line) up to \~ 98.20 . Above this, the bearish sentiment weakens.
Primary downside draw: 96.478 (orange line). That’s the next obvious liquidity/inefficiency magnet on your chart.
Trade plan
Idea A — Rejection short from the breaker (preferred):
Entry: look for a rejection setup inside 97.45–97.75 (e.g., 15m/1h bearish shift after a sweep).
Stop: above the breaker and the cyan line ⇒ 98.12 (conservative) or 98.20 (safer).
Targets:
T1: 96.84 (take partials; pay yourself)
T2: 96.47.00
Idea B — Continuation after the break (confirmation play):
Trigger: a 4H close below \~97.35 .
Entry: sell the first clean pullback into 97.35–97.45 .
Stop: above 97.85–98.00 (back inside the breaker); conservative stop 98.12 .
Target: 96.478
Management & invalidation
If price rebalances deeper and closes 4H above 98.12–98.20 , the breaker is failing. Flatten shorts; reassess (potential squeeze toward 98.60–99.00 is then on deck).
If price hesitates at 97.00 , trail above the last 1H swing high to protect realized PnL while aiming for 96.478 .
News risk: Your chart flags upcoming US data (icons). Expect wicks; use hard stops and consider sizing down around releases.
Why this makes sense
* The strong displacement leg sets the draw lower.
* The teal box is a bearish breaker created by a failed bullish structure—ideal for “sell on rally.”
* The market rebalanced the prior up-close leg already; the lack of a symmetrical rebalance on the down-leg favors continuation to the next target ( 96.478 ).
One-liner: Bearish while 4H stays under 98.12 ; sell rallies into 97.45–97.75 or sell a 4H close-and-pullback below 97.35 ; scale out 97.20 → 97.00 → 96.80 → 96.478 ; hard stop above 98.12–98.20 .
*Not financial advice. Size appropriately and stick to your stop.*
PLEASE PUA!
US Dollar: Upside Price Target vs. GoldSince the historic print low of 70.69 in 2008, the US dollar has risen more than 55% to its current levels north of 110. There is no telling just how high the dollar can run amid the parabolic move upward from its 2021 low. An inverse head and shoulder pattern suggests a minimum upside price target of 117.64 or around 7% north of current levels. Fibonacci time cycles portend potential turning points this October and in November 2023. Despite all the headline inflation, the rise in the dollar is, by definition, deflationary. This suggests that given inflation remains steadily on the rise, the dollar needs to go significantly higher for its deflationary effects to manifest in the real economy. One item of particular note is the dollar-based price of gold today vs. at the dollar lows in 2008. At the all-time lows of 2008, Gold was trading in the $800-$1000 range. Contrast that to today, with a dollar that is 55% higher, and we see Gold trading at $1700. That says a lot about Gold's ability to hold its value amid a rising dollar, which is typically bearish for Gold.

DXY 4HTrading Outlooks for the Week Ahead
In this series of analyses, we review short-term trading outlooks and perspectives.
As can be seen, in each analysis there is a key support/resistance zone close to the current price of the asset. The market’s reaction to or breakout from these levels will determine the next price movement toward the specified targets.
Important Note: The purpose of these trading outlooks is to highlight critical price levels ahead and the market’s potential reactions to them. The analyses provided are by no means trading signals!

12.09.25 Morning ForecastPairs on Watch -
FX:EURUSD
FX:USDCAD
FX:NZDUSD
A short overview of the instruments I am looking at for today, multi-timeframe analysis down to what I will be looking at for an entry. Enjoy!

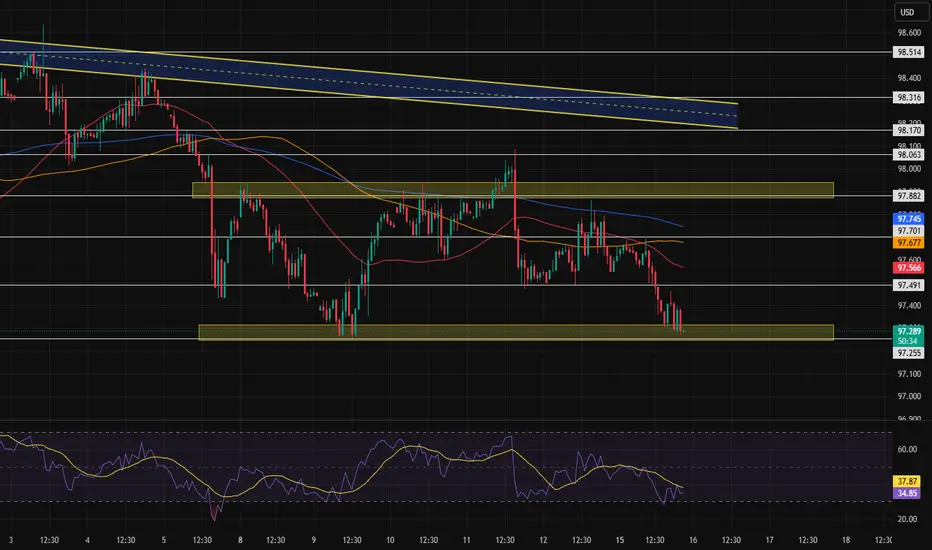
LIQUIDITY SWEEP ON DXY BEFORE FALLINGIn this weekend dollar index analysis presentation, my thesis is sideways liquidity sweep before a daily bear flag breakout to the downside. Momentum and RSI on the higher timeframe are still to downside suggesting more selling. Price is still trapped below all our moving averages confirming our trend bias. On the weekly time frame we have a couple of inverted candles at a fib 0.618 support zone suggesting a likely reversal from a higher low but I think these inverted candles are liquidity sweeps from the 0.382 fib retrace resistance level. The daily chart has a strong shooting star which initiated selling pressure to the current trendline support level at 97.432 where our last daily candle was a doji indecision or pause.
In the coming first trading week of September, I will be watching for clear break of the trendline on the daily chart and a confirmed breakout of the fib 0.618 support zone at 97.187 for an initial target of 96.702 and final target of 96.155.
Thank you and have a great profitable trading new month. Cheers!!

DXY Bearish The DXY is expected to remain bearish until it reaches the 94.00–92.00 levels, with the possibility of dropping even further below those levels

Dollar Index (DXY) – Watching Both Sides LiquidityOn the daily timeframe, we can clearly identify liquidity resting on both sides of the chart:
Relative equal lows acting as sell-side liquidity.
Low-resistance highs representing buy-side liquidity.
From my perspective, the main draw on liquidity remains the sell-side lows. However, before targeting that area, price may first reach higher to grab the buy-side liquidity. Once this liquidity is collected, I expect a potential shift in momentum and a move to the downside.
💌It is my honor to share your comments with me💌
🔎 DYOR
💡Wait for the update!

WILL THE BEARS CONTINUE TO BREAK THE BULLS' BACKS ???DXY ANALYSIS (Weekly Timeframe) (Chart 2)
Looking at higher times, weekly and monthly. We see that price created a long-term bullish support. We have seen the first several touches of the support line between the 28th of April 2011 and the 29th of August 2011, a total of 10 touches. We have also seen the second touches on the trendline between the 6th of January 2021 and 7nth of May 2021, about 12 touches. We are currently witnessing the third touches on the trendline. Price has already touched once the trendline on the 30th of June 2025. We are still expecting more touches and a breakthrough into the trendline. Should bulls remain weak, we will see price retest and breakaway from the trendline.
#SabaliCapital
#TechnicalAnnalysis
#DXY

DXY: Next Move Is Up! Long!
My dear friends,
Today we will analyse DXY together☺️
The recent price action suggests a shift in mid-term momentum. A break above the current local range around 96.860 will confirm the new direction upwards with the target being the next key level of 96.957 and a reconvened placement of a stop-loss beyond the range.
❤️Sending you lots of Love and Hugs❤️

Bearish drop formation?The US Dollar Index (DXY) is rising towards the pivot and could reverse to the 1st support.
Pivot: 98.63
1st Support: 97.12
1st Resistance: 100.21
Disclaimer:
The above opinions given constitute general market commentary, and do not constitute the opinion or advice of IC Markets or any form of personal or investment advice.
Any opinions, news, research, analyses, prices, other information, or links to third-party sites contained on this website are provided on an "as-is" basis, are intended only to be informative, is not an advice nor a recommendation, nor research, or a record of our trading prices, or an offer of, or solicitation for a transaction in any financial instrument and thus should not be treated as such. The information provided does not involve any specific investment objectives, financial situation and needs of any specific person who may receive it. Please be aware, that past performance is not a reliable indicator of future performance and/or results. Past Performance or Forward-looking scenarios based upon the reasonable beliefs of the third-party provider are not a guarantee of future performance. Actual results may differ materially from those anticipated in forward-looking or past performance statements. IC Markets makes no representation or warranty and assumes no liability as to the accuracy or completeness of the information provided, nor any loss arising from any investment based on a recommendation, forecast or any information supplied by any third-party.

DXY week 14/09/2025Even last week we close near to the NWOG, I still see a dxy under the 97 I don’t want to see dxy over the 97,800 I expect a reaction to the down side taking PDL and a retest to continue lower.

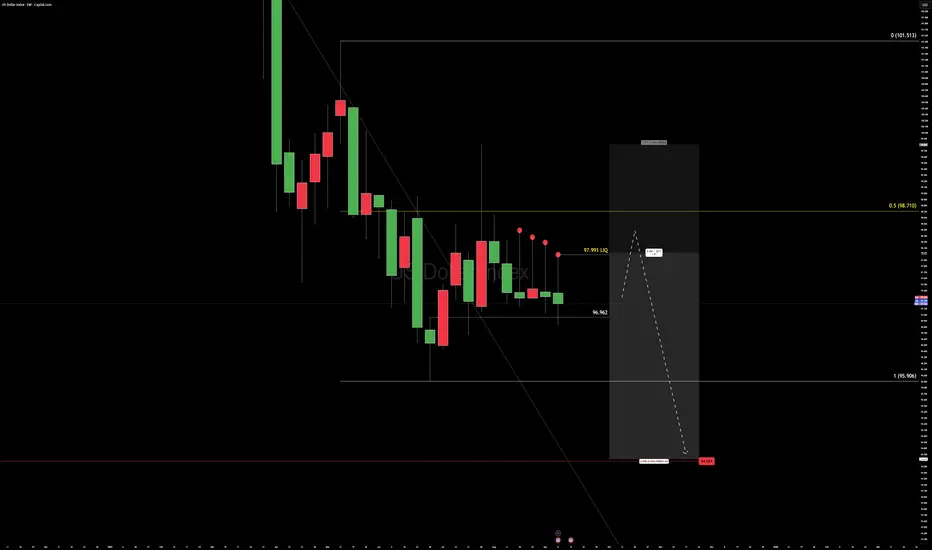
Pre-FOMC Crossfire US DOLLAR INDEXPre-FOMC Dollar War Map
The weekly chart just printed a fourth straight lower high—
a slow grind down while Friday’s close stayed red.
Liquidity is stacked behind us, perfect fuel if the desks want to run stops before the Fed.
Order flow shows massive resting bids around 96.962, the last structural block.
If that line cracks, expect the move to be fast and brutal.
Cross-markets are whispering the opposite:
equities, metals, and crypto are coiled to run if the dollar slips.
The headlines will call it a surprise.
It isn’t. The map was drawn weeks ago.
Focus on levels, not noise.
Trade the reaction, not the prediction.
DXY - My Detailed Bull Thesis Going ForwardDear Friends in Trading,
How I see it on a 12HR Time Frame.
(To follow my findings so should you)
RSI:
4HR = above 50% - 14sma supported
12HR = just below but right at 50% - 14sma supported
SUPPORT:
The purple line represents a multi layered support area created by HUGE demand.
It is the THRESHOLD of institutions and surely the US Government.
I have indicated the multiple "demand" rejections - UP in recent history.
BACK TEST: (Please see for yourself how price reacted from this support)
1st of MARCH 2022 - 31st of March 2022
Yes, that is the previous time price was where it's at now.
1) 1st of March just below support line, there is a FVG formed.
2) I have drawn this FVG all the way to today - LIGHT BLUE
3) Then look how what price reacted above the purple line once it breached the confluence.
MY SUMMARY:
For 3 and a half years that FVG have been accumulating demand to hold the INDEX UPWARD.
Price can definitely dip into BLUE FVG to muster a "REVERSAL SHOT/BOUNCE" out of the hole.
Price can also just do a "BOUNCE" reversal from the current support and rally to compensate for the pending rate cut later this month.
I sincerely hope my point of view offers a valued insight.
Thank you for taking the time study my analysis.


USD, DXY Monthly - X Marks the SpotThe US Dollar is near the mid-point of the 20-year range but for the past few months, the currency has been tangling with long-term trendlines that haven't yet shown a willingness of giving way.
The upper trendline originates in 2001 and connects to the 2020 high. This caught the low in 2023 and then again in April. Shorter-term, the weekly chart of DXY has been taking a seat on this trendline with sellers unable to yet leave it behind.
The support trendline originates in 2011 and connects to the 2021 low. This caught the low around the Q3 open and hasn't been back in play since. But - as we move towards the FOMC rate decision next week this is a big level to watch.
With the Fed widely expected to cut rates, the bigger question and likely bigger driver from next week's meeting will likely come from the bank's dot plot matrix, and if the Fed does lean towards the 125-150 bps of rate cuts that are expected into the end of next year, USD bears could finally get a shot-in-the-arm. Perhaps a bigger question behind that is whether EUR/USD can finally take on strength after the pair has stalled for the past two and a half months. - js

First day of the week and Dollar dropWith the market opening, the Dollar Index continued its decline and reached a key support level. However, I think it could bounce from this area and move up toward the middle of the range. We’ll have to see how long this level can hold the price, since the Dollar Index has been bearish for quite some time. ✅
DXY FRGNT WEEKLY CHART ANALYSIS - DXY Q3 W38 Y25🌍FRGNT WEEKLY CHART ANALYSIS - DXY Q3 W38 Y25
📊 DXY FRGNT Breakdown + Impact on GBP, EUR, and Cross Pairs
1. Higher Timeframe Context (Weekly)
Trend: Bearish → clear lower highs & lower lows since mid-summer.
Unmitigated Imbalance (IMB): 99–101 zone above current price → acts as a long-term liquidity magnet but not yet tested.
Bias: Weakness dominates until price proves otherwise.
2. Daily Timeframe
Supply Zone: 98.200–98.500 (aligns with Daily 50 EMA).
Demand Zone: 96.800–97.000 (next liquidity draw).
Expectation: Retrace into 98.2 supply, then continuation lower toward 97.0 demand.
3. Intraday (4H)
Supply Overlap: 97.800–98.200 (Daily + 4H confluence).
Structure: Still bearish, repeated rejections from the 50 EMA.
Projection: Price likely taps 98.0 area, then drives into 97.0 demand.
Summary
Bias: Bearish.
Watch for liquidity sweep above 98.0 → rejection → sell setups toward 97.0 demand.
🌍 Impact on GBP, EUR, and Cross Pairs
GBPUSD
Effect: Dollar weakness supports bullish setups.
Expect retrace into 1.2670–1.2720 demand before price extends higher.
Targets: 1.2800–1.2850, with potential stretch toward 1.2950.
Narrative: As long as DXY stays capped under 98.2, GBPUSD should continue higher.
EURUSD
Effect: Also benefits from USD weakness, though less aggressively than GBP.
Look for longs around 1.0850–1.0880 demand.
Targets: 1.0950–1.1000.
Narrative: Similar structure to GBPUSD, but GBP is likely to outperform EUR.
EURGBP
Effect: GBP stronger than EUR → bearish bias.
Shorts valid below 0.8520, aiming for liquidity under 0.8430–0.8450.
Narrative: Even if both EUR and GBP rise against USD, GBP is leading.
Other USD Cross Pairs
USDJPY: Likely to weaken, targeting 144.50–145.00 liquidity.
USDCAD: Bearish pressure, could reach 1.3600 demand.
USDCHF: Lower toward 0.8850–0.8900 demand.
✅ Overall Picture
DXY Bearish = Favor longs on GBPUSD & EURUSD.
GBP stronger than EUR = EURGBP shorts are attractive.
JPY & CHF weak = Pairs like GBPJPY and EURJPY can push higher.
👉 In short: DXY’s weakness is the engine, driving GBPUSD and EURUSD higher. The Pound has the edge, making EURGBP a sell candidate while GBPJPY becomes a standout buy.
TVC:DXY
FRGNT

DXY near or already end of downtrendDXY near or already end of downtrend
Technical perspective
DXY continues to hold above its 14-year ascending trendline, reinforcing the grand cycle uptrend.
Price is consolidating above this support after a bullish divergence, with RSI suggesting reversal potential.
However, in the short term, it may continue to move sideways, as indicated by parallel EMAs.
A decisive close below the long-term support near 96.00 would shift sentiment sharply bearish.
Macro perspective
In the short term, USD is stabilizing as traders await August CPI data and the Fed’s policy decision, key drivers for DXY’s next move.
Market sentiment could turn more bullish once the Fed’s rate cut is realized, as dovish expectations are fully priced in which could trigger a reversal.
US Treasury yields have been declining, reflecting recovered demand for dollar-denominated assets.
Meanwhile, heightened geopolitical tensions across multiple regions are reinforcing the USD’s role as the world’s most liquid safe-haven currency.
Analysis by: Krisada Yoonaisil, Financial Markets Strategist at Exness

INDEX_DXY_1DDollar Index Analysis The Dollar Index has completed five downwaves on the Daily timeframe according to Elliott waves and it is possible that we are at the end of the downwave and can enter a new phase of the upwave and move towards the number 105.50. At the resistance of this reaction on the Dollar Index, it can react on the currency pairs. The market is in a big turn

DXY: Target Is Down! Short!
My dear friends,
Today we will analyse DXY together☺️
The recent price action suggests a shift in mid-term momentum. A break below the current local range around 97.216 will confirm the new direction downwards with the target being the next key level of 97.160 and a reconvened placement of a stop-loss beyond the range.
❤️Sending you lots of Love and Hugs❤️