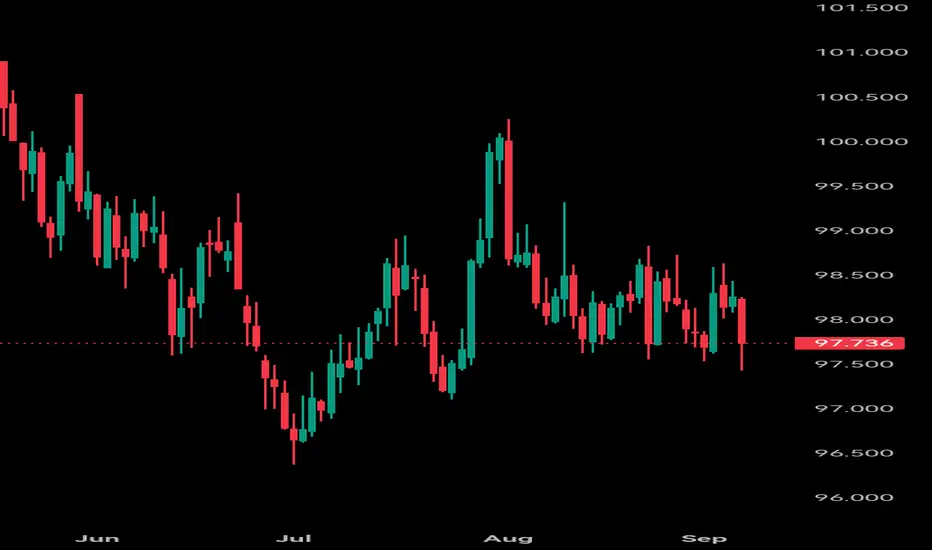
DXY week 7/9/2025We have a lot of SSL on the DXY, we have EQL at the PDL.
So I would like to see a retracement to premium levels to see a sell I have to numbers on my head 98,256 and 98,00
We will see if it’s plays out.
USXUSD trade ideas

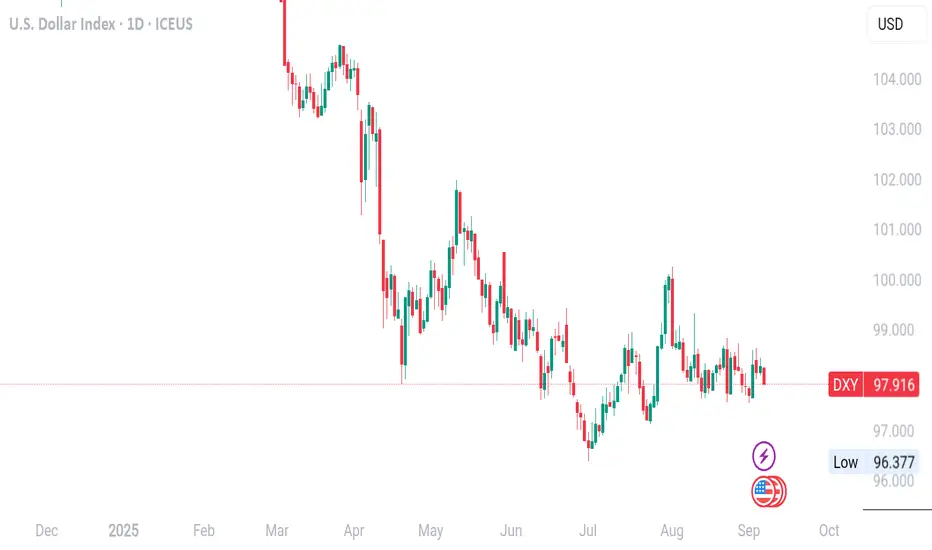
MY POSSIBLE 3 OPTIONS FOR THE DXY NEXT WEEKTrading week 08 - 12 SEPTEMBER 2025
On Friday last week poor USD NFP readings caused a strong selloff of the Index however this didn’t leave the consolidating channel and we saw a re-bounce from 97.500 area of support.
This week a selloff in the 98.054 area could see the index testing the lower lows 96.700 and 96.470; if 98.054 is broken the next levels I will monitor are 98.300 and 98.743 as possible selloff entries. If the price breaks these levels and reaches 99.200 we could see more uptrend the DXY rallying to the 99.900 level of resistance.

Dollar Index (DXY)Its likely that the DXY could continue a downward trend, targeting the next major support zone around 92.00 / 90.00

Okay, here is a brief analysis of the US Dollar Index (DXY). **Okay, here is a brief analysis of the US Dollar Index (DXY).
**Fundamental Analysis:**
The US Dollar Index (DXY) is a composite measure of the dollar's value against a basket of major currencies. Its trajectory is primarily driven by the Federal Reserve's monetary policy stance and the relative strength of the US economy. The dollar typically strengthens when the Fed adopts a hawkish stance (hiking rates or signaling hikes), US economic data outperforms (e.g., NFP, GDP, CPI exceeding expectations), or global risk-off sentiment sparks safe-haven demand. Conversely, it often weakens on expectations of Fed rate cuts, weak US data, or improved global risk appetite.
**Technical Analysis:**
From a technical perspective, after a prolonged rally fueled by an aggressive hiking cycle, the DXY has recently been consolidating at high levels. The 105-106 zone is a crucial pivot point. A decisive break and hold above 107 could signal a resumption of the uptrend. However, a sustained break below key support near 104 might indicate exhausted bullish momentum and risk a deeper correction. Traders should watch its correlation with US Treasury yields closely.
**Summary and Outlook:**
In the short term, the DXY's movement will remain highly volatile, closely tied to Fed policy expectations and economic data releases. Its longer-term direction depends on the growth and interest rate differential outlook between the US and other major economies (particularly the Eurozone). The market is still pricing in the Fed's rate cut path, keeping the dollar's near-term direction uncertain.
***
*Disclaimer: The above content is market analysis and does not constitute investment advice. Markets are risky; invest with caution.*

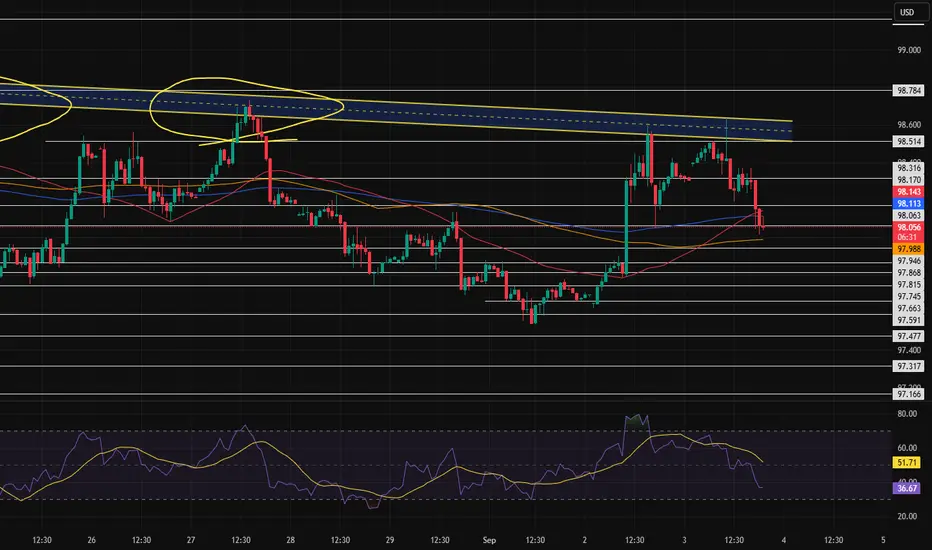
DXY4H Trading Outlook for the Upcoming Week
In this series of analyses, we review trading perspectives and short-term outlooks.
As can be seen, in each analysis there is a key support/resistance zone near the current price of the asset. The market’s reaction to—or breakout from—this zone will determine the next price movement toward the specified levels.
Important Note: The purpose of these trading outlooks is to highlight key levels ahead of the price and the market’s potential reactions to them. The analyses provided are by no means trading signals!

DXY Update📉 Outlook:
USD remains under pressure as weak August NFP (22K jobs vs. 75K expected) reinforces bets on a Fed rate cut in mid-September.
📊 Key Levels:
Support: 97.90 → 97.50 → 97.00
Resistance: 98.35 → 98.80 → 99.20
🎯 Scenarios:
Bearish: Break below 97.90 → 97.50–97.00
Bullish: Recovery above 98.35 → 98.80–99.20
⏱ Next Catalyst: US CPI (Sept 11) – a hotter print could trigger a USD rebound; soft data may extend the decline.
Summary: DXY in medium-term downtrend. Short-term price trapped near critical support. Watch CPI for the next directional move.

EDUCATION -HOW TO TRADE NFP
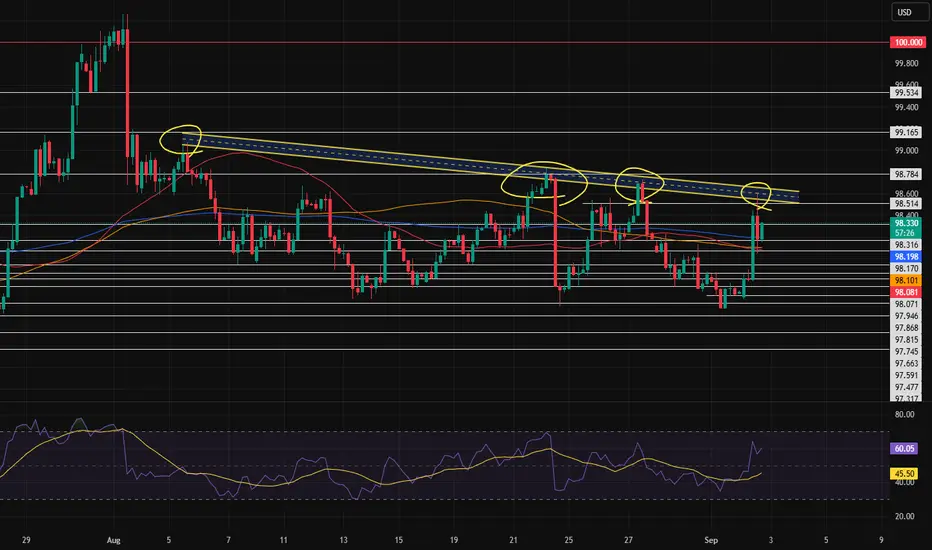
🔎 Current Chart Context (Sept 1–4)
Price rallied strongly from 97.60 → 98.60 on Sept 1 (likely institutional accumulation).
Since then, we’ve been in a range/consolidation:
Support zone: 97.90 – 98.00
Resistance zone: 98.55 – 98.65
Liquidity pools:
Buy-side liquidity above 98.65 (equal highs).
Sell-side liquidity below 97.90 (equal lows).
This is a perfect pre-NFP “box” setup.
---
📌 Likely NFP Scenarios (Sept 5)
Based on technical footprints:
1. Liquidity Sweep to the Upside → Reversal Down (High Probability)
Price spikes above 98.65 resistance on the NFP release.
Retail traders chase the breakout.
Institutions sell into that liquidity.
Reversal targets 98.00 / 97.90 support (maybe deeper toward 97.70).
This would match the typical “NFP fake breakout” play.
---
2. Liquidity Sweep to the Downside → Reversal Up (Alternative)
Price sweeps below 97.90 support first.
Sharp rejection back inside the box.
Real move then pushes back above 98.40–98.60.
This scenario requires a strong rejection wick — otherwise, a clean break of 97.90 means sellers fully take control.
---
🔑 Technical Clue
Institutions already built longs from 97.60.
They might use NFP to take profit by running price above 98.65, then selling off.
If the spike and reversal play happens → expect USD weakness after the news.
---
🎯 Trading Playbook for Tomorrow
1. Mark the range box: 97.90 (support) – 98.65 (resistance).
2. Wait for the first spike on NFP (don’t chase it).
3. If it sweeps liquidity (either side) and rejects sharply → trade the opposite direction.
4. Targets: opposite side of the box (98.65 → 97.90, or 97.90 → 98.65).
---
✅ In short: Technically, todays NFP will likely grab stops above 98.65 first, then reverse lower toward 98.00/97.90. But always wait for confirmation — the first spike is usually the trap.
DXY: Strong Bullish Sentiment! Long!
My dear friends,
Today we will analyse DXY together☺️
The in-trend continuation seems likely as the current long-term trend appears to be strong, and price is holding above a key level of 97.952 So a bullish continuation seems plausible, targeting the next high. We should enter on confirmation, and place a stop-loss beyond the recent swing level.
❤️Sending you lots of Love and Hugs❤️

Repeated rejection of the Dollar Index once againAfter yesterday’s news on the Pound, which caused the Dollar Index to print a brief bullish candle, we can see that it has once again reversed from that key resistance. There is a possibility that it could drop to 97.500.
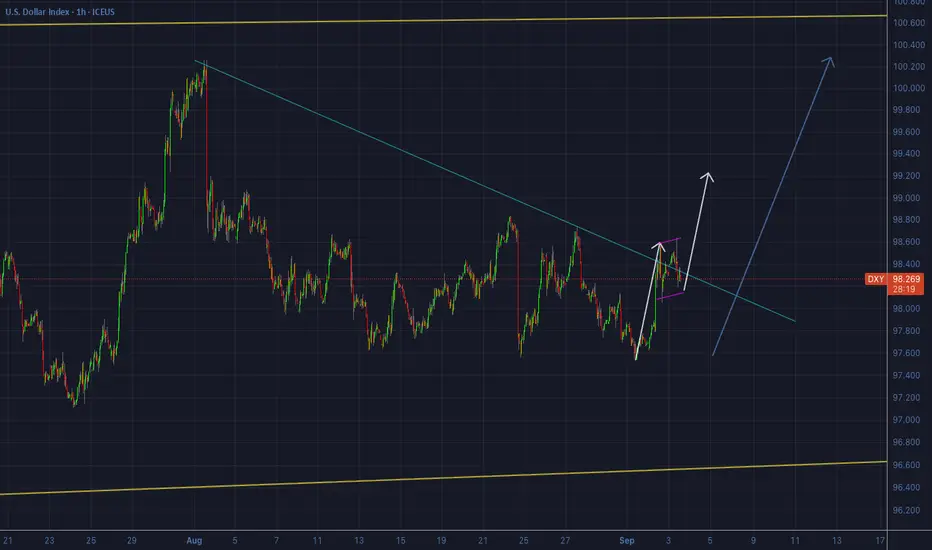
Dollar Index - Potential to break out + move to 100 still thereThe potential to break out of the trend and continue to the 100 area is still there.
What initially seemed like a rejection from the trend (pls see our comment on previously posted analysis: ), turned out to be a bigger consolidation on the trend line instead.
Furthermore, the consolidation (abc structure) looks like already over or over very soon.
Keep an eye for buy setups - there is a lot of pips from where price is now to 100.
Stay tuned.
US INDEX Decisive Moment for next Major MoveThe Dollar has had the bulls and the bears at battle for weeks at the current price action BUT its come to its breaking point where is has to elect a winner BULLS OR BEARS ?
Breaking it down thru each timeframe i believe 98.500 is what we have to break to confirm bullish Rally 103.000-105.000 next targets
On the other hand if we break 97.000 bears have taken over 95.000 next target zone
will look at US30 and EU along w other pairs to see if i can correlate anything

DXY Dollar Index NFP monday journal Forecast Crystal Clear to me Dollar will keep getting stronger till NFP on friday, reversal level should be around 99/ 99.25 then big drop towards 92.50
Thats a Big drop don't miss it
GG

DOLLAR INDEX DOLLAR index at exactly 12;30 gave us a clear sell which gave gold buyers the opportunty to go long from 3475 level to 3530 and extending its gain on daily
The US Dollar Index (DXY) is a financial index that measures the value of the United States dollar relative to a basket of six major foreign currencies. It is widely used to gauge the overall strength or weakness of the US dollar in global currency markets.
Key Facts About DXY:
The index is calculated as a weighted geometric average of the US dollar’s exchange rates with six major currencies:
Euro (EUR): 57.6% weight (the largest component)
Japanese Yen (JPY): 13.6% weight
British Pound (GBP): 11.9% weight
Canadian Dollar (CAD): 9.1% weight
Swedish Krona (SEK): 4.2% weight
Swiss Franc (CHF): 3.6% weight
The DXY rises when the US dollar strengthens against these currencies and falls when it weakens.
It was created in 1973 following the collapse of the Bretton Woods system to provide a standardized benchmark for the dollar's value.
The index is maintained and published by the Intercontinental Exchange (ICE).
Why DXY Matters:
The DXY is a key indicator for traders, economists, and investors to assess the dollar’s performance globally.
It affects pricing in global trade and commodities, which are often denominated in US dollars, such as oil and gold.
Movements in the DXY influence monetary policy decisions, financial markets, and global economic dynamics.
In essence, the DXY is the benchmark for measuring the US dollar’s strength against a basket of significant global currencies, providing a comprehensive picture of its international value.
UNITED STATE ECONOMIC DATA REPORT TODAY.
The latest US ISM Manufacturing PMI (Purchasing Managers' Index) is 48.7 for August 2025, slightly below the forecast of 49.0 but above the 48.0 previous A PMI below 50 indicates contraction in the manufacturing sector, so this points to a modest slowing but less severe than expected.
The ISM Manufacturing Prices Index stands at 63.7, down from 65.1 forecasted and marginally below the 64.8 previous data . This index measures prices paid by manufacturers for raw materials and inputs, and a reading above 50 signals rising input costs. The current elevated level suggests continued inflationary pressures on manufacturing costs, although slightly easing.
Summary:
US ISM Manufacturing PMI: 48.7 (contracting modestly, slightly better than forecast)
US ISM Manufacturing Prices: 63.7 (input costs rising, but showing some easing)
These indicators suggest the US manufacturing sector is experiencing a mild contraction, with inflationary cost pressures moderating somewhat but still elevated. This mixed data can influence Federal Reserve policymaking, signaling slower growth but persistent price pressures.
The COMEX gold price today, September 2, 2025, is trading near $3,550 to $3,567 per troy ounce. The gold futures recently surged, hitting new record highs above $3,550, supported by expectations of a Federal Reserve rate cut and ongoing geopolitical uncertainties. Gold has gained over 1% on the day, reflecting strong safe-haven demand amid dollar weakness and inflation concerns.
In summary:
COMEX Gold price around $3,550 - $3,567 per ounce (September 2, 2025)
Recent gains driven by Fed rate cut expectations and geopolitical risks
Price at record levels, reflecting strong investor interest
#dollar #dxy #gold #xauusd

Break of dynamic resistance or rejection?It’s been a long time that this resistance has prevented the Dollar Index from reaching the 100 level, and the price has been making strong efforts to break through and establish itself above this zone. At the end of the week, we have a very important news release for the US dollar, so we need to see how the price reacts to this resistance in the coming days.
DXY surprise break Down Surprise DXY breakdown through proprietary unique harmonic technical analysis & Numerology
see VIX blackSwan breakdown for more details

DXY LongThe dxy index is anticipated to climb from 97.4, supported by the confirmation of the Shark harmonic pattern, which signals strong bullish momentum.

Dollar Index - back to 100Dollar Index headed back to the 100 area.
That's our forecast based on structure analysis.
If you didn't manage to get in yet, that is ok. The first move is never the first easiest setup to take. However, if the move will continue to 100, as we expect, it should at least give us another buy opportunity at the break of the trend. Anyways, the first move is gone now as the price has almost already moved the average amount of pips it usually moves on an average daily impulse.
Probably it will go a bit further to confirm the break today and then start consolidating for the next impulse.
Stay tuned for more updates as we'll try to post the next buy setup before it happens.


DXY Intraday Overview- US Dollar Index (DXY) breached the symmetrical triangle downwards and sustained downwards.
- It indicates that sellers are still strong, hence the structure remains downwards.
🔽 If the immediate support level of 97.80 (fib level 0.786) is broken again, then the price will continue its fall to the next support zone between 97.56 - 97.50
🔼 However, if the price manages to recover and break through the resistance level of 97.90, we can expect a further rise to the level of 98.00.

DXY – Big Week Ahead, Watch These Zones-Dollar still stuck in a range. No need to guess, just watch the heavy levels:
-96.66 = bullish liquidity zone
-99.80 = bearish liquidity zone
-This week is packed with heavy news:
-NFP Friday – jobs report could shake markets hard
-Fed credibility under fire – politics trying to pressure the central bank
-Be careful with dollar pairs — market makers love stop hunts around news.
Best to stay patient → let price show which zone breaks first.

The DXY chart for my EURUSD & EURFUTURES tradeCant see it all but theres a perfectly formed very long leg which is 200 bars long and 1000pips, then a perfectly formed 12hr ascending flag, 3 different trendlines which have even HH HLs on 2 of them, and lastly a 2hr support turned resistance entry at the 12hr flag retest after the breakout.

US job numbers this week. Keeping an eye on USD and US indicesWe are keeping a close eye on the US job numbers this week, as those fall into the Fed's spotlight. The expectations are low, so it would be interesting to see if the numbers can get even lower. Let's take a look.
MARKETSCOM:DOLLARINDEX
FX_IDC:EURUSD
Let us know what you think in the comments below.
Thank you.
75.2% of retail investor accounts lose money when trading CFDs with this provider. You should consider whether you understand how CFDs work and whether you can afford to take the high risk of losing your money. Past performance is not necessarily indicative of future results. The value of investments may fall as well as rise and the investor may not get back the amount initially invested. This content is not intended for nor applicable to residents of the UK. Cryptocurrency CFDs and spread bets are restricted in the UK for all retail clients.
