$USCPCEPIMM - U.S Core PCE ECONOMICS:USCPCEPIMM
(October/2025)
source: U.S. Bureau of Economic Analysis
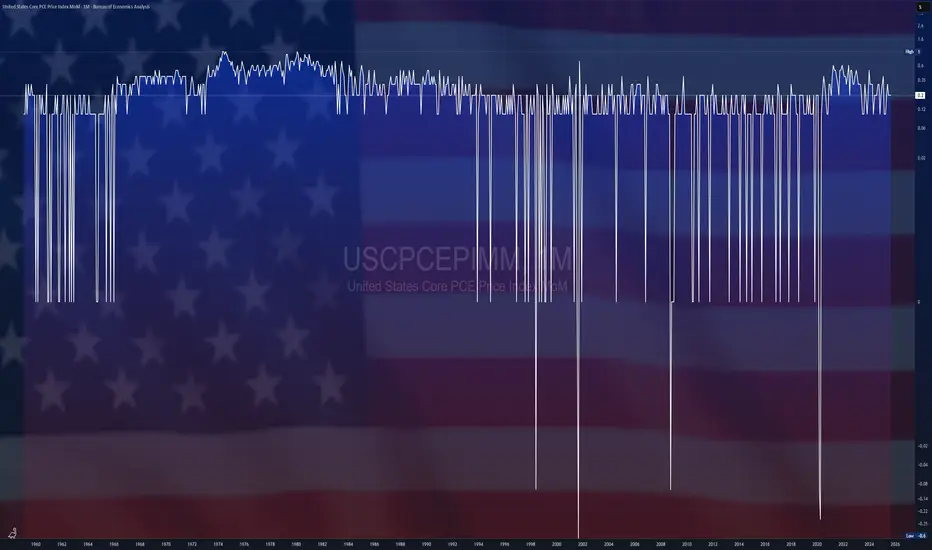
- The core PCE price index in the US, which excludes volatile and energy prices and is Federal Reserve's chosen gauge of underlying inflation in the US economy, went up 0.2% from the previous month in September of 2025.
It was the same as in August and July, in line with market expectations.
From the previous year, the index rose by 2.8%.
Market insights
$USCPCEPIMM -U.S Core Inflation (September/2025)ECONOMICS:USCPCEPIMM +0.2%
September/2025
source: U.S. Bureau of Labor Statistics
- Core consumer prices in the US, which exclude food and energy, rose by 0.2% from the previous month in September of 2025, slowing from the 0.3% in the August and July, and slightly under market expectations of a 0.3% increase.
The data was released with weeks of delay as the ongoing US government shutdown suspended activity in the Bureau of Labor Statistics.
Prices rose slower for shelter (0.2% vs 0.4% in August), transportation services (0.3% vs 1%), and new vehicles (0.2% vs 0.3%).
In turn, the CPI rebounded for medical care services (0.3% vs -0.1%) and accelerate for apparel (0.7% vs 0.5%).
From the pervious year, core consumer prices rose by 3% in September.
$USCPCEPIMM - U.S PCE Inflation (August/2025)ECONOMICS:USCPCEPIMM
August/2025
source: U.S. Bureau of Economic Analysis
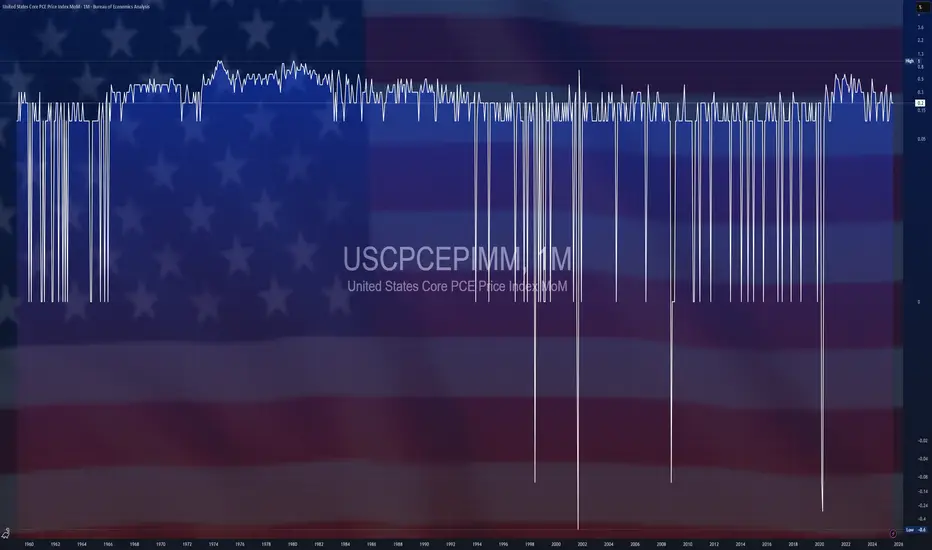
- The US PCE price index went up 0.3% mom in August, after a 0.2% gain in July, in line with market expectations.
Core PCE increased 0.2%, also in line with forecasts.
On an annual basis, headline PCE inflation accelerated to 2.7%—the highest in six months.
Meanwhile, core PCE inflation held steady at 2.9%.
Both annual figures came in line with expectations.

$USPCEPIMC -U.S PCE Inflation Slows as Expected (March/2025)ECONOMICS:USPCEPIMC -U.S PCE Inflation Slows as Expected (March/2025)
ECONOMICS:USPCEPIMC
March/2025
source: U.S. Bureau of Economic Analysis
-The personal consumption expenditure price index in the US was unchanged in March from February 2025, the least in ten months, and following a 0.4% rise in each of the previous two months, in line with expectations.
Prices for goods fell 0.5%, after a 0.2% increase in February and prices for services went up 0.2%, easing from a 0.5% rise.
Meanwhile, the core PCE index, which excludes volatile food and energy prices, was also unchanged, compared with forecasts for a 0.1% increase.
Separately, food prices rose 0.5% (vs a flat reading) while prices for energy goods and services dropped 2.7% (vs 0.1%).
Finally, the annual PCE rate decreased to 2.3%, the lowest in five months, and the annual core PCE inflation also eased to 2.6%.
$USCPCEPIMM -U.S PCE (October/2024)ECONOMICS:USCPCEPIMM
October/2024
source: U.S. Bureau of Economic Analysis
-The US core PCE price index, the Federal Reserve’s preferred gauge to measure underlying inflation, rose by 0.3% from the previous month in October 2024, the same pace as in September and matching market forecasts.
Service prices rose by 0.4%, while goods prices decreased 0.1%. Year-on-year, core PCE prices rose by 2.8% in October, the most in six months, also in line with market estimates.

-United States PCE (October/2024)$USCPCEPEPIMM 0.3%
(October/2024)
source: U.S. Bureau of Economic Analysis
-The US core PCE price index, the Federal Reserve’s preferred gauge to measure underlying inflation, rose by 0.3% from the previous month in September of 2024, the highest gain in five months, following an upwardly revised 0.2% increase in August, matching market forecasts. Service prices rose by 0.3%, while goods prices decreased 0.1%.
Year-on-Year, core PCE prices rose 2.7%, the same as in August, but above forecasts of 2.6%. source: U.S. Bureau of Economic Analysis

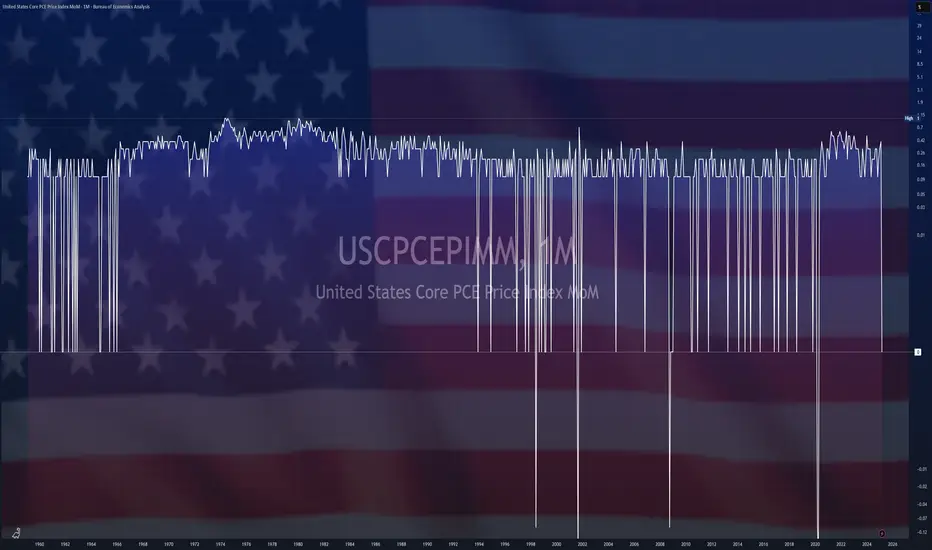
U.S Core PCE Price Index (MoM)ECONOMICS:USCPCEPIMM
Core PCE prices in the US, which exclude food and energy,
rose by 0.2% from the previous month in December of 2023, aligned with market estimates, and picking up slightly from the 0.1% increase in November.
From the previous year,
Core PCE prices edged 2.9% higher,
undershooting market estimates of 3% to mark the lowest reading since February 2021.
The data extended the disinflation trend in prices measured by the Federal Reserve’s preferred gauge, consistent with previous signals of rate cuts to be delivered this year. Regarding the whole national PCE that includes energy and food, prices rose by 0.2% from the prior month and 2.6% from the prior year, consistent with expectations.
Prices for goods rose by less than 0.1% from 2022, while those for services remained elevated at 3.9%.
source: U.S. Bureau of Economic Analysis
