Elrond has broken, ready to riseHello my friend
Looking at the big picture for Elrond, I think he's broken and eliot will repeat again. Macd is producing buy signals on the daily chart and the reds have turned white for the weekly chart, and I expect it to turn green on the weekly chart and produce a buy signal soon. Rsi is also at the bottom of the formation and it crossed the trend for an uptrend, when I look at the indicators, I am positive and I believe it will get bull again for Elrond. There may be short-term dreams, but in the long term, the direction is up. Don't forget to follow bitcoin and stop. If you like my idea, don't forget to comment and like, it will be the best thank you for me.If you like this idea, you can also check out my ideas below.
It is not investment advice.
EGLDUST.P trade ideas

EGOLD USDT Resistance (Long-Term TP'S)>>>>>>>>>>>>>Hello EveryOne
I Have Tried My Best to Bring the best Possible outcome in this Chart
It's not Advise to Any Move Just For Future review
With Hopping Success>>>>>>>>>>>>>>>>>

Eggs/usdt Free signalEgld/usdt Now Can Pump if You Are Interested
Then Buy Your own risk
Target1=$170
Target 2=230
Target 3=300
Stop Lose=$120

EGLD break out from W pattern .Hello traders 🐺 .
IF you remember my last idea about the EGLD , you know that in the last idea I was talked about the long term view of the EGLD and you can find it in the Related idea down below this idea , but in this idea I want to talk about the short term view of the EGLD :
In the chart above you can see that EGLD is breaking out from the minor W pattern inside the triangle pattern and now trying to retest the neck line as a new support , and as you can see in the chart I showed you the possible path for the EGLD price and after reaching the W pattern target , EGLD will faced to a daily resistance ( blue box) which is in alignment with the triangle upper trend line and also it's a W pattern price target .
But after testing the daily resistance , EGLD may goes down again and consolidation between the daily boxes , and after that decided to break from the triangle .
If you are currently in the long position , you can puts your take profit around the daily resistance box at 180$ , but still there is chance for goes further above , so trade based on your trading strategy .

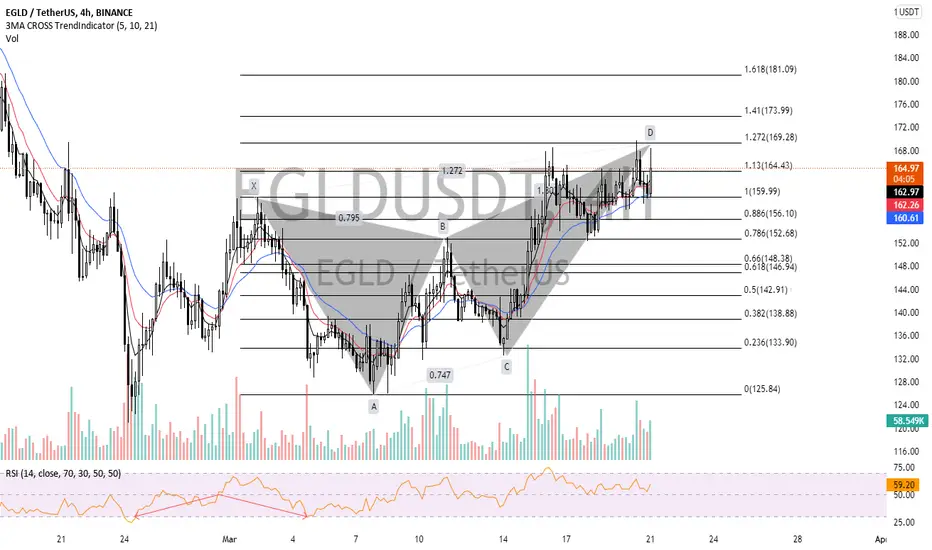
Short Signal For EGLD !#harmonicsignal #Crypto
EGLD/USDT (Futures) Update
⬇️Short Signal
Entry at 169.28
⭕️SL @173
🔵TP1 @153
🔵TP2 @142
Move your SL to entry level after tp1 hitted.
Take out 75% at tp1 remaining for tp2
Only Risk 1% of your Equity.
EGLD - NEXT MOVE UP?Hey Guys, I see a cup and handle formed and think it will break it today. What are you thinking?

EGLD Looks about to explodeBreak from wedge then retest and I expect to see it pump now if BTC can remain stable, great entry for a swing here.


EGLDUSDTDISCLAIMER:
This is not financial advice! This is an opinion-based show. I am not a financial adviser. Please only invest what you can afford to lose, and we encourage you to do your own research before investing.
everyone should buy and sell according to their own strategy.
Everything you need to know is outlined in the chart and keep in mind that we are moving forward with probabilities and the analysis may be wrong so take capital management seriously.

EGLD UPDATE EGLD has been on watchlist for a minute now and is seriously now testing trend line resistance. We are looking for a big week for this beast.

EGLDEGLD currency can start good growth after pullback to broken dynamic resistance. Keep this currency under control. Do not forget the loss limit in this market.

EGLD setup with 61% profit$EGLD started uptrend early be cause of metabonding. Next impulse will be connected to Itheum launchpad event.
First target is $188, then will be strong resistance on $200 and final boss is $228. This is the target of bounce.
Buyers zone is close to $130.


Symmetrical triangle of EGLDIt's the perfect setup for a symmetrical triangle, volume is decreasing and the pattern is being built. Better wait for breakout and retest for entry or the area of 157 looks good for entry.


In the end, the EGLD coin broke its falling trendlineThe Elrond coin price is moving higher after breaking the declining trendline, and the coin is observing bullish after the breakout.
The EGLD coin is approaching 100-day moving average after maintaining the crypto price higher above 20 and 50 MAs.
The Elrond coin is looking above the 20 and 50-day moving averages and below the 100 and 200 MA in the daily price chart.
Stoch RSI is rising higher and showing a bullish trend in the context of the regular price chart. At the time of writing, the indicator is moving into overbought territory. Furthermore, the Average Directional Index is at 12-points, suggesting an extreme sideways movement for the Elrond coin.
Elrond investors are looking for a bullish weekend. Now it remains to be seen whether the bulls will succeed in this act. Sellers may gain a greater role around the $230-resistance if investors are unable to break through the next barrier.
Support level - $120and $100
Resistance level - $230 and $300

EGLD/USDT READY TO TEST PREVIOUS ATH!!Hello everyone, if you like the idea, do not forget to support with a like and follow.
Welcome to this EGLD/USDT TRADE setup. EGLD looks promising here.
Breaking out from an ascending triangle in the daily time frame. It also trades above 50ma which is a very good sign.
Buy some now and add more in dips.
Entry range:- $150-$164
Target:- 200-250%
SL:- $118
If you like this idea then do support it with like and follow.
Also, share your views in the comment section.
Thank You!

EGLDUSDTHello Crypto Lovers,
Mars Signals team wishes you high profits.
We are in the daily time frame. The price has hit the support zone and was supported two times. Now the price is moving up to the resistance zone. The price needs to break the confluence of the resistances to go up but it is possible for the price to have another falling after hitting this area or even reverse set-back from the area. The price is also inside a triangle and if the first support zone is lost, it can move down to the next which would be a good buying area. If the resistance zone is broken, it will move to the next resistance.
Warning: This is just a suggestion and we do not guarantee profits. We advise you to analyze the chart before opening any positions.
Wish you luck

🔥 EGLD Reversal From 1-Year Bullish ChannelEGLD has been trading inside this bullish channel for over a year now. Recently, EGLD has seen a lot more bullish price action coming it's way because it was rejecting a huge support area around $130.
Assuming that this is the bottom, EGLD could move all the way back to the top of the channel. Be aware that this is a long-term trade and might take multiple months to play out. Furthermore, the current market's outlook is not good. Wait for a definite change in trend before entering long-term bullish trades.
Happy trading!

💡Don't miss the great buy opportunity in EGLDUSD @ElrondNetwork
Trading suggestion:
". There is a possibility of temporary retracement to the suggested support line (145.02).
. if so, traders can set orders based on Price Action and expect to reach short-term targets."
Technical analysis:
. EGLDUSD is in a range bound, and the beginning of an uptrend is expected.
. The price is above the 21-Day WEMA, which acts as a dynamic support.
. The RSI is at 63.
Take Profits:
TP1= @ 160.15
TP2= @ 183.35
TP3= @ 206.16
TP4= @ 222.26
TP5= @ 254.37
SL= Break below S2
❤️ If you find this helpful and want more FREE forecasts in TradingView
. . . . . Please show your support back,
. . . . . . . . Hit the 👍 LIKE button,
. . . . . . . . . . Drop some feedback below in the comment!
❤️ Your support is very much 🙏 appreciated! ❤️
💎 Want us to help you become a better Forex / Crypto trader ?
Now, It's your turn !
Be sure to leave a comment; let us know how you see this opportunity and forecast.
Trade well, ❤️
ForecastCity English Support Team ❤️

EGLD same scenario as BTC great entry is from wave E at the triangle that will make a B , The C leg the potencial to reach 321$

