$SPY $SPX Scenarios — Tuesday, Nov 4, 2025🔮 AMEX:SPY SP:SPX Scenarios — Tuesday, Nov 4, 2025 🔮
🌍 Market-Moving Headlines
🚩 Jobs data on deck: Tuesday’s focus is on labor demand — the JOLTS report remains a key barometer for wage pressure, though it may not print due to the shutdown.
⚠️ Data blackout continues: The Trade Balance and Factory Orders are both delayed government releases, keeping markets dependent on Fed tone and price action.
💬 Fed-speak pre-jobs: Vice Chair Bowman’s early-morning remarks will frame policy bias ahead of ADP and Friday’s NFP.
💻 Volatility compression: With few confirmed reports, traders watch AMEX:SPY ’s range behavior and TVC:VIX positioning before the labor-data surge mid-week.
📊 Key Data and Events (ET)
⏰ 6:35 AM — Michelle Bowman (Fed Vice Chair) speech
⏰ ⚠️ 8:30 AM — U.S. Trade Deficit (Sept) — may not print
⏰ ⚠️ 10:00 AM — Factory Orders (Sept) — may not print
⏰ ⚠️ 10:00 AM — Job Openings (JOLTS, Sept) — may not print
⚠️ Note:
All three macro reports are subject to delay under the continuing government shutdown. Expect headline-driven trading and low data-volume volatility until Wednesday’s ADP and ISM Services releases.
⚠️ Disclaimer: Educational and informational only — not financial advice.
📌 #trading #stockmarket #SPY #SPX #Fed #Bowman #JOLTS #TradeBalance #FactoryOrders #bonds #yields #economy #shutdown #macro
Trade ideas

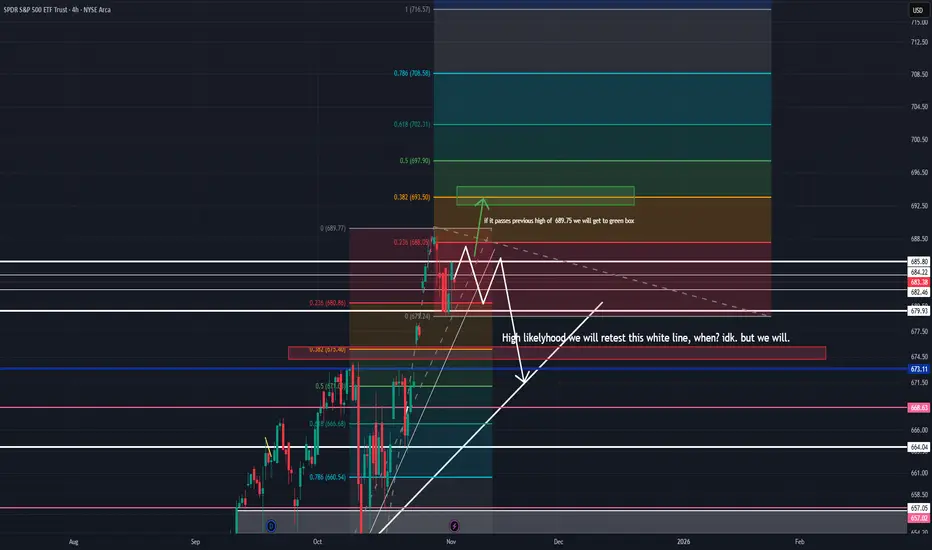
bearish vibeslooking at AMEX:SPY we have some key levels I want to see broken. 689.77 for more upside to golden fib level of 693.50 and possibly higher eventually. rsi is showing small bearishness that could easily be shaken off. there is a large trendline on the 4 hour I have strong conviction that we will touch again, when? idk- but we will touch it again.This chart excites me as a bear. I would love to see a strong push up, making the downside to that white line even stronger. profit boxes are marked conservatively as I am a scalp trader mostly and will be looking for break outs and reversals as well as momentum plays mostly on the 4h 15m and 1m. Gaps excite me as a bear, these ghostly floating october candles will come back to haunt us before the ghost of chrismas pasts come back to visit (it will likely gap and retest in november). I would think sooner than later we test that white like and likely jump up off of it on the first test then possibly flush below it. Fundementals and news play into this as well. The news might be the catalyst to allow volume and momentum to flush or propel us upward more.
Remember the market is not "rational" we play in probabilities, patterns, discretion, behavior, politics, and within the space of predictive sentiment.
I'm also watching macro sentiment by looking at CBOE:VIXY and COMEX:GC1! even looking at $NASDAQ:TLT. These can help predict SPY & QQQ sentiment.
Watch for earnings and possible gov't shutdown news that might shift price. Any emotional tilt can send price into dramatic (and often temporary) moves. looking at the ADX Dmi +,- there is a due break out coming soon. All points are converging in to the center - aka its getting a little too quiet. I expect a good move sometime this week before we come into 11/10.
Only one sector keeps the S&P 500 alive.Since 2019, Technology (XLK) has surged +199.7%, almost doubling the S&P 500’s +101.8%.
The remaining 10 sectors have lagged behind, creating one of the largest performance gaps in S&P history.
The equal-weighted index (RSP) tells the truth behind the headline numbers:
up only +57.5% vs +101.8% for the cap-weighted SPY —
a −44 pp underperformance that exposes just how concentrated this market really is.
Some sectors have barely moved or even declined:
🏠 Real Estate (XLRE) −2.5%
🧺 Consumer Staples (XLP) +17%
⚡ Utilities (XLU) +26%
💭 Reflection:
This isn’t a broad bull market — it’s a tech-driven rally.
When leadership narrows this much, strength becomes fragility. The S&P 500 looks healthy on the surface, but its heartbeat comes from a single sector.

Halloween Part 2SPX may gap down monday, if so, the ramp up at the end of the day was a C wave. Bias is still up. Oil closed the week above it's daily 18ma, so far so good for bulls. Vix pulled back from it's 18ma, but did not break it's lows. Gold still bear flagging. BTC closed the day below resistance and it's daily 18ma. The weekend will tell us more. Have a nice Halloween!

SPY : Stay heavy on positionsSPY : Stay heavy on positions (2x leverage)
Entering a risk-on, high-volatility zone.
A signal for catching a bounce has emerged.
In stay light on positions zones, I hold SPY(+QQQ) and reduce exposure.
In stay heavy on positions zones, I increase allocation using a mix of SSO(+QLD) and TQQQ.
** This analysis is based solely on the quantification of crowd psychology.
It does not incorporate price action, trading volume, or macroeconomic indicators.

$JNK signalling headwind for the equity market AMEX:SPY AMEX:JNK : There is a renewed bearish divergence between AMEX:JNK (high yield bonds ETF) and AMEX:SPY , as . Throughout recent sessions, the relative performance of AMEX:JNK vs AMEX:SPY has dropped sharply. This resembles the situation that began in early October when AMEX:JNK weakness preceded a pullback in $SPY.
Key Technical Insights
The current gap between AMEX:JNK and AMEX:SPY repeats the bearish divergence seen weeks ago, which ultimately led to a short-lived correction in equities.
Historical observation: When the high-yield market, as represented by AMEX:JNK , weakens ahead of stocks, it often signals increased risk aversion and signals downside risk in the equity market. ( AMEX:JNK is a leading indicator)
If this relative weakness in JNK persists, it again warns that AMEX:SPY may be vulnerable to a pullback, following the pattern established earlier this fall.
In summary, the renewed divergence between AMEX:JNK and AMEX:SPY is a bearish signal for equities, highlighting building risk in the credit market.

Most hated V-recovery deja vuDoes anyone else see this? It's been 5 years since the most hated v-recovery of 2020. Will the 2025 most hated v-recovery play out the same?

SPY to 670 area Even if it floats up today I think a sell to 670 is likely. Vix holding support above 16. Gold flagging but probably goes higher. Oil needs to start attracting buyers otheriwse the downtrend continues. BTC looks like it will drop to 105k minimum.

History Repeats (Dot Com Bubble but this time AI Hype)Jan, 2028 will probably see the height of the bubble at around $966 for SPY. Recycle, Reuse, Rinse, Repeat. Looking forward to being right, moreso than generating about a 5x return. See you on the dark side of the moon.

SPY: Last week of OctoberRealized, I forgot to do a halloween themed post :O! oh god,
Will have to make it up with a Christmas theme post haha.
My thoughts for next week, last week of October.
Not advice.
Safe trades and enjoy the scant amount of weekend left!
🎃🎃🎃🎃🎃🎃

SPY is going to hit ATH around 700 but cautious for ABC wave droSpy is part of wave 5 on weekly time frame
Wave 5 target is 700 around Dec,2025
ABC target is 485 around Sep 2026
Best of luck.

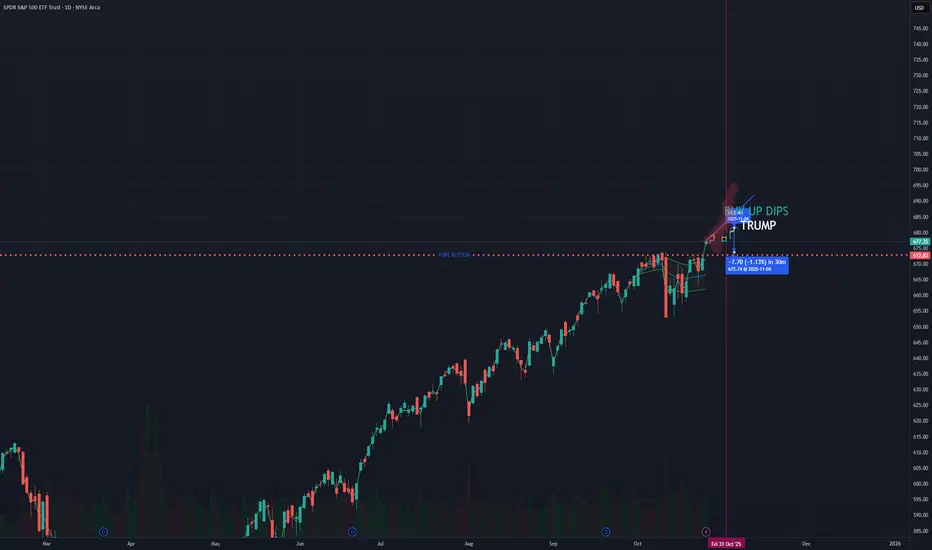
It's nuke timeOut of BB and having 3 gaps and mcd conversing as well. Within a week it will be come back to 670 easy

SPY: Status update and outlook for next week Hey everyone,
As per ush, sharing my thoughts, opinions and analysis on $SPY.
Hope you find it helpful and as always safe trades!

October 27 - October 31 2025Last week of the month and the market is back at ATH - but is this a true breakout or a final shakeout of buyers? I think the market is showing some important clues and will run through my charts again but plan on keeping this brief so I can move on to other things on this beautiful Sunday.
1. Macro
As I mentioned in last week’s post, the $GOLD/GVZ spread was showing signs of trend exhaustion (gold puts were being hedged heavily compared to the underlying) which provided to be an early signal of the Gold pullback. Here we are seeing the Dollar’s continued flat movement, which may result in a move below the average this week.
Yields continue to slide and are now diverging, with the 3M yield possibly showing signs of outpacing the 10Y yield to the downside, which may suggest that the market is expecting speedier intervention from the Fed.
On the bottom left, I have overlaid ECONOMICS:USCCPI on my forward inflation gauge chart to illustrate that the market has been pricing in lower inflation expectations, and we are now seeing the initial tariff-bump to inflation flatten out, which is in line with the market’s expectation. Bottom line - the market should now be more sensitive to news that could indicate higher inflation since it is currently pricing for lower rather than before when the market was pricing higher inflation that ended up being slightly higher than the real data.
On the commodities side, we’re seeing more of the same. I’ll touch more on gold on my Risk layout and it looks like Oil NYMEX:CL1! is still in a flat range and may be making a lower high after a lower low. This week I have expanded my commodity index (bottom right) to add Cotton ICEUS:CT1! and Aluminum COMEX:ALI1! to broaden the scope. My thinking is that corn CBOT_MINI:MZC1! is one of the most versatile crops in the world: a staple food, biofuel, and industrial crop, while Cotton is unique in that it is a non-food crop that is essential to the manufacturing of clothing and other consumer & industrial products. This pairing covers all the bases when it comes to demand for crops for various uses. Similarly, my thinking for metals is that Copper COMEX:HG1! is widely used in electrical infrastructure and consumer/industrial electronics while Aluminum COMEX:ALI1! is used in consumer products, construction, auto manufacturing, and so on.
The takeaway is that the gauge here has been in an uptrend in April while real inflation and forward inflation expectations have cooled, so the market is likely absorbing these higher prices/not passing them to consumers. Conclusion: the macro environment is looking more stable, however with China tariffs in focus it will be highly important to watch the commodity gauge and TVC:US03MY . Commodity gauge rising sharply could force the market to reprice inflation expectations, which would benefit Gold, hurt the dollar TVC:DXY and possibly lead to higher bond yields. I’m cautiously optimistic here.
2. FX
Using a date range of the last Fed rate decision to today, the dollar TVC:DXY has outperformed other currency baskets (while still being the worst performer for the year). When looking at global 3M and 10Y yields on indexed charts, outside of Japan there was 10Y buying during mid-October that is now showing signs of flattening out. On the 3M side, treasuries have slid while Eurozone (EU, France, Italy, Germany) are showing some divergence, likely due to a troubling combination of slow growth, high debt, and political instability. The takeaway here is that I expect the dollar’s flat range to continue, and may outperform other currency baskets as a result. This chart also indicates that the US bond market is currently providing a safe haven, especially when relatively attractive Real Yields are considered as well.
3. Risk
This chart shows indexes appeared to have recovered from the period of volatility and the line chart appears to show upward momentum, rather than a top forming. This is bolstered by the High Yield-Investment Grade bond Option Adjusted Spread (top left) showing signs of consolidation or moving back down. Investment Grade bonds currently have a very low premium vs treasuries, so downside resistance should be expected. Keeping it around this level would be ideal, as the OAS moving too low could make the market sensitive to a shock and moving higher could indicate an adverse sentiment towards risk.
Other signs are promising though. $ES1!/GOLD looks like it is going to move higher, further supporting the bias that the gold rally will continue to stall or pull back further. On the top right, $SPY/RSP (SPY vs the equal-weight ETF) shows the weighted index will continue in its uptrend, benefiting the companies with the most weight such as Tech.
One last comment on gold: on the $GOLD/GVZ chart we can see that Gold found support near a familiar level and will either see further reversion or a new upward trend form. This could suggest that the gold downside risk is fading, so it will be important to watch if Gold catches a bid and if so, whether or not it is accompanied by strong hedging. Since I’m mostly leaning towards Gold being flat, I think the more likely scenario is that the gold rally stalling will be temporary and will probably not be accompanied by strong hedging of puts.
4. Sector Analysis
Now that we have seen what is likely a volatility peak, it’s a good time to assess where the market is positioned. Good news is that even though the market pulled back and chopped around in October, Tech (XLK) is still outperforming the market and is on track to continue rising while defensive sectors underperform. Since I have already outlined other reasons why Tech and mega caps are likely to continue outperforming the broader market ( $NQ1!/YM1! and $SPY/RSP ), this is just further confirmation of what I’m already seeing.
5. Bias
As I mentioned last week, I’m currently taking a shorter-term trading approach and as a result, this Bias chart is now focused more on assessing and capturing volatility than determining market bias.
With that being said, the important notes I have are that VIX and VVIX look to have peaked and CVD saw some action last week with strong effort from sellers that did not really move the price down. Futures just opened higher so the session may have lower volatility on Monday (mean reversion) but overall the bullish case here is solid.
Conclusion:
Most signs I’m seeing here point to continued upside for stocks, as fear is being priced out and greed is being priced back in. As I mentioned above, I will watch the macro indicators and sectors for signs that the trend is changing but since we are likely seeing a true breakout, more upside should be expected unless something major changes.
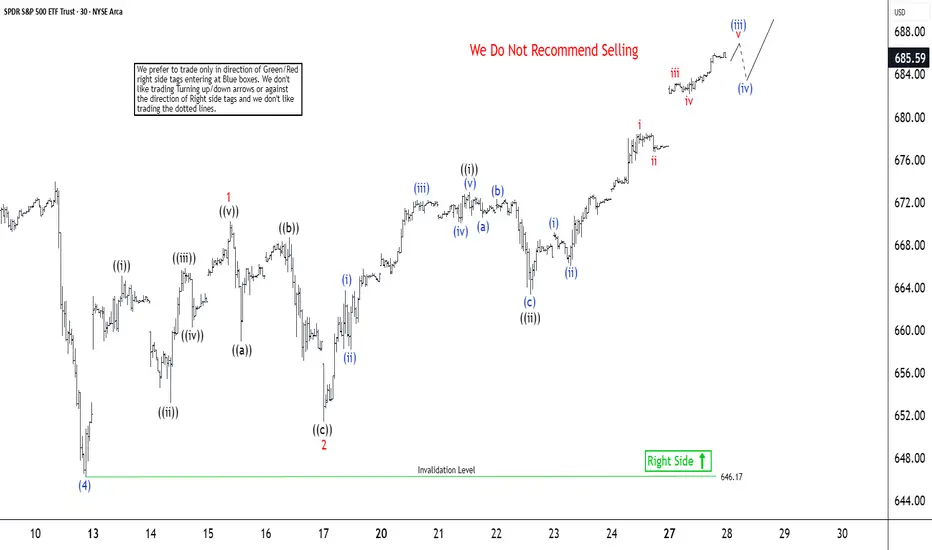
S&P 500 ETF (SPY) Advances with Nested Structure in Wave (5)The short-term Elliott Wave analysis for the S&P 500 ETF (SPY) indicates an ongoing bullish cycle that began at the April 2025 low, unfolding as a five-wave impulse structure. As shown in the 30-minute chart, wave (4) of this impulse concluded at 646.17. The final leg, wave (5), is currently underway, characterized by an internal five-wave structure with nested subdivisions. From wave (4), wave ((i)) peaked at 665.13, followed by a pullback in wave ((ii)) to 653.17. Wave ((iii)) then advanced to 665.83, with a subsequent dip in wave ((iv)) to 660.28. The final wave ((v)) reached 670.23, completing wave 1 on a higher degree.
Subsequently, the ETF corrected in wave 2, forming a zigzag Elliott Wave pattern that bottomed at 651.41. From wave 1’s peak, wave ((a)) declined to 658.93, followed by a rally in wave ((b)) to 668.71. Wave ((c)) then dropped to 651.41, finalizing wave 2. The ETF has since resumed its upward trajectory in wave 3. From wave 2’s low, wave ((i)) climbed to 672.99, and wave ((ii)) dipped to 663.30. In the near term, anticipate a pullback finding support in a 3, 7, or 11 swing against 646.17, setting the stage for further upside. This analysis suggests continued bullish momentum with well-defined support levels guiding the next moves.
$SPY. Sell 682/683 bear call spreads at open tomorrow.Y'all - I lost my dog 3 days ago. :( But I can still make some sweet calls.

Tuesday evening updateSPX rallied to another structural trendline and now has 4 daily bearish divergences on the rsi. Still the bias is up. VIX found support under 16 and at it's trendline. Gold looks like it will bounce with silver leading. BTC rejected from 116k and I think it is a short to 100k minimum.

Trading plan 10/27-10/31We will push for all time highs next week Monday and Tuesday not much is going on but Wednesday to Friday will be packed.

Monday morning updateSPX likely pushes higher to 6900 area. Gold may reverse violently to the upside if it can recover 4025. Oil looks fine, BTC probably a little higher but it's just in a Wyckoff topping structure.


Trading week 10/27 - 10/31 ATH INCOMING! we are the quant and a big week is approaching us we used all the data with economic data, earnings & geopolitical events coming up.
Stock Market Forecast | TSLA NVDA AAPL AMZN META MSFTStock Market Forecast | CME_MINI:NQ1! CME_MINI:ES1! SP:SPX NASDAQ:NDX
Mag 7 | TSLA NVDA AAPL AMZN META MSFT GOOGL

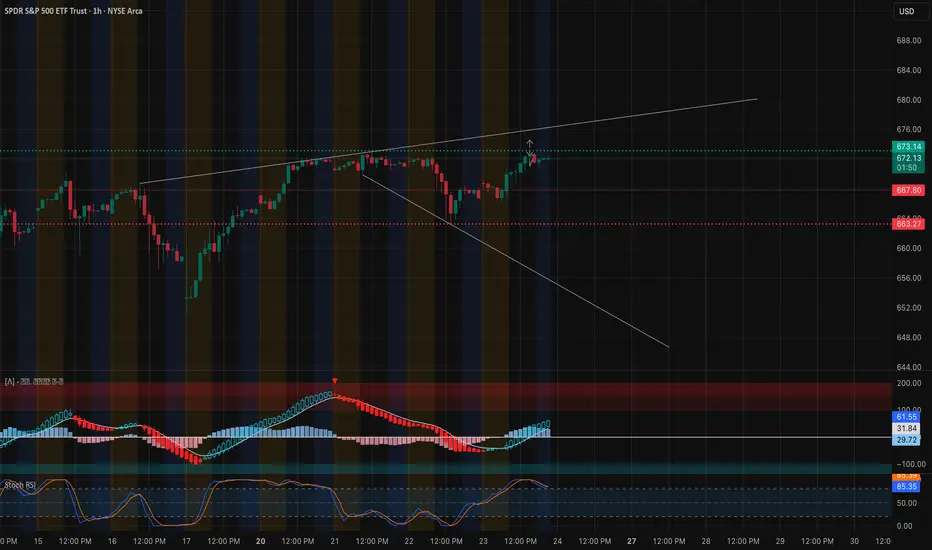
SPY at a Critical Pivot — (Oct. 24 Outlook)Watching $672–$674 for Breakout or Rejection ⚖️
1. Market Structure (1H & 15M)
SPY has recovered sharply from last week’s sell-off and is now pressing into a major resistance zone between $672 and $674, where previous liquidity sweeps and BOS (Break of Structure) levels reside. On the 1-hour chart, a clear CHoCH (Change of Character) marks the transition from a bearish to a bullish regime after the rebound from $658.
The structure remains bullish with higher highs and higher lows, but price is now testing the upper trendline of an ascending wedge pattern. A rejection from this zone could trigger a short-term pullback, while a clean breakout and close above $674 could open the path to retest the $680–$682 liquidity pocket.
The 15-minute chart shows the same wedge in more detail. After a small CHoCH near $671, price is stabilizing at the mid-channel. Buyers are absorbing dips, but momentum is flattening — a sign of equilibrium before a potential breakout move during Friday’s session.
2. Supply and Demand / Order Blocks
* Demand Zone: $666–$669 — where previous BOS confirmed buyer defense. This zone overlaps with the 9 EMA cluster and FVG (Fair Value Gap), making it the main reload area for bulls.
* Support Zone: $662–$665 — HVL (High-Volume Level) + PUT wall confluence from the GEX map.
* Supply Zone: $672–$676 — heavy liquidity cluster and previous rejection zone. A break above this level will likely induce dealer hedging and short covering toward $680+.
If SPY reclaims and holds above $674, the structure fully shifts bullish into next week. Conversely, rejection near this area followed by a break below $670 could pull price back toward $665 support before the next rebound attempt.
3. Indicator Confluence
* 9 EMA / 21 EMA: On both 1H and 15M charts, EMAs are still in bullish alignment, but the slope is flattening near resistance — signaling consolidation. If 9EMA crosses back above price with volume pickup, expect continuation higher.
* MACD: On the 1-hour, MACD shows strong recovery momentum, but histogram bars are starting to compress. On the 15-minute, MACD is slightly red, reflecting short-term cooling after an extended push.
* RSI: The 1H RSI sits around 86, nearing overbought territory, suggesting limited room before a short-term cooldown. The 15M RSI has already begun resetting near 53, implying a possible consolidation phase before another push.
* Volume: Volume is tapering as price grinds upward — typical of a rising wedge and often seen before a breakout test or controlled retrace.
4. GEX (Gamma Exposure) & Options Sentiment
The GEX landscape highlights a tight range between $665 (HVL + PUT wall) and $675 (highest positive gamma / CALL resistance). The CALL walls at $672–$675 align perfectly with the technical supply zone.
* Above $674: Dealer hedging could shift bullish, propelling SPY to $680–$682 as gamma flips positive.
* Below $665: Gamma turns negative, opening the door to volatility spikes down to $658.
IVR is 0.5 and IVX avg 15.6 (-4.24%), showing extreme volatility compression — this often precedes an impulsive move. The options flow leans heavily bearish at 85.9% puts, suggesting traders are defensively positioned, which can fuel a short squeeze if SPY breaks above $674.
5. Trade Scenarios for Friday, Oct. 24
Bullish Setup 🟩
* Entry Zone: $670–$671 retest or breakout above $674
* Targets: $676 → $680 → $682
* Stop-Loss: Below $667.5
* Confirmation: Hold above 9EMA on 15M, MACD histogram green, RSI > 60
Bearish Setup 🟥
* Entry Zone: $672–$674 rejection area
* Targets: $669 → $665 → $662
* Stop-Loss: Above $675
* Confirmation: MACD crossdown + CHoCH below $669
6. Closing Outlook for Oct. 24 (Friday)
Friday is shaping up to be a decisive session for SPY — the index ETF is testing a critical gamma and structural resistance zone at $672–$674. The next move from here will likely set the tone heading into next week’s earnings-heavy calendar.
If bulls can push through $674 with conviction, expect a gamma squeeze into $680+ as dealer flows flip long. But if the wedge structure holds and volume weakens, a healthy pullback to $665 support may occur before buyers reload.
The key lies in whether SPY can sustain above $670 during the early Friday session — holding that level keeps control in buyers’ hands.
💬 Final Thought:
“SPY is walking the fine line — trapped between $665 support and $674 resistance. Whichever side breaks first will likely dictate the next 10 points of movement. Stay patient — this is a volatility coil ready to spring.”
This analysis is for educational purposes only and not financial advice. Always do your own research and manage your risk before trading.