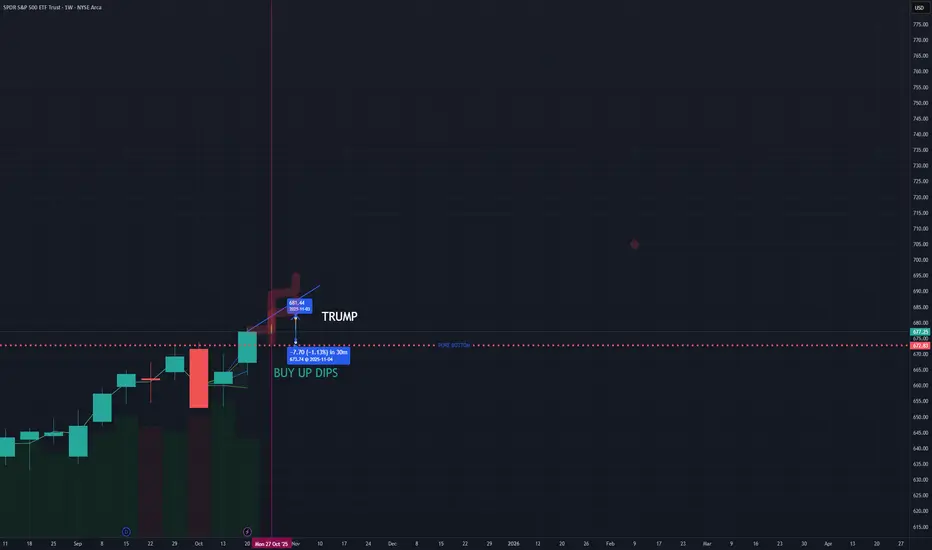
Wait for the BuyWe're cruising along today. The market pushed down this morning, then into accumulation, wait for the push lower. If its rejected, we'll see a push to the upside and close above 686 indicating a higher movement to come, followed by a pull back into our buying opp. Stay bull, we're headed back to 690.
Trade ideas

Post PowellSPX found resistance again at the structural trendline but bias is still up. VIX is holding above 16 but bias is still down. Gold liely rallies more overnight and into tomorrow. BTC is testing support again and may break. Oil is still above the 18 but not attracting buyers just yet.

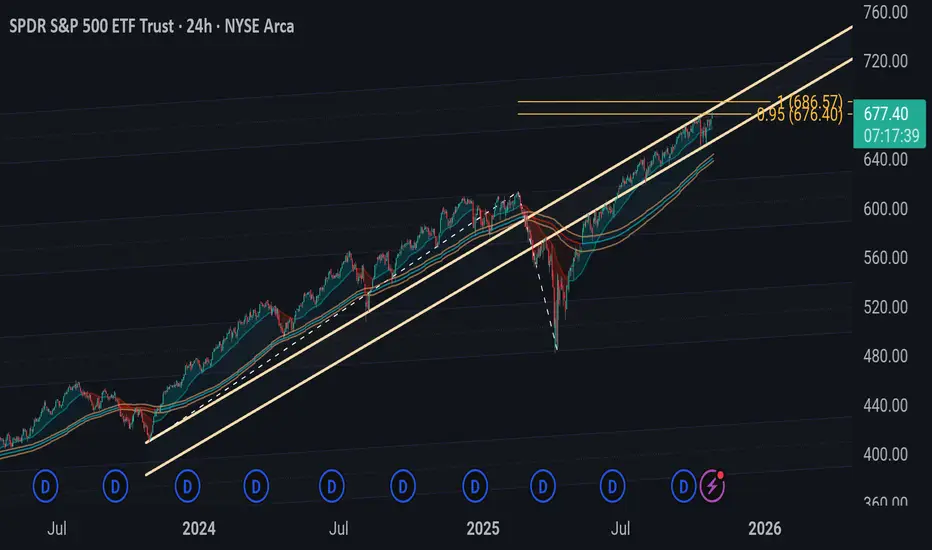
$SPY– Multi-Year S/D Zone & Riding a Parabolic ChannelAMEX:SPY AMEX:SPY on the monthly chart continues to respect a long-term ascending channel that began after the 2020 crash.
Price has now re-entered the multi-year supply/demand zone from 2021–2022, which previously acted as strong resistance and may now serve as a key support base.
AMEX:SPY
Since late-2023, momentum has accelerated within a steeper rising channel, hinting at potential overextension as the two channels converge near the 690–700 area.
Key points:
Primary trend: bullish since 2020 within the orange channel.
Multi-year S/D zone: 2021–2022 highs acting as structural support.
Secondary (steep) channel: signals short-term momentum that could face exhaustion soon.
Watch for either a breakout continuation above 700 or a pullback toward the mid-trendline for mean reversion.
Bias: Neutral to mildly bullish short term, but watching for signs of exhaustion as SPY approaches long-term resistance.
#SPY #S&P500 #TechnicalAnalysis #TradingViewIdeas #PriceAction #SupplyDemand #ChannelPattern

SPY: Post-Breakout Bullishness Meets Fed Caution – What's Next?SPY: Post-Breakout Bullishness Meets Fed Caution – What's Next?
Hello everyone! Let's take a look at SPY (S&P 500 ETF) on the daily timeframe, which has had quite an eventful October!
After some significant volatility earlier in the month, we've seen a strong surge, particularly after the positive U.S.-China trade news. This momentum has helped SPY to decisively break above a key resistance area.
Current Situation:
We've just cleared the recent breakout zone between 670 to 675. This is a very positive sign, indicating strong buying interest. However, price has moved up quite rapidly, creating a "Fair Value Gap" (FVG) – an area where price moved fast without much trading, which often acts like a magnet for future price action.
Now, with the upcoming Fed interest rate decision on October 29th and other economic data releases, we need to consider two main scenarios:
Scenario 1: The Ideal Bullish Continuation (Dotted Blue Line)
Our ideal outlook suggests that the market will continue its upward trend. For this to happen in a healthy way, we'd like to see SPY:
Retest the Breakout Zone: A small pullback to retest the 670 to 675 zone would be constructive. This confirms that the old resistance has now become strong support.
Continuation to the Trend: If this zone holds firmly after the retest, it would provide a solid base for the bullish momentum to continue, pushing SPY to potentially new highs. This retest is a common and healthy pattern after a strong breakout.
Scenario 2: Volatility & Potential Pullback (Dotted Orange/Blue lines and FVG)
We must also be prepared for increased volatility and a possible pullback. This could be triggered by:
Fed Decision & Economic Data: The Fed's interest rate decision and comments on Wednesday, October 29th, along with other key economic data, can introduce significant uncertainty and market swings.
FVG Fill: The rapid move up has left a "Fair Value Gap" (FVG) below. Price often retraces to fill these inefficiencies. A pullback to fill this FVG is very possible, especially if the Fed's stance isn't as dovish as hoped, or if other economic data disappoints.
Key Support Levels: If a deeper pullback occurs, we'll be watching:
Intermediate Support near 660: The first key area to potentially halt a decline.
650 to 655 Clear Support Area: This is a stronger support zone that has held previously, reinforced by the longer-term green trendline.
In Summary:
The overall trend is bullish following the breakout, but current levels are extended. Traders should closely watch how SPY reacts around the 670-675 level, especially in light of the upcoming Fed announcement. A successful retest and bounce would reinforce the bullish case, while a failure to hold, especially on negative news, could lead to a deeper correction towards our highlighted support levels.
Trade wisely and stay tuned for the Fed!
Disclaimer:
The information provided in this chart is for educational and informational purposes only and should not be considered as investment advice. Trading and investing involve substantial risk and are not suitable for every investor. You should carefully consider your financial situation and consult with a financial advisor before making any investment decisions. The creator of this chart does not guarantee any specific outcome or profit and is not responsible for any losses incurred as a result of using this information. Past performance is not indicative of future results. Use this information at your own risk. This chart has been created for my own improvement in Trading and Investment Analysis. Please do your own analysis before any investments.

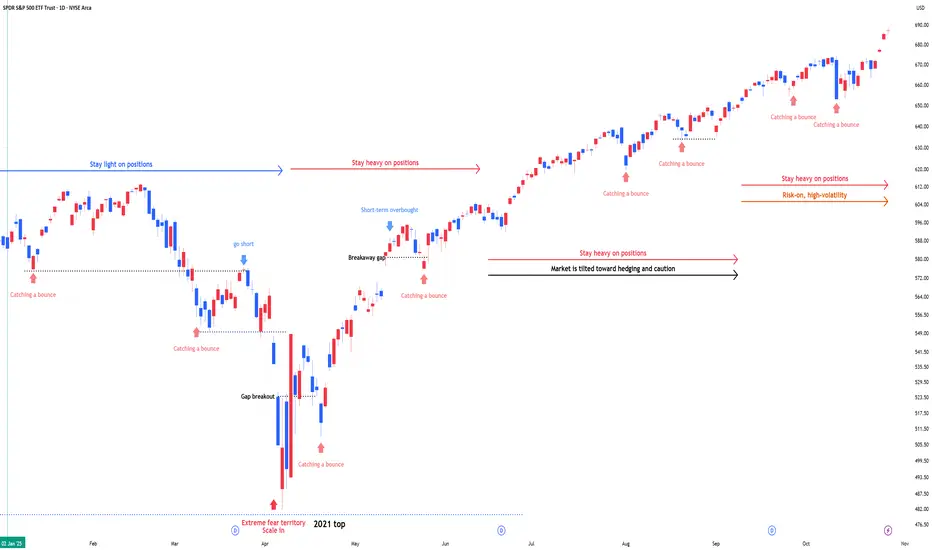
SPY : Stay heavy on positionsSPY : Stay heavy on positions (2x leverage)
Entering a risk-on, high-volatility zone.
In stay light on positions zones, I hold SPY(+QQQ) and reduce exposure.
In stay heavy on positions zones, I increase allocation using a mix of SSO(+QLD) and TQQQ.
** This analysis is based solely on the quantification of crowd psychology.
It does not incorporate price action, trading volume, or macroeconomic indicators.
Close to bulls Once it reach to 695 then its time to be cautious You can draw thr fib then the 1.68 lies at 695 and everytime once it touch the fib 1.68 it drop hard so may be same thing will happen this time as well.

October 27th 2025 - S&P short lived consolidation.. Breakout nowOctober 27th 2025 - Last weeks consolidation lasted until Friday's break out, S&P500 SPY closed at 677.25 which was all time high that lasted only until today. New all time high close at 685.18 today...
Watching support now 673.95 and we will see if we get a higher open in the morning... so watching res around the new all time high of 685.18.

Current SPY ConditionsI will use this chart to identify any important technical setups. This is th 60 Min Chart

SPY and QQQ Macro outlook for 27 to 31 Oct 2025Macro map for 27 to 31 Oct 2025
Concentration of policy and inflation prints means policy expectations and real yields will drive the United States dollar, global equities, bitcoin, and gold. The hinge events are Wednesday FOMC, Thursday US GDP advance and German data, Friday US Core PCE and Chicago PMI. Secondary drivers are BoJ policy guidance and ECB tone, plus BoC.
Watch list
Real ten year yield and the DXY dollar index after FOMC and PCE
EUR front end versus USD front end after ECB and FOMC
VIX around the FOMC window and into PCE
US liquidity windows around 14:00 Eastern on Wednesday and 08:30 Eastern on Thursday and Friday
SPY and QQQ outlook for next week
Set up
US equities enter a policy and growth triad. Wednesday brings the FOMC decision and press conference. Thursday brings the first look at Q3 growth. Friday brings the price index that the Fed emphasizes. The path for real yields and the earnings tone are the first order drivers. Valuation sensitivity is higher in QQQ due to the weight of long duration cash flows. SPY has more cyclicals and defensives and therefore reacts more to growth beats or misses.
Baseline view
A patient Fed message combined with growth that is solid but not hot and inflation that continues to ease supports a grind higher. The market prefers falling real yields with inflation in check. A hawkish shift in the balance of risks, or a hot inflation print that lifts terminal pricing, pressures multiples and skews returns lower. If messages conflict, expect a whipsaw week with heavy rotation.
Scenarios and probabilities
Relief grind higher with QQQ leadership. Probability thirty eight. Triggers are a patient tone on Wednesday, a growth print that shows resilience without overheating, and Core PCE that validates disinflation. Breadth improves and volatility stays contained.
Air pocket lower. Probability thirty two. Triggers are a firmer Core PCE or a hawkish shift in the statement language that pushes real yields up. Valuation compression hits QQQ first and deepest. SPY holds better if staples and energy carry.
Two way chop with wide intraday bars. Probability thirty. Triggers are mixed messages across events and sectors. Expect quick moves around 14:00 Eastern on Wednesday and 08:30 Eastern on Thursday and Friday with mean reversion later in the day.
Key confirms
Watch the ten year real yield and the curve. A drop in real yields with stable breakevens favors a risk appetite day. A jump in real yields with a firm dollar and tight financial conditions favors de‑risking. Also watch VIX and the put call ratio into Wednesday afternoon to gauge dealer positioning.
Risk notes
Large cap earnings that land between FOMC and PCE can add idiosyncratic gaps. Respect prior week high and low as regime markers. If the market opens outside that range and fails to re enter on a retest, trend day odds increase.

Weekly PreviewSPX on friday felt like a distribution day. Although it didn't sell down, it didn't gain much ground after the open. Vix is at support. Gold probably a bit higher still. BTC now above 111k and probably wants to take out stops around 116k. Oil still looks fine for more upside. Good luck!

SPY: Bears Will Push
Looking at the chart of SPY right now we are seeing some interesting price action on the lower timeframes. Thus a local move down seems to be quite likely.
Disclosure: I am part of Trade Nation's Influencer program and receive a monthly fee for using their TradingView charts in my analysis.
❤️ Please, support our work with like & comment! ❤️

Trading week 10/27 - 10/31 ATH INCOMING!we are the quant and a big week is approaching us we used all the data with economic data, earnings & geopolitical events coming up.
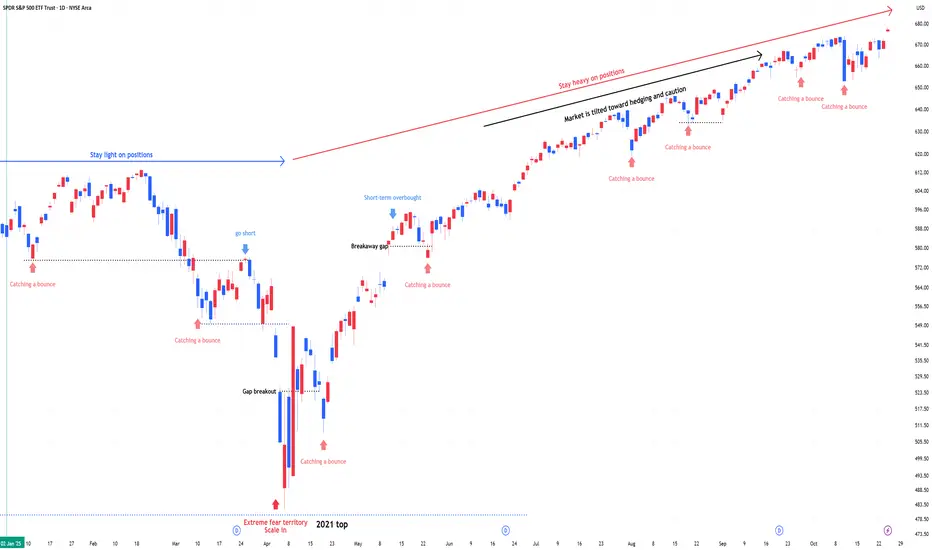
SPY : Stay heavy on positionsSPY : Stay heavy on positions (2x leverage)
Entering a risk-on, high-volatility zone.
In stay light on positions zones, I hold SPY(+QQQ) and reduce exposure.
In stay heavy on positions zones, I increase allocation using a mix of SSO(+QLD) and TQQQ.
** This analysis is based solely on the quantification of crowd psychology.
It does not incorporate price action, trading volume, or macroeconomic indicators.
Fib Extension ZoneMarkets are still climbing, stocks only go up blah blah blah... I believe a proper correction is well overdue. That little pullback we had was nothing and just the beginning to whats to come.
price is bouncing off both my transparent line and my parallel trend line that being respected so far.
Price has finally reached my Fib Extension Zone. I will be WATCHING for a correction to begin from this point on... if you haven't locked in any profits yet. my opinion, you should... not all, but something.
If price continue to rise. I will continue to dollar cost.
Hope is helps and God Bless....
Opening (IRA): SPY December 19th -590P... for a 6.24 credit.
Comments: Adding at strikes better than what I currently have on, targeting the strike paying around 1% of the strike price in credit.
Will generally look to roll at 50% max.

Opening (IRA): SPY November 21st -625P... for a 6.26 credit.
Comments: Whoop, there it is. >21 VIX plus weakness. Targeting the strike paying around 1% of the strike price in credit.
Will look to add at intervals, assuming I can get in at strikes better than what I currently have on.

more upside likelyspx should crack the highs tomorrow regardless of cpi. Gold looks like a consolidation, BTC similar. Oil looks good so far. VIX may be forming a cup and handle. All in the video good luck!

I could be wrong! Why stocks could go higher.Trading Fam,
It has been a whole year of testing my AI-crafted indicator, and I am learning to trust it more and more as I go. We recently reached my third and final target on the SPY. I sold. Did I sell too early. Possibly. If I was to wait for my indicator, I'd still be in long positions. Let's take a look at what my incredibly accurate indicator is telling us.
✌️Stew

Morning Market UpdateTest of the highs/breaking the highs is still possible today on SPX but a breakdown under the previous channel would be bearish. Gold could rally a bit more but I think it would start dropping after. Oil bias is now up and probably consolidates a bit here. BTC looks like it will drop.

I see 2 pathsSPY bounced from it's previous channel - still a chance we'll see a spike up. A gap down below the channel tomorrow is a short. Gold looks good for a larger bounce. Oil looks bullish. Vix could go either way here.

Spike and DropA spike up on the SP is likely to take out stops. Target 6800+ Gold still can bounce here at support. OIL looks good, but may fall a bit before a bigger move up (if it's coming). BTC can get to 116k still

Update on the marketsSPX is close to all time highs. A break above and reversal would be bearish. Gold and Silver probably bounces hard from here. BTC lower but could again rally. USOIL probably lower but could find a bottom soon.

SPY FREE SIGNAL|SHORT|
✅SPY is reacting from the all-time-high zone where institutional orders previously accumulated. A short-term retracement is likely as price sweeps liquidity above premium highs before rebalancing to the nearest fair-value gap. Time Frame 2H.
SHORT🔥
✅Like and subscribe to never miss a new idea!✅
