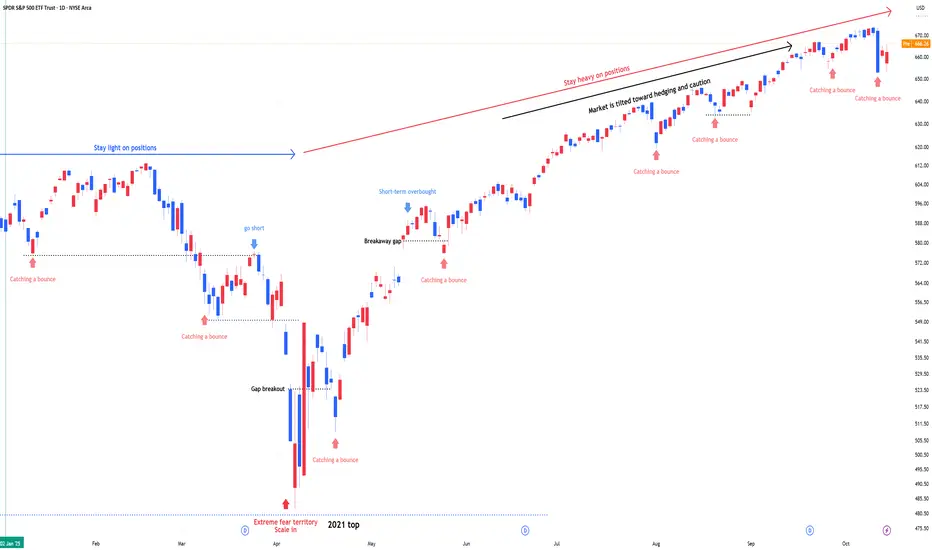
SPY : Stay heavy on positionsSPY : Stay heavy on positions (2x leverage)
Entering a risk-on, high-volatility zone.
In stay light on positions zones, I hold SPY(+QQQ) and reduce exposure.
In stay heavy on positions zones, I increase allocation using a mix of SSO(+QLD) and TQQQ.
** This analysis is based solely on the quantification of crowd psychology.
It does not incorporate price action, trading volume, or macroeconomic indicators.
Trade ideas
$SPY / $SPX Scenarios — Wednesday, Oct 15, 2025🔮 AMEX:SPY / SP:SPX Scenarios — Wednesday, Oct 15, 2025 🔮
🌍 Market-Moving Headlines
🚩 Growth pulse check: The Empire State Manufacturing Survey kicks off the day — a real-time test of factory sentiment post-summer slowdown.
📘 Fed Beige Book afternoon drop: Key read on regional activity and inflation anecdotes — markets often reposition after release.
💬 Fed parade continues: Bostic, Miran, and Waller keep rate-cut expectations in focus ahead of Thursday’s data risk.
⚠️ Shutdown overhang: Broader data (CPI/PPI/Retail) still paused — traders key off qualitative signals like Beige Book tone.
📊 Key Data & Events (ET)
⏰ 🚩 8:30 AM — Empire State Manufacturing Survey (Oct)
⏰ 12:10 PM — Raphael Bostic (Atlanta Fed) speech
⏰ 12:30 PM — Stephen Miran (Fed Gov) speech
⏰ 1:00 PM — Christopher Waller (Fed Gov) speech
⏰ 🚩 2:00 PM — Fed Beige Book
⚠️ Note: Shutdown continues to delay most federal data releases. Beige Book offers the only official economic snapshot this week — high read-through for inflation, wages, and business conditions.
⚠️ Disclaimer: Educational / informational only — not financial advice.
📌 #trading #stockmarket #SPY #SPX #Fed #BeigeBook #EmpireState #Waller #Bostic #Miran #bonds #yields #inflation #shutdown #economy
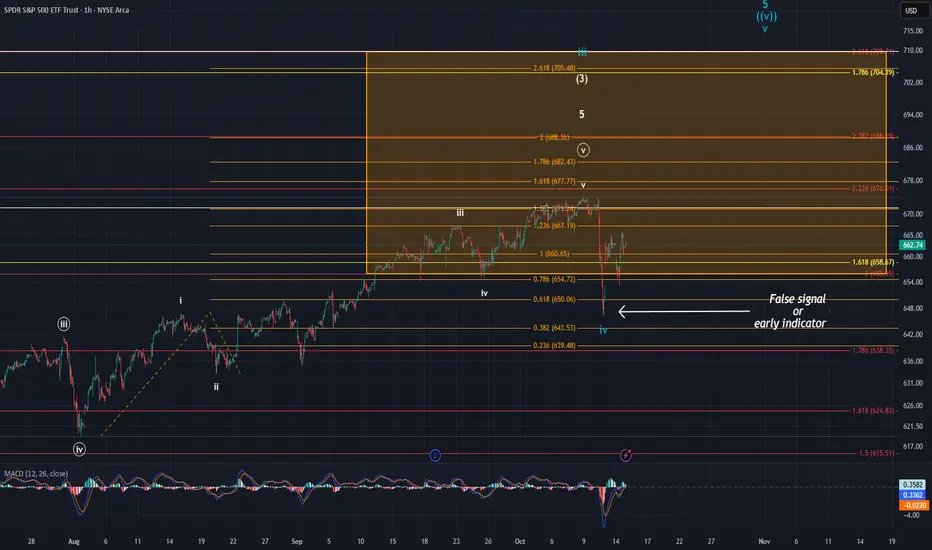
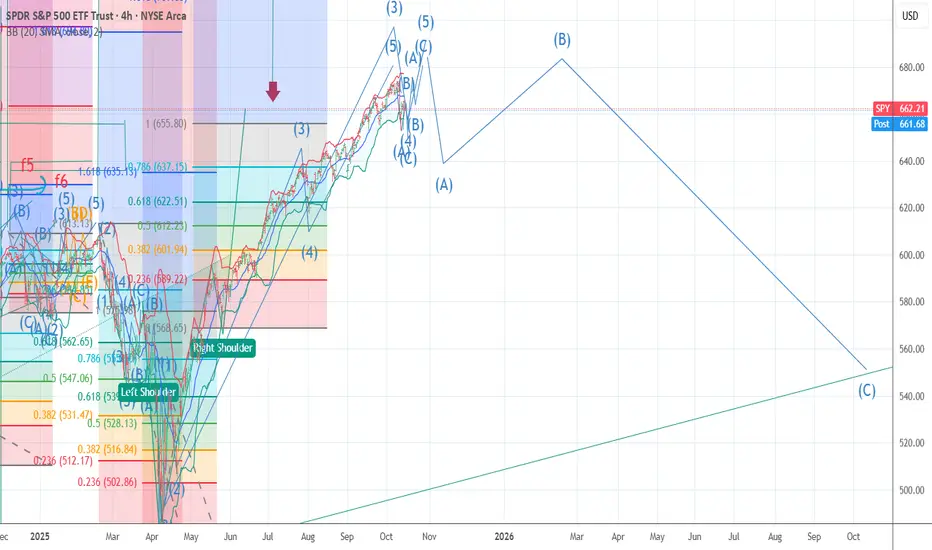
SPYThere is a lot to unpack with SPY. We have been searching for the intermediate wave (3) for some time now. The drop on Friday is what complicated things. I was originally thinking that we needed another wave iv and v to finish off this move higher. In the SPY ETF, however, the drop in price overlapped the wave i high made on 15 August. This would obviously rule out another high being made and would suggest that wave (4) kicked off pointing us lower. When you look at the SPX & ES though, price did not overlap with the wave i high. SPY is a derivative of the S&P and could be sending a false signal. On the flip side of that, it could be an early indicator that the SPX will only get a slight high before kicking off wave (4).
The simplest way I can explain this, is the overlap in SPY could potentially be looked at like an error. If this is the case, then the turquoise labeling on the chart should come to pass and we should ideally see price target the $680 - $710 area. If it is an early indicator that the SPX is all but done, it may not get another high and begin moving lower very soon.
I fall on the false signal side of things personally. I think price is destined to hit the $705-$710 price range to cap off the wave (3). However, every chart stands on their own, and the overlap cannot and should not be overlook and outright dismissed. Time will tell, but either way, I believe this larger move higher is nearing an end.
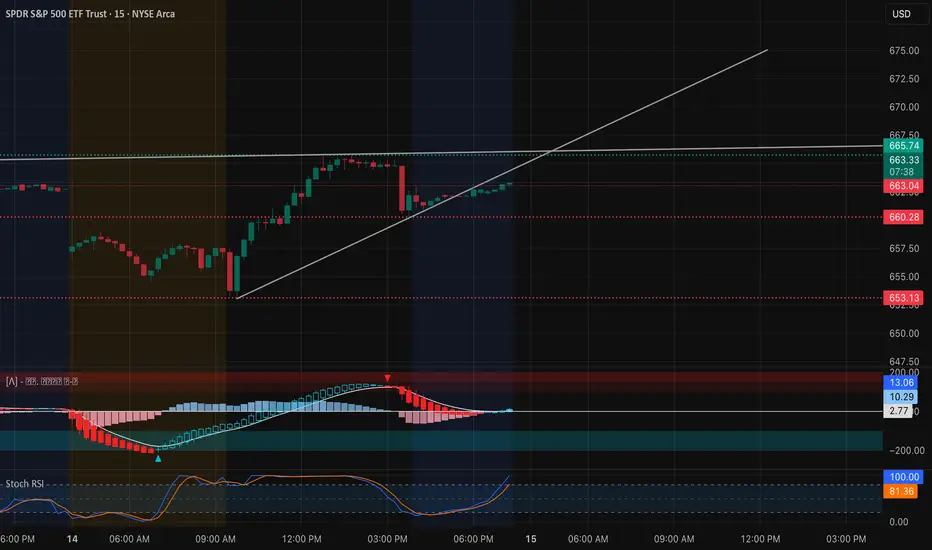
SPY: Key Inflection Point — Bulls or a Trap Ahead?SPY had a clean bullish run early today with consecutive CHoCH → BOS confirmations, pushing toward 665–667 before sellers reacted sharply. That rejection created a fresh CHoCH to the downside while price is now retesting the broken structure near 663–665. The ascending trendline from the morning impulse is still intact, but momentum is fading. MACD histogram shows weakening bullish pressure with a soft cross, and Stoch RSI has cooled from overbought. This suggests indecision before the next leg.
If SPY fails to reclaim 665.7, expect another CHoCH down targeting 660.3 to 658.9.
On the 1-hour chart, we’re seeing a classic compression pattern between 662 and 666. Bulls tried to break 666 twice but met rejection near the 2nd and 3rd Call Walls (670). Volume dropped on each push, confirming supply above. If price loses 662–660, the next liquidity pocket sits near 657 (the highest negative Net GEX zone). Conversely, a clean hourly close above 666 opens 670–672.5 for a possible short squeeze.
GEX and Options Sentiment
The options data reinforces the chart story.
Call walls cluster at 665 and 670, while put walls sit at 660 and 657. GEX remains negative, and dealers appear short gamma below 662 — meaning volatility could expand sharply if price dips.
The Options Oscillator shows PUTs at roughly 103% and IVR around 23%, which indicates hedging and caution heading into macro catalysts.
Dealer positioning hints at a neutral-to-bearish bias unless SPY reclaims 666+ with strength. Below 662, PUT delta hedging could accelerate selling toward 657–655.
Intraday Trading Thoughts
Bullish plan:
If SPY reclaims 665.8 with volume, ride the move toward 667.5–670. Stop below 662.8. Favor short-dated CALLs (0DTE or 1DTE) with momentum confluence.
Bearish plan:
If price breaks and retests 661.8, aim for 658.9 → 657 → 653.1. Stop above 665.5. PUTs with 660 strike for 1DTE or 2DTE fit the structure.
Neutral idea:
If volatility stays muted, an iron condor or credit spread between 660–670 could work, taking advantage of low IVR and likely chop.
Key Context
670–672 is the extreme bullish gamma zone that could trigger a squeeze if volume floods in.
666–667.5 remains the main decision level where either side could take control.
662–660 acts as a pivot — lose it, and momentum flips bearish fast.
657–655 is the magnet if downside accelerates, aligning with deep negative GEX and dealer hedging pressure.
Outlook for Tomorrow
SPY is coiled tightly between 662–666. If we open above 663 and hold over 665 with MACD flipping green again, bulls could attempt a push toward 670. However, another rejection at 665–666 with a CHoCH down on the 15-minute is a clear PUT setup — especially with negative GEX tilt below 662. Expect volatility spikes around 10 a.m. ET when direction confirms.
💬 If you want me to TA any stock I don’t regularly post, DM me and I’ll give it the same deep multi-timeframe + GEX treatment.
Disclaimer: This analysis is for educational purposes only and not financial advice. Trade responsibly and manage your risk.
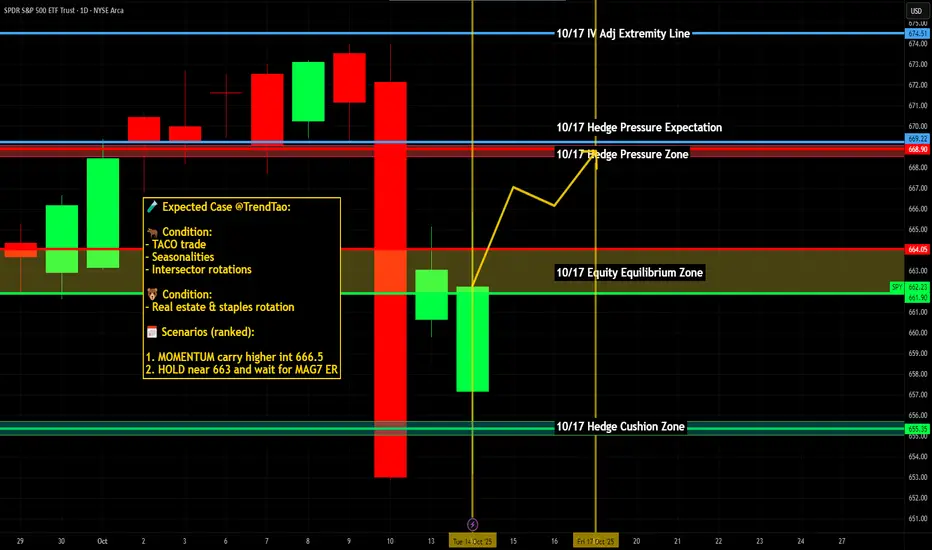
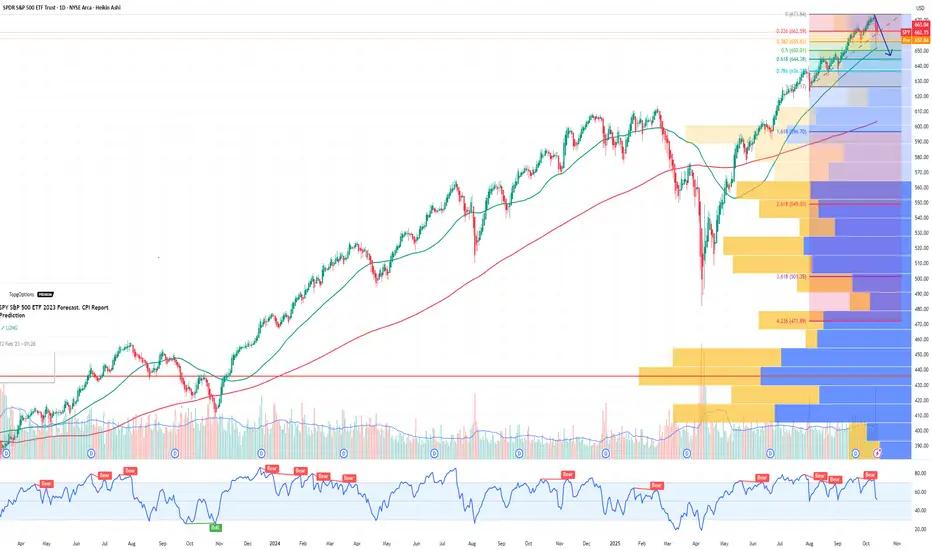
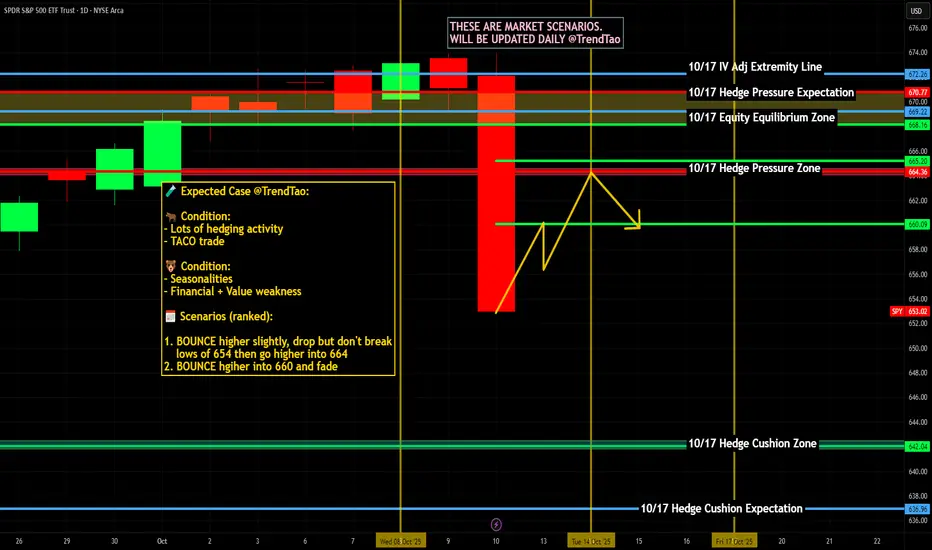
Time for the UPDATE form only !! Well it is time to upload my view since the April 7 low for wave 4 . As most know back on april 7 t=when we were at 4835 I called the bottom is in , the drop of 1312 sp points matched the 2022 drop in wave 2 and that the drop on a PCT basis was exactly .786 as well . I have also stated that this top will be similar to 11/29 /12/6 to 2/18/19 topping so far so good . the low at 6551 was .618 of wave 2 and now we have a e 3 wave rally in the form of an ABC up into .618 . . i think we will see a new record rather soon . in fact odds are high by friday close. but I see rotation and still see the mag 7 leading us into that last pop . I have traded in and out and made some ok $ . . I will now tell you they are going to look to chop up alot of traders in the next 2 weeks .
Warning Signs Flashing: SPY May Plunge After Earnings SeasonAfter the recent rollercoaster in equities and crypto, markets are entering a critical period: earnings season. While the initial rebound after last Friday’s selloff has restored some optimism, the broader picture suggests potential downside for SPY in the weeks ahead.
Earnings Season: A Stress Test for Stocks
The third-quarter earnings season kicks off with major banks and tech companies reporting this week. Expectations are high: analysts project around 8% EPS growth for S&P 500 constituents.
However, several factors indicate that this season could reveal underlying weaknesses:
High expectations and valuation pressure – Companies that fail to meet earnings or guidance could see outsized declines, creating ripple effects across the index.
Sectoral stress – Technology, finance, and industrials are exposed to higher input costs, slowing consumer demand, and margin compression. Misses in these sectors often drive SPY lower more than average.
Macro headwinds – High interest rates, slowing GDP growth, and trade tensions with China could exacerbate negative reactions.
Historically, SPY tends to be vulnerable after earnings seasons that reveal cracks in corporate performance, especially when macro uncertainty is elevated.
Geopolitical and Macroeconomic Pressures
Trade tensions: The U.S.-China conflict over rare earth metals and tariffs adds uncertainty to corporate supply chains. Even if earnings beat expectations, investor sentiment can remain fragile.
Recession risk: Economists from J.P. Morgan and S&P Global highlight a 30–40% chance of a U.S. recession by year-end 2025. Weak economic indicators can amplify post-earnings selloffs.
Volatility spikes: The VIX has started creeping higher after last week’s recovery, signaling that investors are hedging against downside risks. Historically, spikes in VIX correlate with short-term SPY declines.
Conclusion: Post-Earnings Risk for SPY
Traders and investors should watch for:
Missed earnings or cautious guidance from major banks and tech companies.
Rising VIX and fear-driven flows into protective options.
Breaks of critical technical support levels in SPY.
In this environment, positioning for a modest correction or increased volatility in SPY could be prudent until the earnings season clears and market sentiment stabilizes.
$SPY / $SPX Scenarios — Tuesday, Oct 14, 2025🔮 AMEX:SPY / SP:SPX Scenarios — Tuesday, Oct 14, 2025 🔮
🌍 Market-Moving Headlines
🚩 Powell returns: The Fed Chair’s midday remarks anchor Tuesday — traders watch tone shifts after a light Columbus Day tape.
💬 Fed-heavy lineup: Bowman, Waller, and Collins fill out the day — policymaker divergence could move yields and risk assets.
📈 Small biz sentiment: NFIB optimism opens the day, giving early insight into Main Street labor and inflation pressures.
⚠️ Shutdown overhang: Broader data flow still limited — markets key off Fed speak and earnings momentum.
📊 Key Data & Events (ET)
⏰ 6:00 AM — NFIB Small Business Optimism (Sept)
⏰ 8:45 AM — Michelle Bowman (Fed Gov) speech
⏰ 🚩 12:20 PM — Fed Chair Jerome Powell speech
⏰ 3:25 PM — Christopher Waller (Fed Gov) speech
⏰ 3:30 PM — Susan Collins (Boston Fed) speech
⚠️ Note: No high-tier macro data releases due to shutdown effects — Fed communication and earnings dominate the tape.
⚠️ Disclaimer: Educational / informational only — not financial advice.
📌 #trading #stockmarket #SPY #SPX #Powell #Fed #Waller #Bowman #Collins #NFIB #yields #bonds #shutdown #economy #megacaps
SPY 2010 Flash CrashJust for peoples reference, on May 6, 2010 there was a flash crash. The dynamics may be helpful for today.

$SPY over $700 in the next ~2 weeks? A 9% move from low?Now that the downside target in SPY hit last week, I think it's time for the blow off top to take place.
I favor a move from here that brings us to the two upper resistance levels.
The next key date that I have on the chart is October 27th, as of now, I think it's possible that we see at least one of the two levels to the upside get hit prior to that for a final move in SPY.
The marked box is the resistance level and I don't really see price exceeding those levels.
If those levels are tagged, then I think that sets up a move lower to the bottom supports, but let's focus on the upside first.
The Market Crash Friday was NOT what you have been told.The stock market crash was blamed on many things but NONE are true.
The reason why the stock market had a huge run down on Friday was due to
a VOID of BUYERS.
Who were the buyers???
You will never guess.
It was the 436 of the SP 500 companies that have buybacks underway, newly created, or open ended. Corporations have been supporting their own individual stock price.
WHY? To maintain their Market Cap during stressed market times.
To improve their dividend yield for the Buy Side Institutions who many 145 trillion dollars of assets and who own the bulk of those companies stock.
To keep their stock from dropping further on retail news.
Why did the corporations stop buying their stock on Friday?
Because the Earnings Season is getting underway this week and they stop buybacks to avoid a conflict of interest or other regulatory situations from buyin back shares during or before their CEO reports.
The corporations are likely to resume their accumulation a week or so after their CEO guidance and reports.

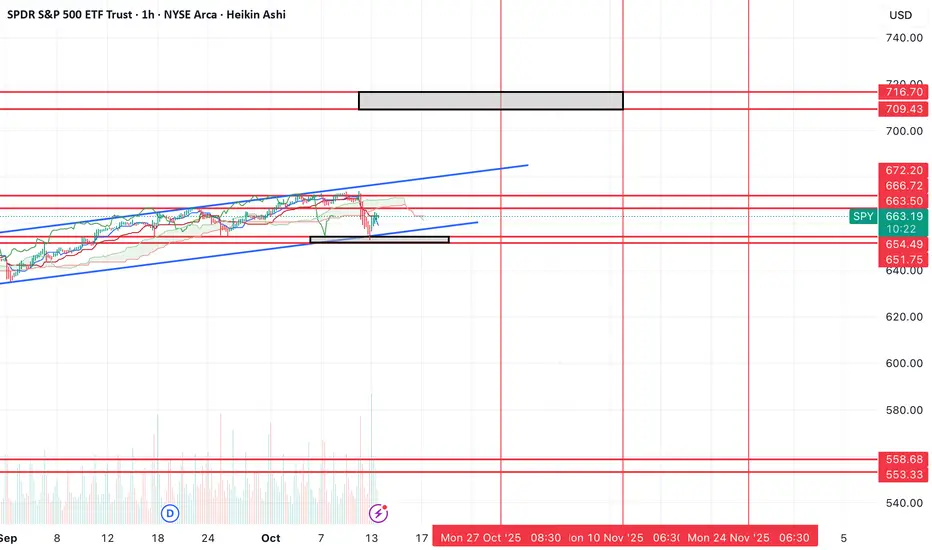
Cash is a positionSPY looks like it may test it's 18ma at 665, if it gets over the 18ma again - it's bullish. There may be some false downmoves before a further upmove, so you have to be careful either way. Gold may be topping very soon.

Solver RetracTORSolver retractor with levels indicatored on the chart with levels indicated by lines of gold indicating plays fo old boys brought down to Earth little this week we did to share our ideas with the fool traders who analyze the validity of these posts like hounds to the scoundrel's den.
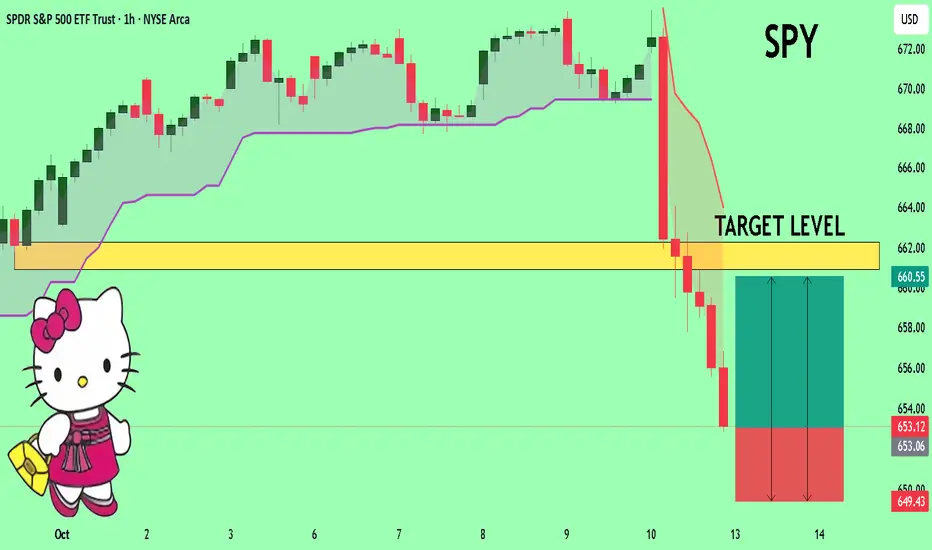
SPY Bounce or Bull Trap? Monday’s Trendline Decides Oct. 13SPY Oversold Bounce or Just Another Trap? Watch This Trendline Monday
Friday’s session was brutal — SPY sank nearly 3%, printing a full-day liquidation move after the volatility spike tied to the tariff shock. But after hours, something interesting happened: buyers finally showed up around the $650 zone, a level that matches both key technical and gamma support.
Heading into Monday, the market sits at an inflection point. Let’s look at the 15-minute structure for intraday momentum and the 1-hour GEX map for broader positioning clues.
15-Minute Intraday Technical View
SPY has been stuck in a clean descending channel, printing lower highs and lower lows for three straight sessions. But the 15-minute chart shows early signs that the selling pressure is slowing down.
The MACD histogram flipped from red to light blue, hinting at a loss of bearish momentum. Meanwhile, Stoch RSI has curled back up sharply from the oversold zone near 20, pushing toward 80 — a signal of short-term strength returning.
Right now, the key battle zone is the 655–657 trendline area. If SPY breaks and closes above it, that would confirm a mini intraday reversal setup. Above that, potential targets are 661, 666, and 673, where the upper trendline and prior liquidity pockets sit.
But if SPY fails at the trendline and rejects under 652, the next leg down could test 646–642, which is the deeper gamma and liquidity floor from Friday’s crash.
Scalp bias:
* Long above 657 → target 666–670 (gap-fill zone).
* Short below 652 → target 646–642 (continuation leg).
The structure suggests that Monday’s open will likely start with a volatility-driven reaction — expect either a strong bounce into resistance or a failed retest that sets up a fresh low.
1-Hour GEX Analysis — Options Sentiment
This is where things get tactical.
Friday’s selloff drove SPY into deep negative gamma, which forces market makers to sell into weakness. The HVL (Highest Volatility Line) sits around 660, making it the key pivot where volatility could begin to unwind if reclaimed.
Below that, there’s a cluster of Put Walls between 651 and 646, marking heavy hedging zones — this aligns perfectly with Friday’s low and the current support region. That area is the line in the sand for bulls.
Above, Call Walls start showing up around 674–680, which represent dealer resistance and likely gamma caps if the market tries to squeeze higher.
IVR sits at 28.7, and IVX is around 21.2, meaning volatility remains elevated but could compress quickly on a bounce. Put positioning (115.5%) is still extreme, suggesting sentiment is deeply bearish — and when positioning gets this lopsided, snapback rallies often follow.
If SPY closes above 660, dealers begin to unwind shorts, potentially fueling a relief rally toward 670+. But a failure to hold above 652 keeps the gamma pressure active, and new lows could form near 642.
My Thoughts and Trade Ideas
The market looks oversold, but not yet safe. SPY is trapped between heavy Put hedging below and resistance gamma above. The risk/reward favors a tactical bounce as long as 652 holds — but traders should treat it as a scalp, not a swing, until volatility confirms a reversal.
For intraday scalpers:
* Long bias: watch for reclaim above 657 with volume — aim for 666–670.
* Bearish continuation: rejection at trendline + VIX > 22 = retest of 646.
For option traders:
* Short-term recovery setup: 660C or 670C, tight expiration (if SPY stabilizes above 657).
* Hedge setup: 650P or 645P, if the market shows risk-off continuation.
This is a “reaction” day, not prediction day — momentum will decide direction early in the session.
Final Take
SPY is sitting right on top of a major volatility floor, where both technicals and options data align. The downside looks stretched, but a weak open could still shake out more stops before any recovery.
Above 657 = relief rally potential.
Below 652 = another leg of pain.
Watch volatility — it’ll tell you which side wins.
Disclaimer: This analysis is for educational purposes only and not financial advice. Always trade your plan and manage your risk carefully.

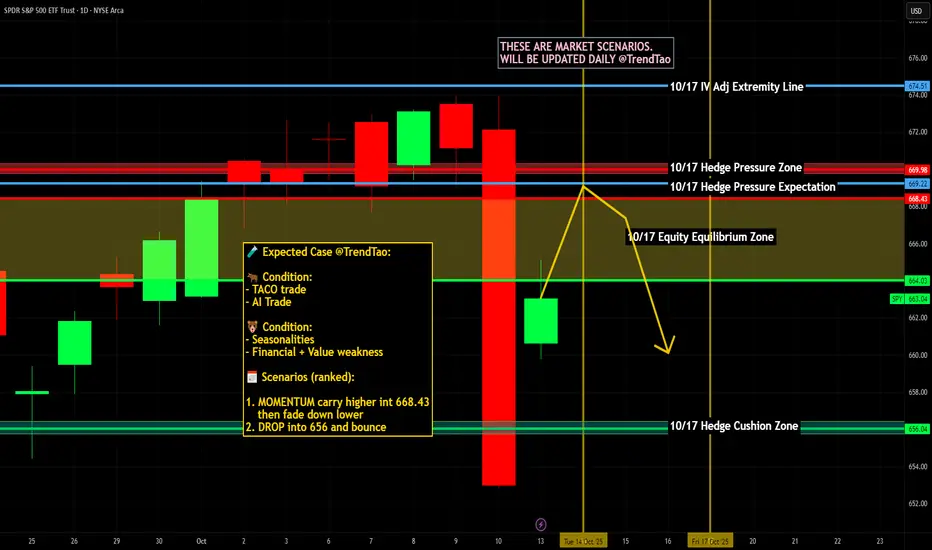
$SPY / $SPX Scenarios — Week of Oct 13–17, 2025🔮 AMEX:SPY / SP:SPX Scenarios — Week of Oct 13–17, 2025 🔮
🌍 Market-Moving Headlines
🚩 Inflation-heavy week: PPI, Retail Sales, and Industrial Production headline the macro slate — but several may be ⚠️subject to delay due to the shutdown.
💬 Fed circuit overload: 10+ Fed speakers including Bowman, Waller, Bostic, Barkin, and Miran — tone-watching replaces missing data.
📉 Consumer & housing pulse: Retail Sales, Homebuilder Confidence, and Housing Starts offer critical insight into demand — if they post on time.
💻 Earnings meets macro: Early Q3 results from banks + big tech guide sentiment alongside muted macro signals.
📊 Key Data & Events (ET)
📅 Mon, Oct 13 — Columbus Day 🇺🇸 (Bond Market Closed)
⏰ 12:55 PM — Anna Paulson (Philadelphia Fed) speaks
📅 Tue, Oct 14
⏰ 6:00 AM — NFIB Small Business Optimism (Sept)
⏰ 8:45 AM — Michelle Bowman (Fed Gov) speech
⏰ 3:25 PM — Christopher Waller (Fed Gov) speech
⏰ 3:30 PM — Susan Collins (Boston Fed) speech
📅 Wed, Oct 15
⏰ 🚩 8:30 AM — Empire State Manufacturing Survey (Oct)
⏰ 12:10 PM — Raphael Bostic (Atlanta Fed) speech
⏰ 12:30 PM — Stephen Miran (Fed Gov) speech
⏰ 1:00 PM — Christopher Waller (Fed Gov) speech
⏰ 🚩 2:00 PM — Fed Beige Book
📅 Thu, Oct 16
⏰ 🚩 8:30 AM — Retail Sales (Sept) — ⚠️ May be delayed due to shutdown
⏰ 🚩 8:30 AM — Producer Price Index (PPI, Sept) — ⚠️ May be delayed
⏰ 🚩 8:30 AM — Initial Jobless Claims (Oct 11) — ⚠️ At risk of delay
⏰ 9:00 AM — Waller & Miran (Fed Govs) speeches
⏰ 10:00 AM — Homebuilder Confidence (Oct)
⏰ 10:00 AM — Michelle Bowman (Fed Gov) remarks
⏰ 12:45 PM / 4:30 PM — Tom Barkin (Richmond Fed) speeches
📅 Fri, Oct 17
⏰ 🚩 8:30 AM — Housing Starts / Building Permits (Sept) — ⚠️ Possible delay
⏰ 8:30 AM — Import Price Index (Sept) — ⚠️ Possible delay
⏰ 🚩 9:15 AM — Industrial Production & Capacity Utilization (Sept) — ⚠️ Possible delay
⚠️ Shutdown Watch:
Several economic reports (Retail Sales, PPI, Jobless Claims, Housing, Industrial Production) depend on agencies like the Census Bureau, BLS, and BEA — if the shutdown persists, these will be postponed until government funding resumes.
Expect headline-driven trading, Fed-speak sensitivity, and lighter macro liquidity through the week.
⚠️ Disclaimer: Educational / informational only — not financial advice.
📌 #trading #stockmarket #SPY #SPX #Fed #Powell #Bowman #Waller #Bostic #Barkin #Miran #RetailSales #PPI #BeigeBook #inflation #bonds #shutdown #economy #housing #earnings #macro
SPY: Bullish Continuation & Long Trade
SPY
- Classic bullish formation
- Our team expects growth
SUGGESTED TRADE:
Swing Trade
Buy SPY
Entry Level - 653.12
Sl - 649.92
Tp - 659.88
Our Risk - 1%
Start protection of your profits from lower levels
Disclosure: I am part of Trade Nation's Influencer program and receive a monthly fee for using their TradingView charts in my analysis.
❤️ Please, support our work with like & comment! ❤️

SPY: Week of Oct 13Just an update on my thoughts,
Mostly focusing around the break of the BMTL and what to expect with those types of breaks.
Hope you find it helpful!
As always, safe trades and take care!

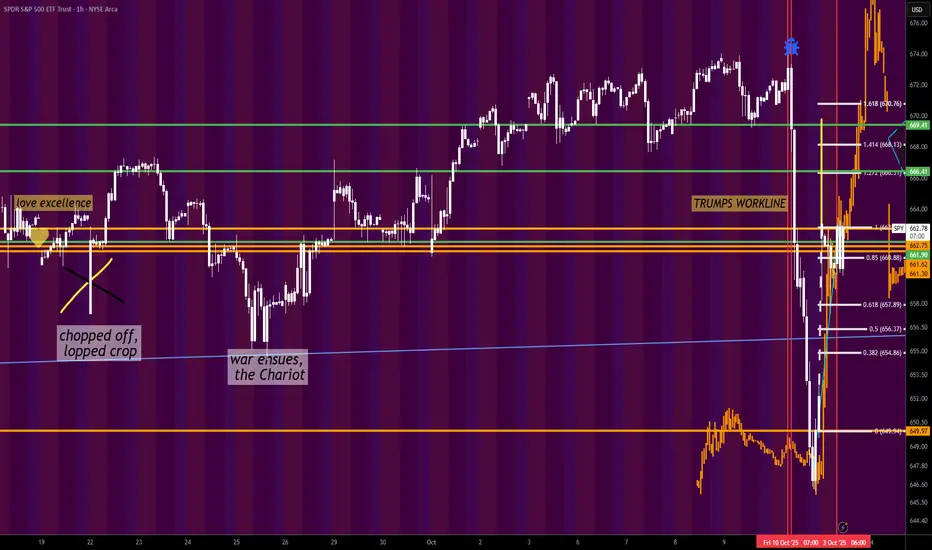
Follow up to my previous post on SPY potential support levelsSPY Technical Analysis — Elliott Wave & Fibonacci Structure
After failing to hold at two key support levels highlighted in the previous update, SPY finally found a temporary bounce at the 0.50 Fibonacci retracement level around 646.84. This aligns with a common Wave 4 retracement bounce zone after an aggressive Wave 3 move down.
1. Wave Structure
The current bounce appears corrective in nature and is likely forming Wave 4 (up) within the broader downtrend.
I do not view this bounce as a full reversal yet — price action still favors a final Wave 5 leg lower.
Ideally, Wave 5 could form a double bottom near the 0.50 Fib level (646.84), providing a potential base-building zone.
2. Key Levels to Watch
🟡 0.50 Fib (646.84) — current bounce zone; potential double-bottom target.
0.618 Fib (640.39) — next critical support if 0.50 fails. A break here may prolong the corrective structure.
⚫ 0.786 Fib (631.21) — deeper retracement zone. There’s a supply zone just above this level (see grey box on chart), which may offer initial demand or reaction.
3.Scenario Planning
If 646.84 holds and price consolidates, a short-term bullish structure could form, but any upside is likely corrective.
If 646.84 fails, the 0.618 level becomes pivotal. Breaking this area may push price into the grey supply zone near 0.786.
My preferred setup in this scenario would be to wait for a clean reaction at the grey zone:
Look for a bounce ➝ retrace ➝ breakout above the bounce high to signal a potential long entry.
Stop-loss placement would likely be just below 0.786 Fib (631.21) to reduce downside exposure.
4. Macro Consideration
Headline risk remains — any unexpected bullish catalyst (e.g., political or macroeconomic news, such as statements from Donald Trump) could accelerate or truncate the Wave 4–5 structure. A short squeeze from oversold levels is also possible but would need confirmation.

$SPY - Pullback for the S&PA pullback looks likely, but it’s still within a bullish structure. Unless SPY breaks below 600 with heavy volume, it’s more of a buy-the-dip scenario than a trend reversal but we definitely hit resistance at the top of this channel.

SPY The Target Is UP! BUY!
My dear followers,
I analysed this chart on SPY and concluded the following:
The market is trading on 653.12 pivot level.
Bias - Bullish
Technical Indicators: Both Super Trend & Pivot HL indicate a highly probable Bullish continuation.
Target - 660.90
Safe Stop Loss - 649.43
About Used Indicators:
A super-trend indicator is plotted on either above or below the closing price to signal a buy or sell. The indicator changes color, based on whether or not you should be buying. If the super-trend indicator moves below the closing price, the indicator turns green, and it signals an entry point or points to buy.
Disclosure: I am part of Trade Nation's Influencer program and receive a monthly fee for using their TradingView charts in my analysis.
———————————
WISH YOU ALL LUCK
All Conditions for a Short Are in PlaceIt’s good to have the weekend to think everything through and make a decision calmly.
Shorting a rising market is usually a bad idea — I’ve tried before, and it’s only natural that my stop losses got hit.
On Friday, I was watching the market. Without going deep into the political background — I’m sure you’ve read the same things — I’ll sum it up in one word: negative.
To this, we can add overall overheating.
The way the market sold off that day doesn’t look like the end of the decline — although, of course, anything can happen. I believe that right now is the perfect moment to open a short position on the S&P 500 at the market open .
The stop will be wide — not pleasant, of course, if it gets hit again — but I feel that all conditions have aligned for a short setup.
My target is 640 — a strong resistance level, still about 2% away. I’ll be watching closely around that zone.
A move below 640 will open the path toward 595–605 , where I plan to start closing positions — possibly even earlier, depending on how price reacts to that key 640 level.
There are too many long positions in the market now; so far, we’ve only seen margin positions being liquidated. I think Monday might start with closing out long positions.
Either way, we’ll see at the open — but for now, I’ve outlined my plan and I intend to stick to it.

Trump tariff was as a cover.Look at SPDR CME gaps it was one open and it wicked exactly to it. They used Trump tariff was as a cover.

SPY is approaching resistance. major yearly fib projection. Something to watch in coming weeks. Could pump into this in the coming weeks. I wont short, but it is a huge area of interest.

Spy ideas Going long here because rsi is too oversold . If this keeps going lower would double down down calls at 640 but I think the market recovers next week
