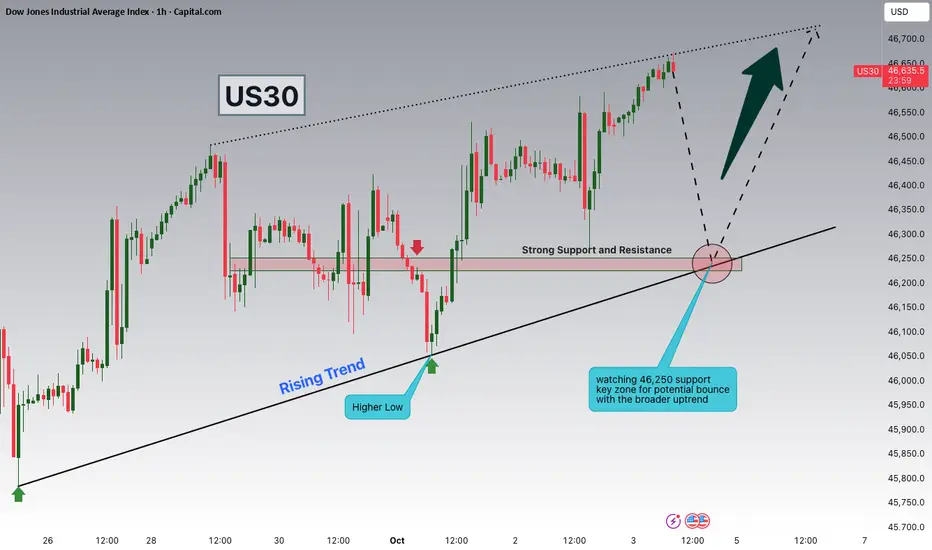
Dow Jones Watching 46,250 Support for Potential ContinuationHey Traders, in today’s trading session we are monitoring US30 for a potential buying opportunity around the 46,250 zone. The Dow Jones is trading in an uptrend and currently in a correction phase, with price moving toward this key support/resistance level.
Structure: The broader trend remains bullish, with pullbacks serving as corrections within the uptrend.
Key level in focus: 46,250 — an important support zone where price could stabilize and attract buyers.
Next move: Holding above 46,250 could open the door for continuation toward higher highs, while a breakdown would suggest a deeper retracement.
Trade safe,
Joe.
US30 trade ideas
DOW JONES GENERATIONAL TOPI believe total collapse is imminent. Not to be spreading panic, but the times we live in rhyme almost perfectly with historical moments like the Great Depression or WW2, while on the same time huge global debt ( over 200% of global GDP ), demographics, policies and geopolitical tensions lead to the conclusion that a historical turning point may has arrived, and it is probably time for financial markets to revert back, not just to a fair value, but to a real discounted value.

$us30Dirty 30….
She’s hunting $46,900+
Layered in as and willing to go $46,606 which holds key to pricing a long or short!!!
Let’s get it!!!!

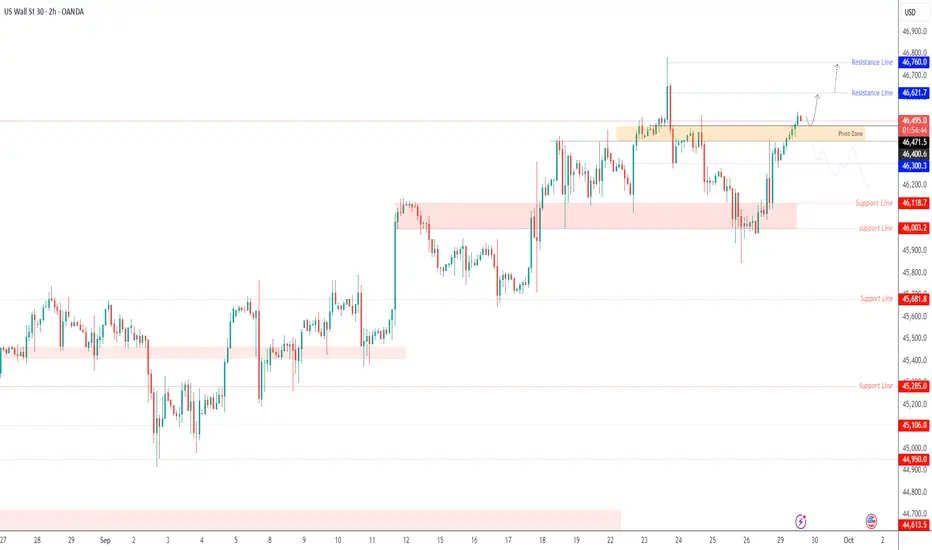
US30 – Bullish Above 46,470 as Fed Comments and Shutdown Risks US30 – Overview
U.S. index futures started the week firmer as investors await remarks from Fed policymakers and monitor the ongoing government shutdown risk, which could delay key economic data and impact Fed rate-cut expectations.
Technically, US30 maintains bullish momentum after stabilizing above the 46,470 pivot zone.
A sustained move above 46,620 would open the way toward 46,760, with a possible extension to 46,900 if broader U.S. indices continue to firm.
However, a break below 46,400 would weaken sentiment and expose 46,300 and 46,120 as the next supports.
Pivot: 46,470
Resistance: 46,620 – 46,760 – 46,900
Support: 46,400 – 46,300 – 46,120
Are you still ready to buy the American market?After working as an analyst for nearly 20 years, I have noticed a clear trend of recovery in all drawdowns in the US market. Money does make money, and the printing press can fill all corrections.
Will it always be like this?
It was this question that made me analyze in more detail the charts of the American indices - DJI and DJT.In fact, you can connect a larger data spector here, including the dynamics of the S&P, the S&P Small Cap 600 index, the S&P Mid Cap 400, index and the Value Line Composite index (geometric) and see the same situations.
I'll add some of them to the graph for clarity.As you can see, there are discrepancies between the charts, which are called intermarket divergences. However, the Dow theory has its own reasons for this.
1. According to the Dow theory, signals about the current trend and trend reversal should be confirmed by both indexes. This statement applies to the Dow Jones Industrial Average and the Dow Jones Transportation Average.
2. At the same time, there may be some discrepancy in the timing of the signals, that is, one of the indices may signal a trend change earlier than the other.
What do you see on the chart?
Personally, I see a notable contradiction. While the industrial index has reached new all-time highs, the transportation index is trading significantly below them. The Value Line Composite Index (geometric) shows a similar picture. That is, we have an non confirmation of the strength of growth and strength of buyers, which is a bad signal!
And no, I'm not saying that you need to sell urgently, but you need to understand that the market is in the final phase of its long-term growth. And a reversal towards the bearish phase is just around the corner.
It is enough to look at the waves to understand that we are already sitting in the last carriage of the train, which is ready to start reversing.In addition, inside wave 5, we had a stretch in the subwave (1), which means that the subwaves (3) and (5) cannot continue stretching.
Wave (1)=18465.79 points, wave (3)=16357.78 points, which means (1)>(3)>(5), then the movement in the basement (5) is limited to the level of 52969.5 points, before reaching it, the market should already begin to show signs of a downward reversal.
At the same time, the 5th waves often give a truncation and already now the subwave (5) = 0.5 of the length (1). The growth may end prematurely if condition (5) is fulfilled=0.618 from (1) or (5)=0.764 from (1).
PS All extremes are usually formed either on euphoria or on general optimism.
Are you still an optimist?

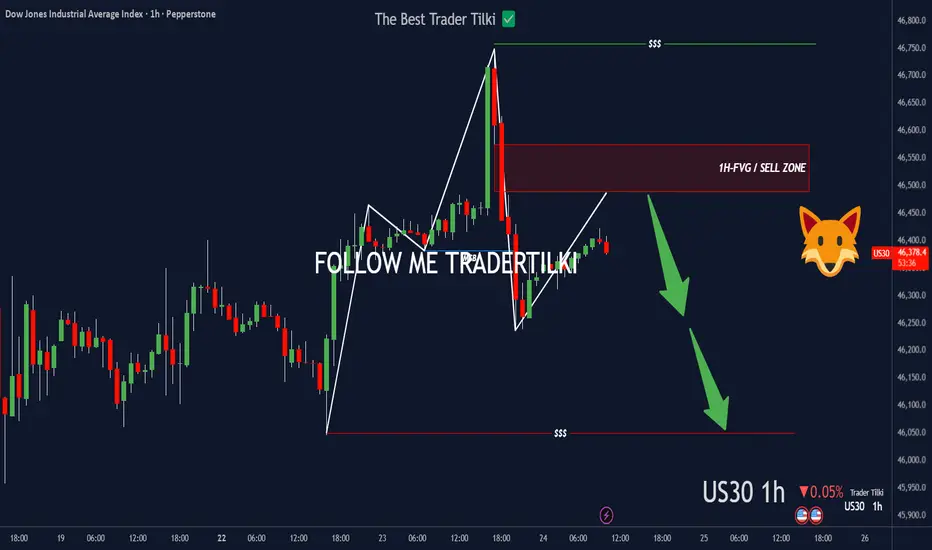
US30 left a footprint—FVG’s callin’.Hey Guys,
Once US30 hits my SELL zone, I’m pulling the trigger—targeting 46049.0
• Entry: 46574.5.0 or 46488.9
Set the stop point according to your own margin, my friends.
Every like you drop pushes me to share more setups like this. Big thanks to everyone showing support!
DOW JONES Can the 4H MA100 initiate a comeback??Dow Jones (DJI) has been trading within a 2-month Channel Up and today touched its 4H MA100 (green trend-line) for a second time after September 25.
Both in terms of price and 4H RSI action, this sequence is similar to the September 02 rebound fractal, which also following a Bull Flag, it touched the 4H MA100 for a 2nd time and then moved on to a rally that peaked on the 1.5 Fibonacci extension.
The 1.5 Fib ext also priced the Higher High of the first Bullish Leg of the pattern, thus offers currently the highest probability for our next Higher High. Our long Target is slightly below it at 47000, representing a +2.80% rise from the recent Low.
-------------------------------------------------------------------------------
** Please LIKE 👍, FOLLOW ✅, SHARE 🙌 and COMMENT ✍ if you enjoy this idea! Also share your ideas and charts in the comments section below! This is best way to keep it relevant, support us, keep the content here free and allow the idea to reach as many people as possible. **
-------------------------------------------------------------------------------
💸💸💸💸💸💸
👇 👇 👇 👇 👇 👇

US30 -Bullish Bias🔹 Pair: US30
🔹 HTF Overview: Structure bullish; market momentum favors the upside.
🔹 MTF Outlook: Waiting for a deep sweep of stop-losses (SSL) to refine continuation setup.
🔹 LTF Setup: Once SSL is taken, drop to lower timeframe for CHoCH confirmation and precise entries.
🔹 Targets: Mid- to long-term highs, aligned with bullish structure and liquidity zones.
🔹 Mindset Note: Patience is key—let smart money lead before committing.

US30 - TRADER EDGE💎 Diamond Difference Maker:
Everyone sees the same chart, but only those who read the full breakdown see the edge.
The complete setup is served on a silver platter - you still have to pick up the fork -
Take action and apply your own special skills, insight, and adaptability with ever-changing markets.
🎯 KEY PIVOT ZONE
SUPPLY ZONE: 46,400 - 46,500
Heavy volume concentration at VRVP node around 46,450
Multiple session POCs aligning in upper range
Major resistance showing institutional distribution
📊 PRICE TARGETS
UPSIDE TARGETS ⬆️
T1: 46,400 - 46,500 (Primary supply test)
T2: 46,600 - 46,700 (Higher resistance node)
DOWNSIDE TARGETS ⬇️
T1: 46,000 - 46,100 (Support POC cluster)
T2: 45,800 - 45,900 (Lower volume concentration)
⚡⚡ EDGE - HIGHEST PROBABILITY PLAY
Short from 46,400-46,500 supply rejection for move to 46,000-46,100
🔍 KEY CONFIRMATION SIGNALS
✅ Rejection at 46,400-46,500 with increased volume
✅ Break below 46,200 current support level
✅ Session POCs providing dynamic resistance on rallies
📈 TRADE SETUP
🔴PRIMARY BIAS: BEARISH
Short Setup:
Entry: 46,400 - 46,500 (on supply zone rejection)
Stop Loss: 46,550 (above supply invalidation)
Target 1: 46,000 - 46,100
Target 2: 45,800 - 45,900
Risk/Reward: 1:3
🔄 BIAS FLIP CONDITIONS
🟢TURNS BULLISH IF:
Break and hold above 46,550 with strong volume
Reclaim 46,400-46,500 as support on retest
POCs start acting as support levels
⚡Then Target:
46,700 - 46,800 (next resistance cluster)
46,900 - 47,000 (higher volume node)
⚠️ RISK MANAGEMENT
Max Risk: 250 points per position
Position Size: Risk 1-2% of account per trade
Time Stop: Close before major news or market close

Is the Dow Jones still bullish? Yes.
Hello everyone
I think Dow Jones has the potential to grow further and if the conditions set in the figure below are met, it can be said that it can easily reach the set target. What do you think, friend? Leave me a comment

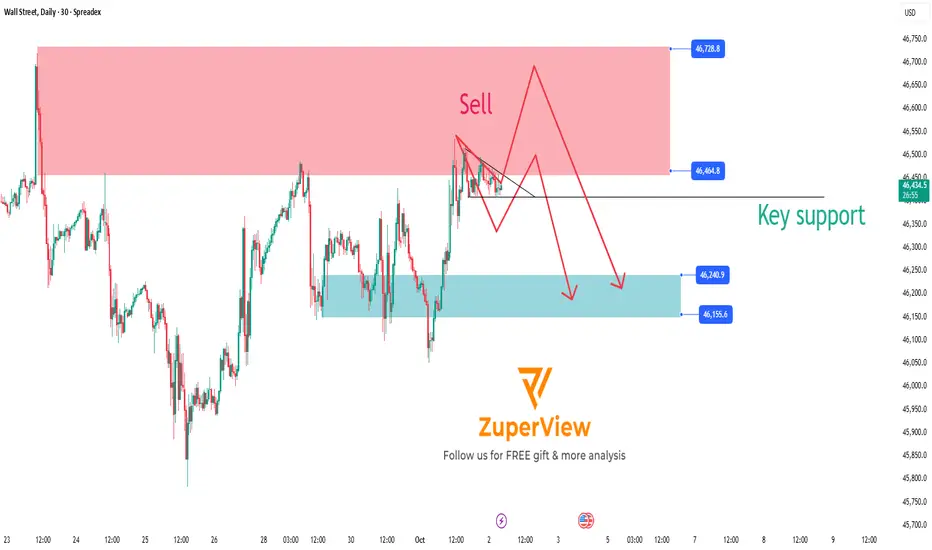
US30: Key support breakdown signals potential sell opportunity
1. Current Market Overview 🌐
The SPREADEX:DJI index is approaching a significant resistance zone where selling pressure is expected to be strong. The price is currently consolidating and moving sideways around this area, preparing for a major move.
2. Technical Signals and Momentum Indicators 📊
Momentum indicators such as MFI, RSI, and Stochastic have all entered the oversold territory, while also showing signs of price compression (consolidation), indicating the market is waiting for the next breakout.
The strong resistance zone and the Overbought/Overextended (OB/OS) signals suggest that buying pressure is weakening, which is favorable for sellers.
3. Sell Scenario on Key Support Breakdown 🔻
If the price breaks below the important Key Support level shown on the chart, this will confirm the beginning of a downtrend.
Traders can consider opening sell positions as soon as the breakout occurs to take advantage of the downward momentum.
The price target is expected to move toward lower support zones where buying interest may emerge to cause a price correction.
4. Risk Management ⚠️
Place stop-loss orders above the resistance zone or the nearest recent highs to protect against unexpected market moves.
Adjust your position size according to your risk tolerance.
5. Conclusion 🔑
The sell setup on US30 is very clear with a strong resistance zone and momentum signals indicating a potential upcoming downtrend.
Main scenario: Breaking the Key Support will trigger a strong decline, providing a profitable trading opportunity for sellers.
Wait for a confirmed support break before entering the trade to ensure safety and effectiveness.
Please like and comment below to support our traders. Your reactions will motivate us to do more analysis in the future 🙏✨
Harry Andrew @ ZuperView
To you in comment…Us30…
FYI…. How far I’m willing to take it. 👀
Let’s get it!!!
Ny active!!!!
Bag or Dust 🏦

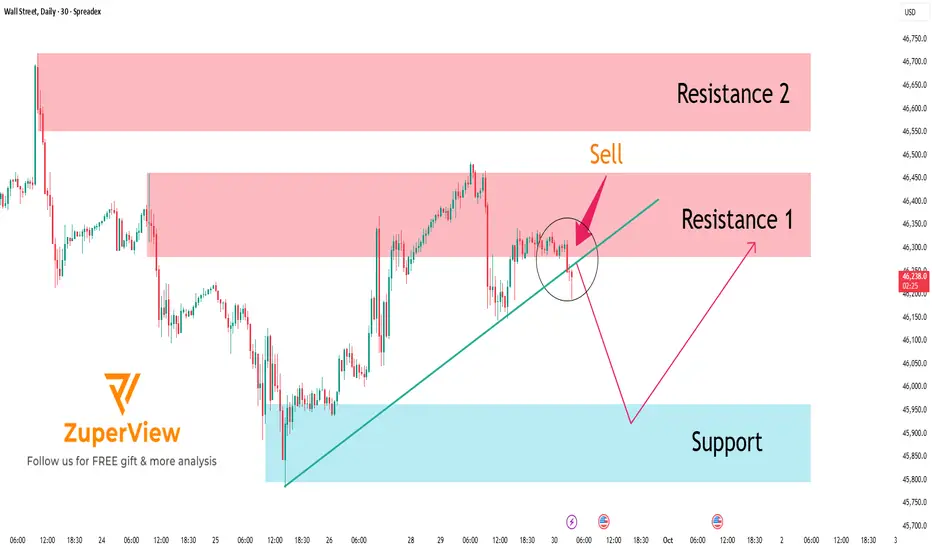
US30: Rejects Resistance – Bearish Move in Progress
The SPREADEX:DJI index is currently forming a bearish short-term structure, especially after price entered the Resistance Zone 1 (46,279 – 46,445) — a key area where sellers have clearly stepped in with strong rejection.
🚨 CLEAR REVERSAL SIGNALS
At Resistance 1, we saw multiple rejection candles with strong bearish bodies.
Additionally, the MA Plot has turned downward, signaling a possible shift in trend.
Price also touched the 4-level structure zone of support/resistance, adding confluence to the area.
Immediately after, the market reversed and dropped sharply with strong bearish candles, confirming the presence of selling pressure and strengthening the short bias.
📉 PREFERRED SCENARIO – SHORT WITH THE TREND
With the current momentum, the preferred scenario is:
🔻 Price is likely to continue dropping toward the Support Zone: 45,459 – 45,798
This zone serves as a logical short-term target for any short positions taken at Resistance 1. Once price reaches this area, traders can consider partial or full take-profits, depending on market reaction.
🧠 TRADE IDEA
Action: 🔻 Short
Entry Zone: 46,279 – 46,445
Stop Loss: Above 46,550
Take Profit: 45,800 – 45,500
✅ CONCLUSION
US30 is under visible selling pressure after rejecting Resistance 1 and reacting strongly at multiple confluence levels. The technical setup favors a trend-following short strategy, with proper risk management and patience around key levels to confirm next moves.
Please like and comment to support our traders. Your feedback motivates us to produce more analysis in the future 🙏✨
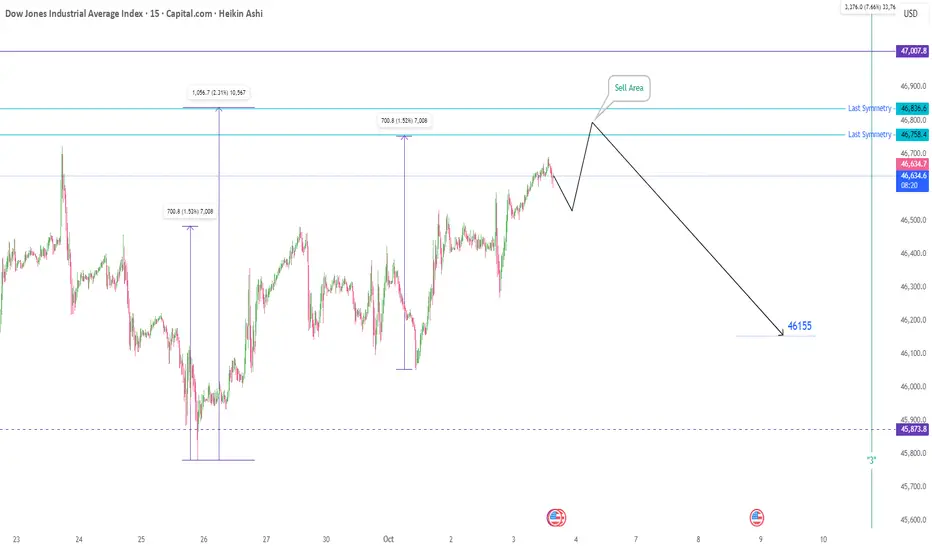
Us30 in FridayToday is Friday, the last trading day of the week. Despite the absence of major economic news releases, the following forecast for the Dow Jones Index is highly probable.
Upon market open and with an increase in trading volume, we anticipate an upward move. After registering a new price high, the index is expected to decline to approximately the 46,160 level.
Entering short positions within the specified target zone presents a favorable opportunity to capture profits. May it be profitable.
Please note: This is solely a trading idea. The responsibility for any trading decision rests entirely with the individual.
Dow Jones Swing Trade Setup – Is 48,000 the Next Stop?📈 US30 "Dow Jones Industrial Average" CFD: Thief's Wealth Strategy Map (Swing/Day Trade) 🚨
🎯 Swing/Day Trade Setup: US30 (Dow Jones Industrial Average CFD)
Get ready to sneak into the market with the Thief Strategy — a cheeky, layered limit-order approach to steal profits from the Wall Street shadows! 😎 This bullish plan is designed for swing or day trading, with a professional yet playful vibe to maximize your market heist. Let’s break it down! 🕵️♂️
🧠 Trade Idea: Bullish Heist on US30 🚀
Asset: US30 (Dow Jones Industrial Average Index CFD)
Market: Wealth Strategy Map (Swing/Day Trade)
Outlook: Bullish 📈
Strategy: The Thief Strategy — using multiple buy limit orders in a layered entry style to catch the best price levels. Think of it as setting traps for profits! 🕸️
📝 The Thief’s Plan: Layered Entry & Key Levels
🔑 Entry Strategy:
Deploy multiple buy limit orders to layer your entries like a master thief:
🎯 46,500
🎯 46,600
🎯 46,700
🎯 46,800
Pro Tip: Feel free to add more layers based on your risk appetite or market conditions. The more traps, the merrier! 😜
Flexible Entry: You can enter at any price level within this range, but layering helps you average into the position like a sneaky pro.
🔐 Stop Loss (SL):
Set at 46,300 — the Thief’s escape hatch! 🚪
Note: Dear Ladies & Gentlemen (Thief OGs 🕶️), this SL is my suggestion, but it’s your heist! Adjust based on your risk tolerance and account size. Only risk what you can afford to lose!
🎯 Take Profit (TP):
Primary target: 47,600 — a juicy profit zone before the Police Barricade (resistance) at 48,000.
Why 47,600? This level avoids the overbought trap and potential reversal at 48,000, where strong resistance and market shenanigans may lurk. 🕵️♂️
Note: Thief OGs, this TP is my call, but you’re the boss! Take profits at your own discretion and secure the bag. 💰
🔍 Why This Setup? Key Analysis Points
Market Context: The US30 is showing bullish momentum, supported by recent economic data and market sentiment (check social posts and financial news for real-time vibes).
Technical View:
The layered entry approach leverages potential pullbacks within a bullish trend, maximizing your entry efficiency.
The 46,300 SL is placed below key support to protect against sudden reversals.
The 48,000 level acts as a major resistance (overbought zone + psychological barrier), making 47,600 a safer TP.
Risk Management: The Thief Strategy spreads risk across multiple entry points, reducing the impact of volatility spikes.
💹 Related Pairs to Watch (Correlated Assets in USD)
To boost your market awareness, keep an eye on these correlated assets:
SP:SPX (S&P 500 Index CFD): Moves closely with US30 due to shared exposure to U.S. large-cap stocks. A bullish US30 often aligns with SPX strength. 📈
PEPPERSTONE:NAS100 (Nasdaq 100 Index CFD): Tech-heavy index that can amplify or diverge from US30 moves. Watch for tech sector momentum. 💻
FX:USDJPY (Forex Pair): A stronger USD often supports bullish US equity indices like US30. Monitor for USD strength or Yen weakness. 💵
Key Correlation Insight: If SP:SPX and PEPPERSTONE:NAS100 show similar bullish patterns, it reinforces the US30 setup. Conversely, a sharp USDJPY drop could signal caution for US indices.
⚠️ Disclaimer
This Thief Style trading strategy is just for fun and educational purposes! 😜 Trading involves risks, and past performance doesn’t guarantee future results. Always conduct your own analysis, manage risk wisely, and only trade what you can afford to lose.
✨ If you find value in my analysis, a 👍 and 🚀 boost is much appreciated — it helps me share more setups with the community!
#US30 #DowJones #ThiefStrategy #SwingTrading #DayTrading #Bullish #TechnicalAnalysis #TradingView #WealthStrategy

US30 - Math Never Lies: Dow Jones Key Levels AheadDow Jones – Bullish Trend but a Short-Term Correction Possible
The main trend remains bullish, but the current market sentiment suggests a correction, which will be confirmed only if 46,630 holds.
Possible downside targets are:
45,560 – key level confirming deeper correction if price breaks and holds below.
45,050
44,460
and
43,600
and possibly 42,930.
All these levels are based on mathematical calculations, and each of them can provide a good risk/reward trading opportunity in lower timeframes — even if price breaks through them.
In the bigger picture, a correction confirmation sits around 45,560, while the main direction remains bullish, with upside targets already shared in my previous analyses, up to 48,000.
Enjoy the analysis and please support the post if you find it helpful — your support helps quality content get seen! 🚀📈

Will DOW JONES Repeat History???The Dow Jones 125-Year Timeline
- The oldest US Stock index is at the 125-year resistance trendline.
- The last time it perfectly tested the trendline - a period of The Great Depression started - 1929
- After, which the Dow fell around 90% - Check the blue supporting trendline.
A similar trendline could be perfectly drawn:
- The support of the trendline is 90% lower than the current market levels

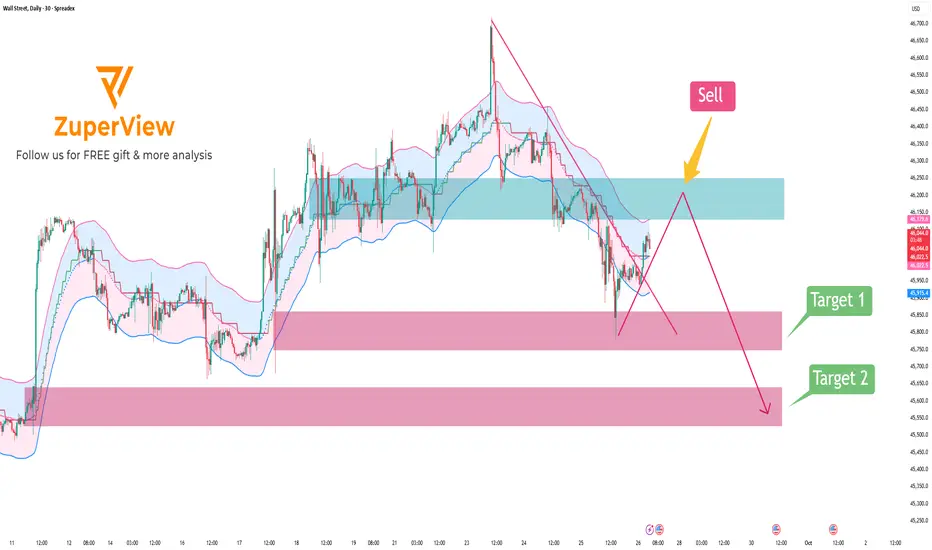
US30: Rebound to resistance & continue to break down
📝 1. Market Context
The SPREADEX:DJI dropped sharply from the recent high around 46,700 down to near 45,700, showing that sellers are currently in control in the short term. After this sharp decline, price is experiencing a mild recovery but still remains within a clearly defined downtrend channel and below key resistance.
🟥 2. Resistance Zone
The major resistance is located around 46,250 – 46,130 (highlighted in blue on the chart):
• This zone overlaps with the EMA and the upper band of the Keltner Channel.
• It was previously a sideways consolidation area that has now turned into resistance.
• It also intersects with the descending trendline, making a bearish rejection likely.
🟩 3. Support Zone
The nearest support lies at 45,858 – 45,748 (first pink zone).
If price breaks below this level, it is likely to continue falling toward the lower support zone at 45,520 – 45,640 (second pink zone).
🚨 4. Bearish Scenario
• Main scenario: Wait for a price pullback into the 46,250 – 46,130 area and watch for bearish signals → then SELL.
• Target: First target at 45,860 – 45,750 → if broken, expect further decline toward 45,520 – 45,640.
• Invalidation: A daily close above 46,250 would invalidate this bearish setup.
Please like and comment to support our traders. Your feedback motivates us to produce more analysis in the future 🙏✨
US30 – Bearish Below 46,300 With Downside Targets at 46,120 US30 – Overview
US30 is holding a bearish bias after stabilizing below 46,300.
As long as price trades below the pivot, the index is expected to extend the decline toward 46,120, with a further drop to 46,000 possible.
A confirmed 1H close below 46,000 would strengthen the bearish trend and expose deeper support at 45,690.
On the other hand, a 1H close above 46,300 would neutralize the bearish pressure and support a rebound toward 46,400 – 46,470.
Pivot: 46,300
Support: 46,120 – 46,000 – 45,690
Resistance: 46,400 – 46,470 – 46,620

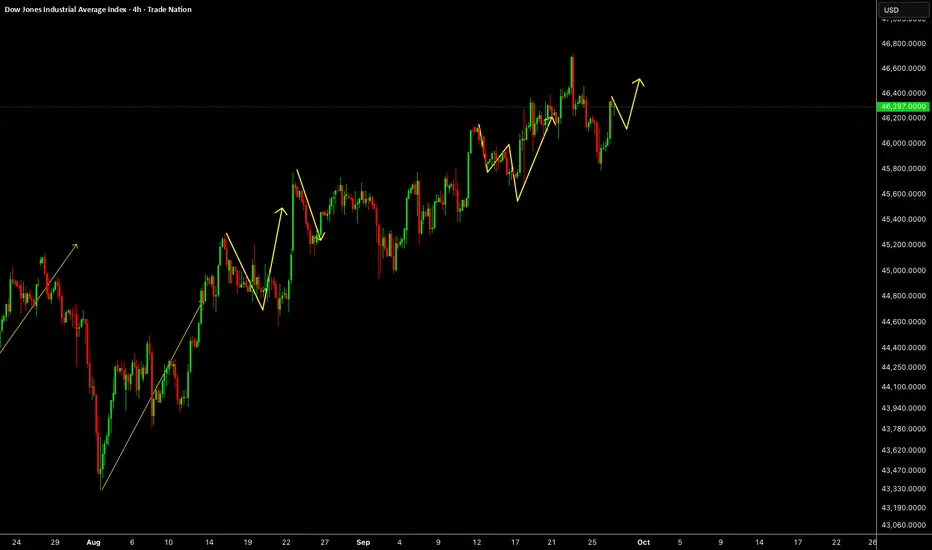
US30US30 needs some correction and one more push up to take ATH.
Disclosure: We are part of Trade Nation's Influencer program and receive a monthly fee for using their TradingView charts in our analysis.
US30 Resistance Cluster Above!
HI,Traders !
#US30 made a bearish
Breakout of the support
Cluster of the rising and
Horizontal support levels
Which is now a resistance
Cluster round 46329.8 then
Went down and made a local
Pullback on Thursday and
Friday but we are bearish
Biased mid-term so we
Will be expecting a further
Bearish move down this week !
Comment and subscribe to help us grow !

Kwrwshmhmdy4 We saw signs of a decline in the US30 chart last week. And this decline was enough to convince retail traders to enter a sell trade and place a stop at the highest peak. And this is exactly the wrong thing to do, because the market will turn around and hit all the stop losses and with the volume that enters the market, the price will flow down. So the market will first go up and eventually fall more sharply.

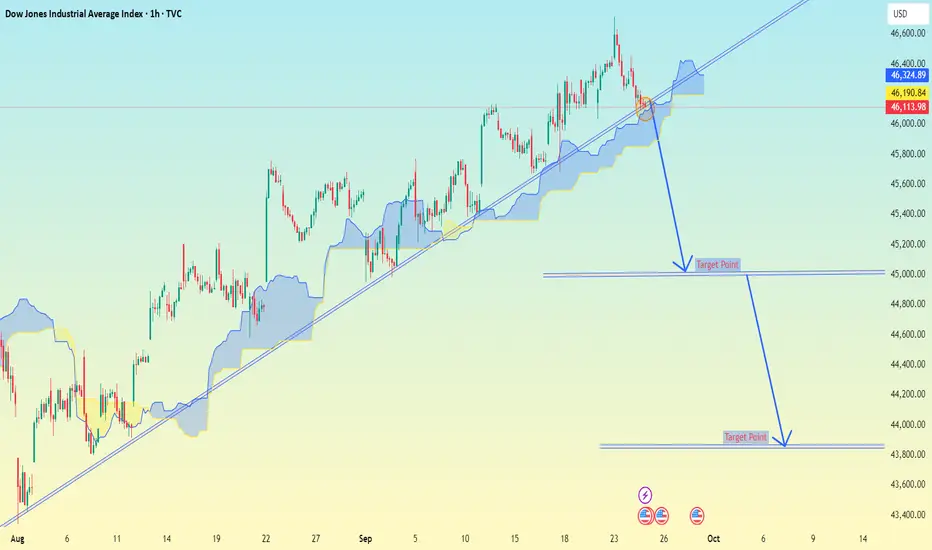
Dow Jones Industrial Average (DJI) on the 1-hour timeframe.Dow Jones Industrial Average (DJI) on the 1-hour timeframe.
From the chart:
The uptrend line is being tested.
There are two downside target points marked if the trendline breaks.
📉 Target levels shown on the chart:
1. First target zone: around 45,000 – 45,100
2. Second target zone: around 43,800 – 44,000
So if the price breaks the ascending trendline and confirms below it, the next expected supports are roughly:
45,000 area (first support/target)
43,800 area (second support/target)