ENAUSDT 1D#ENA has perfectly bounced off the bullish pennant support line, the Ichimoku cloud, and the daily SMA50, breaking above the pennant. If the price holds above the pennant, the potential targets are:
🎯 $0.8381
🎯 $0.9094
🎯 $0.9806
🎯 $1.0820
🎯 $1.2112
⚠️ Always remember to use a tight stop-loss and follow proper risk management.
ENAUST trade ideas

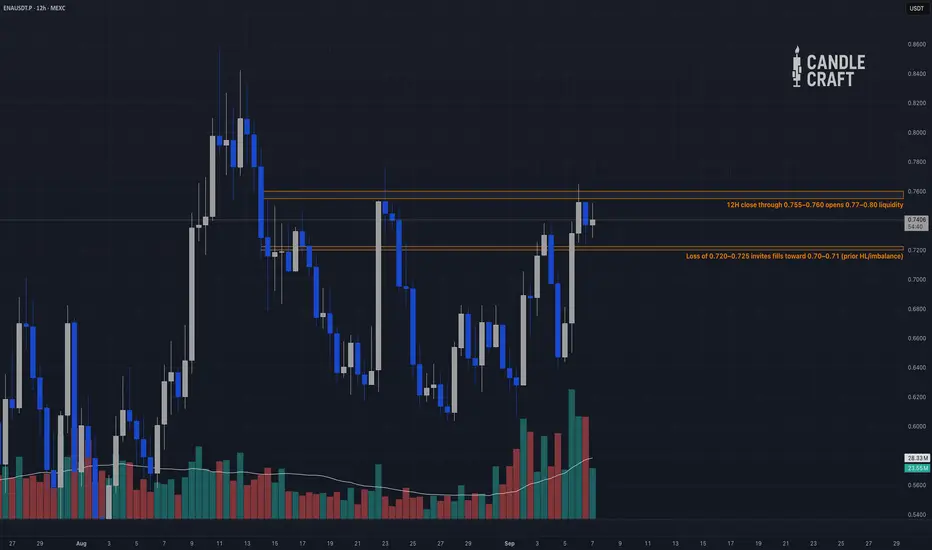
ENAUSDT — Multi-Timeframe Deep AnalysisWhat’s up traders! ENA has been balancing harder than my coffee intake during New York open. Let’s dissect the levels.
High Timeframes (Weekly → 2D → 12H)
– Weekly HL base led to 0.78–0.80, pullback orderly. Uptrend intact >0.60–0.62. Supply = 0.78–0.83, demand = 0.62–0.66.
– 2D stair-step HH/HL since July. Ceiling at 0.74–0.77 = equal-highs risk. Imbalances: 0.70–0.73 and 0.66–0.68. Holding above 0.74–0.75 pressures 0.77–0.80.
– 12H range = 0.72–0.76, mid ~0.74. BOS up >0.755–0.760 → 0.77–0.80. Lose 0.720–0.725 → refills 0.70–0.71 HL.
Liquidity Map
– Above: 0.755–0.758 → 0.775–0.785 → 0.80–0.83.
– Below: 0.730–0.735 balance shelf → 0.720–0.725 → 0.70–0.71 → 0.66–0.68.
Footprint / Profile
– POC = 0.733–0.734.
– VAH ~0.748–0.750, VAL ~0.722–0.724.
– HVNs at 0.742–0.744 / 0.726–0.728.
– Buyers defending 0.726–0.729; sellers leaning 0.746–0.751. Market balanced inside 0.724–0.750.
Derivatives Context
– OI slowly rising → controlled leverage.
– Funding neutral-slight positive.
– CVD stabilizing, spot-led demand.
– Modest liquidations.
Inter-Market
– BTC mid-range, ETH steady, BTC.D sub-60%. Context supports alt resilience.
Conclusion
ENA remains in balance 0.724–0.750. Pivot POC 0.733. Acceptance >0.75 = value shift toward 0.77–0.80. Acceptance <0.724 = rotation into 0.712–0.708.
Candle Craft | Signal. Structure. Execution.
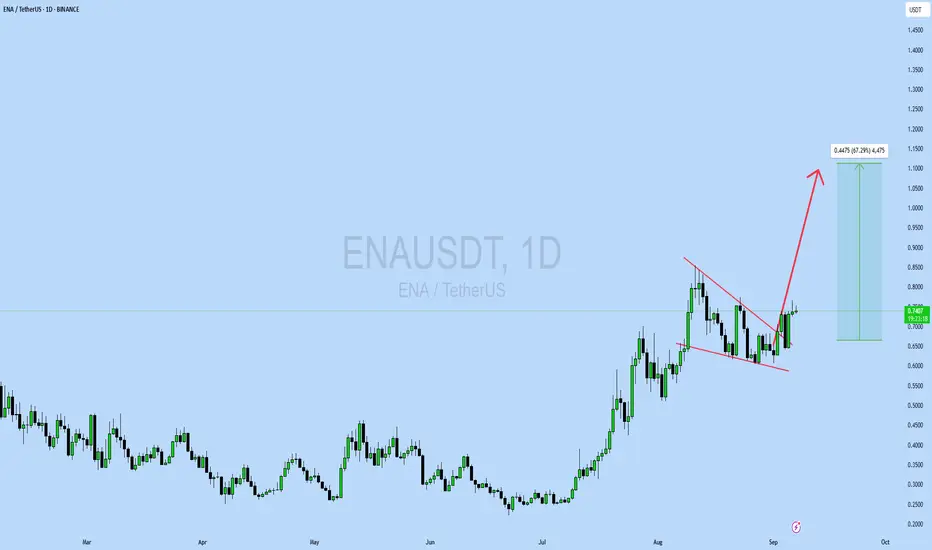
ENAUSDT UPDATE#ENA
UPDATE
ENA Technical Setup
Pattern : Bullish Falling Wedge Pattern
Current Price: $0.7401
Target Price: $1.18
Target % Gain: 67.29%
Technical Analysis: ENA has broken out of a falling wedge on the 1D chart with bullish continuation signs. The breakout is supported by strong structure and upside momentum, pointing towards $1.18 in the coming sessions.
Time Frame: 1D
Risk Management Tip: Always use proper risk management.

Ena short of the day Ena short signal now activated rr is good and as you can see this is the trade for today

ENA About to Explode – Eyes on $1.20+$ENA/USDT Weekly Analysis
ENA has been playing out a classic fakeout and trap setup around the lower support zone. Each dip below support attracted aggressive selling, only for the price to reclaim the level and trap late shorts.
Now, the breakout attempt above the descending trendline is gaining momentum.
If price manages a clean weekly close above this zone, the next target sits around $1.00–$1.20, with a potential push toward the $1.52 high if volume supports the move.
DYOR, NFA
Thanks for checking this out.

ENA Bullish Flag Breakout – Next Leg Up?ENA has shown impressive strength, rallying over 235% from the bottom. After this strong move, price consolidated into a bullish flag formation, a continuation pattern often seen before the next leg up.
On the daily chart, a breakout has been confirmed, with price now preparing for further upside. Both the 100 and 200 EMA are acting as strong support at the bottom of the flag, while price is also holding above the volume support zone, adding confluence to the bullish setup.
If momentum continues, ENA has the potential to extend this breakout toward higher targets in the coming weeks. Proper risk management remains key, but the technical structure suggests the bulls are in control.
Cheers
Hexa

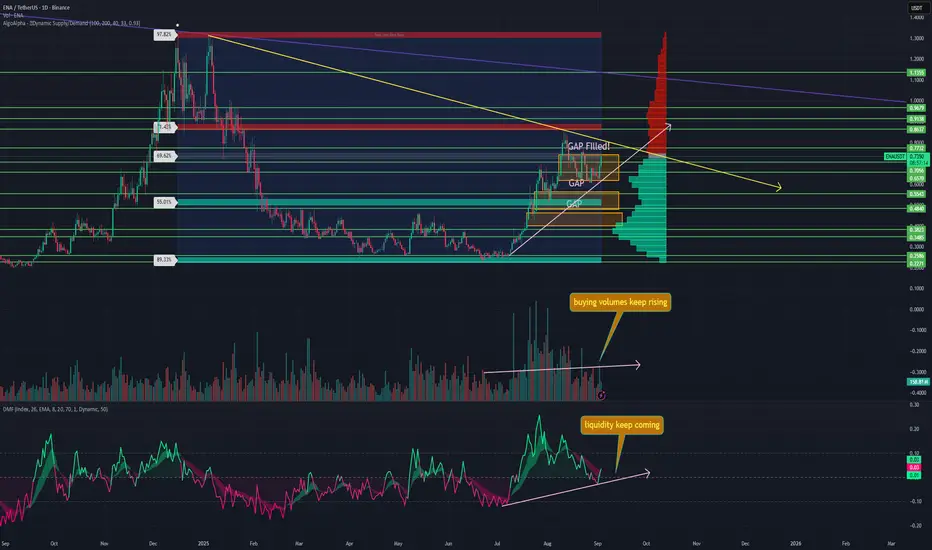
ENA retests a key levelRecently, ENA closed the nearest downside gap at $0.74–0.62, which I mentioned earlier. Now the price is retesting the diagonal resistance from early August. A breakout above this could open the path toward a new ATH.
➡️ Meanwhile, buying volumes remain in harmony with price — they’re rising as the price rises, showing that interest in ENA is still growing even at these levels.
➡️ ENA is also one of the few tokens on the market right now with a positive Money Flow reading, signaling ongoing liquidity inflows. For comparison, ETH and BTC are already in negative territory.
➡️ However, two gaps remain below: $0.56–0.48 and $0.46–0.40. And as you’ve already seen many times, gaps tend to close reliably.
➡️ At the same time, the Supply and Demand Zones indicator shows massive demand for ENA at current levels and lower, while supply is almost nonexistent right now. In other words, there are hardly any sellers — but plenty of buyers.
📌 Conclusion:
ENA continues to look highly attractive for long trades. If it can break through the diagonal resistance, I’ll personally be looking for a swing trade, with a plan to target at least a retest of $1.
ENA / USDT : Keep a close watch on breakoutENA/USDT is currently testing trendline resistance and attempting a breakout.
Bullish scenario: A successful breakout with confirmation could push price toward $0.80 – $0.85.
Bearish scenario: Failure to breakout will invalidate this setup.
Always manage risk and avoid entering without clear confirmation.

ENA LongI don’t share many day trades on TradingView, but ENA looks promising. I expect one more leg down before a move up let’s see how it plays out. X marks the invalidation.

Ena short to $0.5935Ena short to $0.5935
Sl: 0.6480
Ena will likely trend down to retest the target areas above

Early and risky entry “The coin we are trading has the potential to rise, and given the setup and market conditions, our entry might be a bit early, but the risk is worth it.”

ENAUSDT UPDATE#ENA
UPDATE
ENA Technical Setup
Pattern : Falling Wedge Pattern
Current Price: $0.6759
Target Price: $1.11
Target % Gain: 65.62%
Technical Analysis: ENA is consolidating inside a falling wedge on the 1D chart. Price is holding near support and showing signs of breakout potential, with upside momentum likely to push toward $1.11 if confirmed by volume.
Time Frame: 1D
Risk Management Tip: Always use proper risk management.

Reload at $0.40, ride the trend toward $0.90–$1.20ENA is tracking a higher-timeframe bullish structure while eyeing a deep retest at $0.40. That zone aligns with prior demand and alert levels from the author. The monthly support / invalidation sits at ~$0.238 — a break below would negate the idea.
Trade Plan (Swing)
Entry: $0.4000 (limit; consider a ladder $0.415 → $0.400 → $0.385)
Stop (hard): $0.2380 (monthly break) → −40.50%
Targets:
TP1: $0.70 (+75.0%) — partials/stop to BE
TP2: $0.90 (+125.0%) — main take
TP3 (stretch): $1.20 (+200.0%)
Baseline R:R: ~3.09 : 1 (0.40 → 0.90 vs. 0.238)
Scenarios
A) Preferred — Deep Retest & Reversal at $0.40
Trigger: Wick into $0.41–$0.39 with H4/W1 SFP/BOS + reclaim of $0.40.
Execution: Fill ladder; add on reclaim > $0.40 (flip to support).
Invalidation: Daily/Weekly close < $0.238 (monthly level lost). Tighten if H4 structure fails repeatedly below $0.39.
B) Shallow Pullback, Continuation Above $0.40
Trigger: Hold >$0.40 without a deep tag; higher lows on H4.
Execution: Buy on retest $0.40–$0.41 with confirmation (LL→HL shift).
Invalidation: H4 acceptance < $0.40 (failed flip); hard stop unchanged $0.238.
Smart Money View
Setup resembles a “deep reload” into demand before expansion. If $0.40 holds and flips, the draw favors inefficiency fills toward $0.70 → $0.90, with $1.20 as extension once weekly momentum compounds.
Risk & Management
Size down to respect the HTF stop distance; ladder entries to improve average.
After TP1 $0.70, move stop to break-even and trail below fresh higher lows on H4/D1.
Avoid chasing mid-range between $0.45–$0.65 without a clean pullback or structure break.

Ena Limit Short order to $0.5929#Ena limit short order🌼
Limit entry: 0.6335
Sl: 0.6538
tp: 0.5929
Risk to reward: 2

ENA Bullish Order Block Plus 200 MA Strong confluenceENA has corrected after tapping into the 0.618 Fibonacci retracement, and price action is now gravitating toward a key bullish order block that has yet to be tested. This zone is particularly important, as it not only serves as a structural demand region but also aligns with the 200-day moving average, creating a strong confluence of technical support. How ENA reacts at this level will be pivotal in determining whether the trend can sustain its bullish momentum.
Key Technical Points:
- 0.618 Fibonacci Retracement: Recent correction respected this critical retracement level before shifting lower into support.
- Bullish Order Block + 200 MA: Strong confluence support area where demand is expected to absorb selling pressure.
- Weekly Target at $0.61: A continuation higher remains viable as long as price holds above the order block.
The recent corrective move in ENA has been orderly rather than impulsive, suggesting that sellers have not overwhelmed the broader trend. The decline into the bullish order block coinciding with the 200 moving average provides traders with a high-probability support zone, where buying interest is likely to reemerge. These conditions make this area the ideal battleground between supply and demand, and its defense will be crucial for continuation.
From a structural perspective, order blocks have the ability to maintain price stability for extended periods. If ENA holds this region without significant breakdowns, sideways accumulation could occur before a renewed move higher. This would provide the market time to reset momentum indicators and build the foundation for another leg up.
Volume analysis supports the bullish case. Strong influxes of buying volume are evident throughout recent trading sessions, confirming that demand continues to underpin the trend. Sustained participation from bulls at this level would reinforce the likelihood of a reversal from support and set the stage for a rotation higher.
The broader trend remains constructive, with higher lows and confluence zones supporting the market structure. As long as the bullish order block remains intact and volume continues to favor buyers, ENA retains the merit for continuation into higher targets.
What to Expect in the Coming Price Action:
ENA is approaching a high-confluence support zone where the bullish order block and 200 MA align. If this area holds, the setup favors a rotation back toward the $0.61 weekly target and potentially beyond. Consolidation at this support before a breakout is also a probable scenario. A breakdown below the order block would invalidate the immediate bullish outlook, but until then, the trend remains biased toward continuation higher.

Ena spot planmade huge gains from this coins trading it from wave C to D
now the wave D has topped looking for wave E to hit my minimum target and then fly to moon
Entry Tp and Sl are mentioned in Chart

ENA scalp entrythere is a support at 0.687 of ENA and also the Fib retracement golden pocket is there. I'm bullish on it for short term. DYOR

ENA Breakout Alert!🚨 MIL:ENA Breakout Alert! 🚨
MIL:ENA is currently testing the red resistance zone 🔴
If price breaks out, the first target will be the green line level 🎯
A confirmed breakout here would signal bullish continuation and could fuel further upside ✅
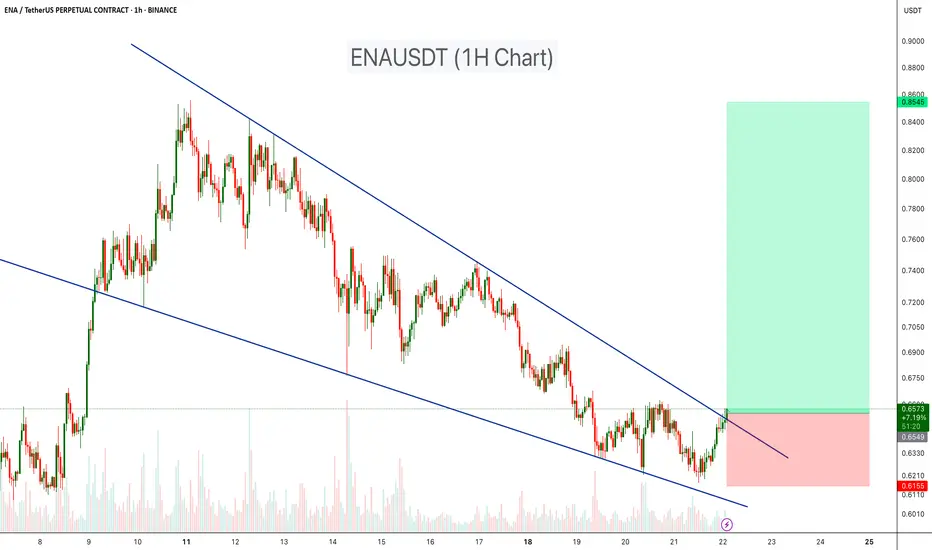
ENAUSDT – Falling Wedge Breakout in PlayENAUSDT on the 1H chart is forming a falling wedge pattern, which is typically a bullish reversal signal. After a consistent downtrend, the price is now testing the upper wedge resistance.
A breakout above this level could confirm bullish momentum, with potential upside toward the 0.85 USDT target zone.
Resistance 1:0.72
Resistance 2:0.79
Resistance 3:0.85
Stop loss: $0.615
Cheers
Hexa
ENA Holds Key Fibonacci Support as Bulls Target All-Time HighENA price action is testing the 0.618 Fibonacci retracement, a level in confluence with the 200-day moving average and weekly ASA support. Holding this zone could ignite a 36% rally back toward $0.85.
ENA has retraced into a crucial support cluster that may determine the next major directional move. Currently, price is consolidating around the 0.618 Fibonacci retracement level, which has aligned with both the 200-day moving average and the weekly ASA support. This convergence of multiple technical signals underscores the importance of the current level as a base for continuation.
The 0.618 Fibonacci level, often referred to as the “golden pocket,” is one of the most reliable retracement zones for bullish reversals. Historically, assets that respect this level often regain momentum for a move back toward previous highs. In ENA’s case, the zone coincides with longer-term moving average support and a structural weekly level, making it even more significant.
Key Technical Points:
- 0.618 Fibonacci Retracement: Major retracement level aligning with structural support.
- Confluence with 200-Day MA & Weekly ASA: Reinforces the strength of this support cluster.
- Upside Target at $0.85: Holding support opens probability for a 36% rally back to all-time highs.
The 200-day moving average has historically acted as a dynamic level of trend definition. For ENA, the moving average has been reclaimed and is now providing support at the same region as the golden pocket. This combination provides bulls with a technical advantage, signaling that momentum remains intact despite the recent pullback.
Volume analysis around this level will be critical in confirming the next move. If accumulation continues and volume inflows remain above average, the likelihood of a bounce toward $0.85 increases significantly. Conversely, failure to defend this zone could expose ENA to deeper retracements, though the current confluence suggests buyers are willing to defend aggressively.
From a market structure perspective, ENA remains in an overall bullish trajectory. The correction into the golden pocket appears healthy within the broader trend, as long as the $0.62 support cluster holds. Higher lows on the weekly chart would confirm that bulls remain in control, setting the stage for a measured rally back to the all-time high.
What to Expect in the Coming Price Action
If ENA continues to defend the $0.62 region on a closing basis, a rotation back toward the $0.85 all-time high becomes the most probable outcome. Such a move would represent over 36% upside from current levels. Momentum remains constructive as long as buyers maintain control of this confluence support, making ENA one to watch for a potential breakout in the weeks ahead.


