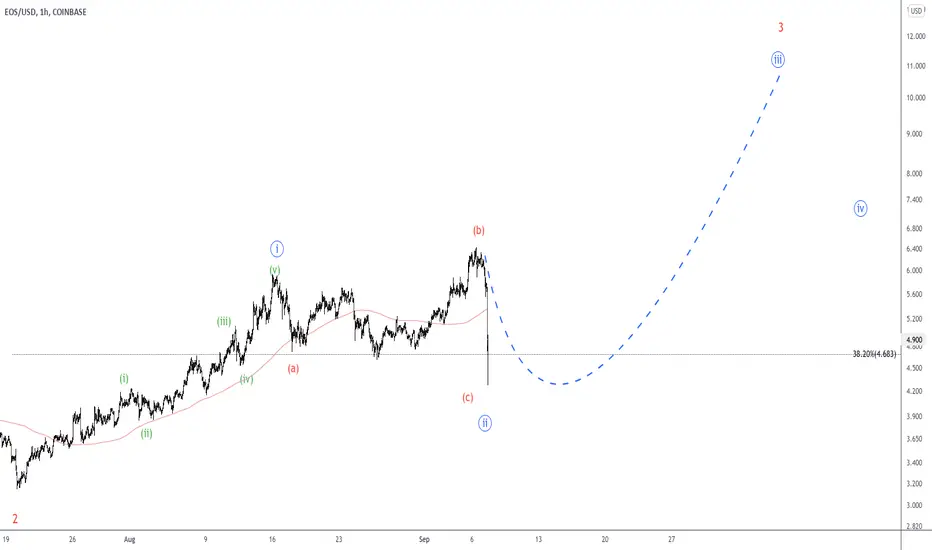
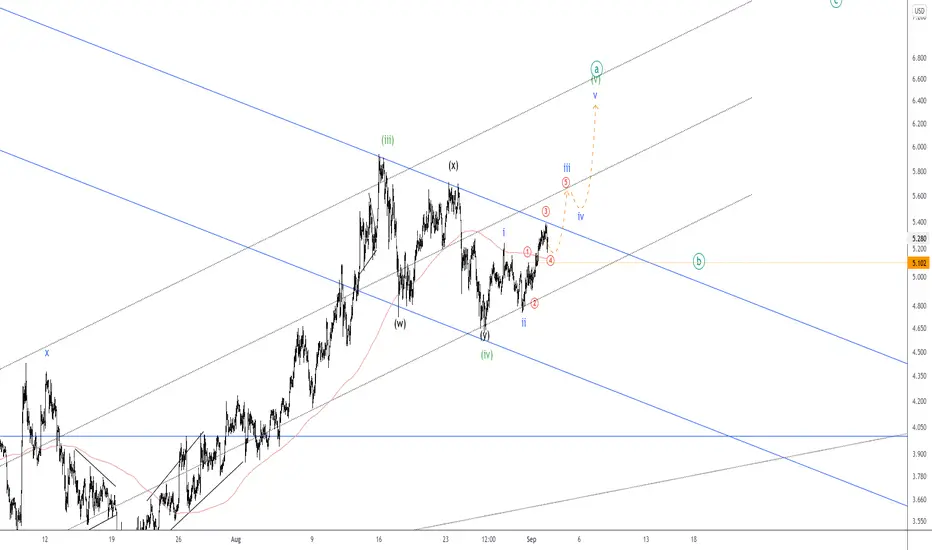
EOS EOSUSD - Rounding bottom + NEW ATH very soon!- This is my analysis for EOS , a lot of poepole asking about why EOS is not pumping.
- On the chart we can see a rounding bottom or cap and handle formation, which is bullish .
- After a rectangle consolidaton, the price started with an Impulse Elliott wave .
- First target 1:1 / below all time high.
- RSI is ready and volume favors bulls.
- For expected duration of the trade, probability, stop loss, profit target, entry price and risk to reward ratio ( RRR ) - please check my signature below ↓
- If you want to see more of these ideas, hit "Like" & "Follow"!
Trade ideas

EOS (EOS) - September 9Hello?
Welcome, traders.
By "following", you can always get new information quickly.
Please also click "Like".
Have a nice day.
-------------------------------------
(EOSUSD 1W Chart)
If the price is maintained above the 2.8250-4.0849 range, it is expected that the uptrend will continue.
In particular, if the price is maintained above the 6.4053 point, it is expected to create a new wave.
(1D chart)
We need to see if we can sustain the price above the 5.1 point.
If it goes down, you should check to see if it finds support at the 3.6732-4.0849 level.
It is important to be able to break above the resistance zone formed by the 6.4053-8.1435 area.
-------------------------------------
(EOSBTC 1W chart)
We'll have to wait and see if we can climb from the bottom section of 0.0000856-0.0003040.
Specifically, we need to see if we can sustain the price above the 0.0001470 point.
(1D chart)
We need to see if we can find support in the 0.0000997-0.0001113 zone and move above the 0.0001181 point.
If it goes down from the 0.0000997 point, it could touch the 0.0000856 point, so you need to be careful with your trades.
An upward break above the 0.0001470-0.0001690 zone is required to accelerate the uptrend.
------------------------------------------
We recommend that you trade with your average unit price.
This is because, if the price is below your average unit price, whether it is in an uptrend or in a downtrend, there is a high possibility that you will not be able to get a big profit due to the psychological burden.
The center of all trading starts with the average unit price at which you start trading.
If you ignore this, you may be trading in the wrong direction.
Therefore, it is important to find a way to lower the average unit price and adjust the proportion of the investment, ultimately allowing the funds corresponding to the profits to regenerate themselves.
------------------------------------------------------------ -----------------------------------------------------
** All indicators are lagging indicators.
Therefore, it is important to be aware that the indicator moves accordingly with the movement of price and volume.
However, for the sake of convenience, we are talking in reverse for the interpretation of the indicator.
** The wRSI_SR indicator is an indicator created by adding settings and options to the existing Stochastic RSI indicator.
Therefore, the interpretation is the same as the traditional Stochastic RSI indicator. (K, D line -> R, S line)
** The OBV indicator was re-created by applying a formula to the DepthHouse Trading indicator, an indicator disclosed by oh92. (Thanks for this.)
** See support, resistance, and abbreviation points.
** Support or resistance is based on the closing price of the 1D chart.
** All descriptions are for reference only and do not guarantee a profit or loss in investment.
Explanation of abbreviations displayed in the chart
R: A point or section of resistance that requires a response to preserve profits.
S-L: Stop Loss point or section
S: A point or section where you can buy to make a profit as a support point or section.
(Short-term Stop Loss can be said to be a point where profit and loss can be preserved or additional entry can be made through split trading. It is a short-term investment perspective.)
GAP refers to the difference in prices that occurred when the stock market, CME, and BAKKT exchanges were closed because they are not traded 24 hours a day.
G1 : Closing price when closed
G2: Opening price
(Example) Gap (G1-G2)

EOS 100$eos is one of the best in the market left over from the market.
I do not think it is unlikely that the price will rise to $ 100.
Due to the fact that it is located approximately at the bottom of the canal, it is possible for it to grow up to the canal roof

Global market deleveraging EOS simply continues the pumpVery nice retracement of the pump here
Should be a nice buy back around these areas
Lets do this reeee
$EOS/USD 1D (Binance Coin-Futures) Symmetrical triangle breakoutEnterprise Operating System (a.k.a. EOS) is accumulating above 100EMA and looks ready for bullish continuation!
Risk/Reward= 1:1.6 | 1:3.11 | 1:5.82
Expected Profit= +27.56% | +54.01% | +101.16%
Possible Loss= -17.38%
Fib. Retracement= 0.5 | 0.618 | 0.786
Estimated Gain-time= 2 months
Exchanges: Binance Coin-Futures, ByBit
Signal Type: Regular (Long)
Leverage: Isolated (1X)
Current Price:
5.577
Entry Zone:
5.453 - 5.075
Take-Profit Targets:
1) 6.725
2) 8.107
3) 10.589
Stop Targets:
1) 4.349

EOS Long term setupHello everyone, if you like the idea, you can support with a like and a follow.
By drawing the fibs from the last crash to our last bottom as a reversal movement from the crash we can expect to retest areas as 0.5 fib and 0.618 fib.
We are currently having resistance from the 0.236 fib while we are inside a small bullflag.
The important support in the chart as you can see are the 5$.
With a brekage of this level the whole image changes to a more bearish sentiment.
Targets:
Long Term 0.5 and 0.618 fibs.
Short Term 6.4$ with a successful break of the bull flag .
Don't forget to protect yourself with proper Risk Management this is the key to winning!
Information provided is only educational and should not be used to take action in the market !
Feel free to ask anything in the comments or send me a message !
Thank you for reading my post, have a great day !

eosusd daily scaleCurrently, this currency is involved in a dynamic resistance range, which if it can cross its dynamic resistance red line of 6.25 and stabilize above it, in the next stage, the range of 7.73 to 8.18 is available, and if it stabilizes above it, the range of 10 The dollar is available for this currency.
But if they are not able to climb the important support areas, including the numbers 5.7, then the range of 4.1, and finally the very important $ 3 area, they can prevent the currency from falling further. Motion probabilities are plotted in the image

EOS TARGET 9.5 - Breakout ComingEOS breaking out on C Wave // target zone 9.5
NOT FINANCIAL ADVICE - JUST MY SPECULATION - I LIKE CHARTS AND LEARNING!
- neo


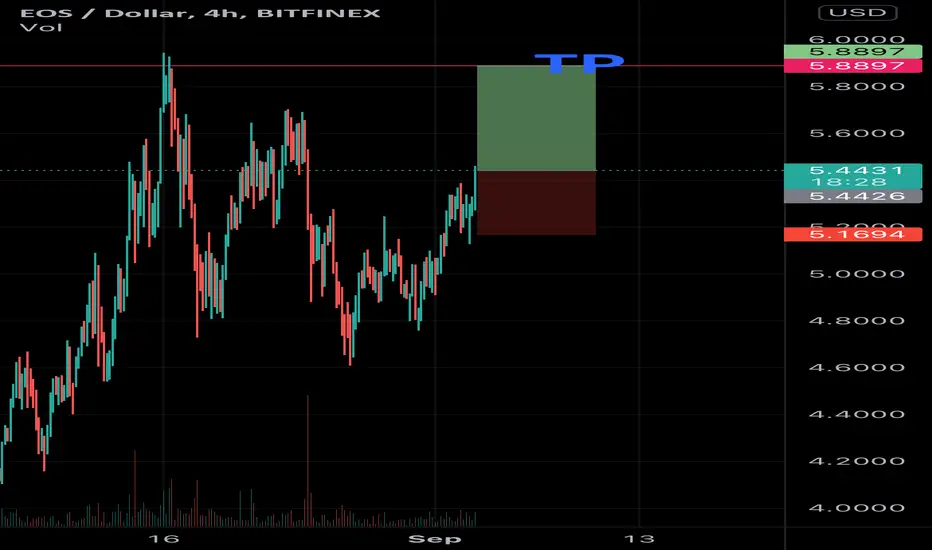
How To Trade The Ascending Triangle Trading The Ascending Triangle
Wait For The Close Above The Horizontal Level
Wait For The Retest in the form of a pin bar or rejection candlestick.
Enter At The Close Price of Pin Bar or Rejection Candlestick
Exit At The Measured Objective of Pattern. The Height of Pattern is 592.
EOS gonna hit 40-48 USD next year GUARANTEEDBar Pattern Map(from $SUSHI) following very nicely. 2022 target for $40+

EOS/USD:BAT PATTERN FORMATION ON H4 TIMEFRAME | SHORT IDEA 🔔Welcome back Traders, Investors, and Community!
Check the Links on BIO and If you LIKE this analysis, Please support our Idea by hitting the LIKE 👍 button
Traders, if you like this idea or have your own opinion about it, please write your own in the comment box . We will be glad for this.
Feel free to request any pair/instrument analysis or ask any questions in the comment section below.
Have a Good Day Trading !

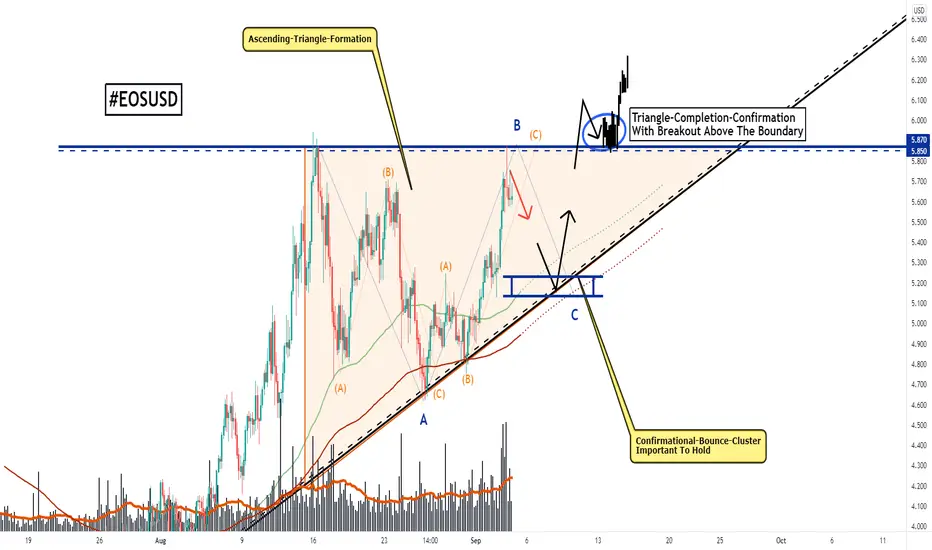
EOS, Bullish-Triangle-Breakout Completes When This Happens!Hello,
Welcome to this analysis about EOS and its 4-hour timeframe perspectives. EOS as I discovered in recent times has emerged with some interesting formational structures that are worthwhile to look at. Within these times the divergence between certain cryptocurrencies in terms of amplitude, formation structure, and volatility potential increases more and more. This is why it is highly necessary to properly distinguish the individual cryptocurrencies to rightly approach the different types. As I detected with EOS it is forming a formation that can convert into great potentials when EOS shows up with the right price-actions, therefore I discovered all the important levels and upcoming determinations we should consider.
As when looking at my chart we can watch there how EOS is forming this main ascending-triangle-formation marked in orange and consisting of the ascending-trend-line and the upper horizontal trend-line which is also resistance at the moment. Within this ascending-triangle-formation EOS has the coherent wave-count with the waves A and B already completed, now as EOS approaches the upper-boundary-resistance again this is the main resistance from where a pullback is likely which will then be a part of the wave C to the downside completing the wave-count within the ascending-triangle-formation. What comes then will be crucial as EOS will approach the confirmational-bounce-cluster this is an important cluster to hold because otherwise when this does not happen EOS will increase bearishness below and invalidate the triangle however when it happens and EOS properly bounces to complete the wave-count and continue bullishly this will lead to a completion of the whole formation with a breakout above the upper-boundary and once this is done EOS will activate upside-targets.
In this manner, thank you for watching the analysis, it will be great when you support it with a like, follow and comment for more upcoming market analysis, all the best!
Information provided is only educational and should not be used to take action in the markets.
EOS W Formation SpottedHello and welcome to my post !
EOS is in a strong uptrend at the moment because of that patterns as the W are higly probable to be profitable.
We found strong resistance at 0.236 fib in our first hit and now we are on the neckline (5.685$) of the W pattern waiting to see a break.
W patterns have a tendency to break, make a run and crash down to liquadate a lot of people and after that continue higher.
Because of that proper risk managment and position managment are a must.
First Target: 6.5$
Second Target: 6.750$
Indicators: (RSI,SRSI,CIDI) The upside momentum of the indicators are strong and bullish for the moment.
Don't forget to protect yourself with proper Risk Management also the information provided is only educational.
Feel free to ask anything in the comments or send me a message !
Thank you for reading my post,if you liked the idea you can support with a like and a follow have a great day !

EOS EXTREMELY BULLISH Double Bottom + Cup & Handle setup followed by volume increase. Strong indicators, wait for breakout of the first fibonacci resistance and go all in. TP highlighted in chart

Buying Levels for EOS/USDDescending Triangle Formed on the 4-hour TF. Possible DCA levels are on the Purple Levels

EOS Up 3.33% from PreliminaryEOS is up 3.33% in gains from when I took a 5.576 preliminary entry back n 8/23.
Prognosis: EOS's PA finally broke from bouncing around in a symmetrical yesterday and I've been tracking it since, having sunk a prelim in it over 10 days ago. Its present trajectory took it to TRR (5.624), where it transcended and is now eyeing the 1.0% Fibonacci gateway. I'll keep letting it run the course, with the hope BTC doesn't thwart its journey to continue making me money.
*Fulltime Wyckoffian VSA crypto swing trader since 2017. I regularly seek out the most lucrative swings on all the major exchanges.
All my charts are clean, straightforward, and easy to follow. No junk, no needless indicators, just solid volume spread analysis ( VSA ) and 'take-the-money-and-run' Fibonacci target zones.
I go after the runners and big money. My win rates are between 80-85%. Follow me on TradingView and see for yourself.
I review over 300 coins & tokens daily and handpick all the runners myself (no bot signals).
** Not financial advice. Trade at your own risk.

C&H Measured move applied to EOS...Yellow labels are for wicks & orange are for body measurements. I applied 61% rule to gains projections from C&H statistics. DYODD.

Moon time for EOSEOS is ending corrective phase of dominant cycle, I'm expecting sharp move to previous ATH and continuation.

EOS Breaking Out Towards 6.50Trend Analysis
The main view of this trade idea is on the 2-Hour Chart. The crypto currency EOS appears to be breaking out of the downward trendline of the symmetrical triangle (highlighted in red). This breakout is expected to take the cryptocurrency towards the 6.5 price level. This view will be negated by a close below the low of the pullback at around the 4.5 price level.
Technical Indicators
The breakout from the downward trendline are supported by 3 technical indicators: the 200-SMA, the Awesome Oscillator (AO) and the MACD. Currently EOS is trading above its long term MA and the AO is green and above 0. Also the MACD recently had a positive crossover. A change in trend will be seen if EOS were to decline below the 200-SMA and the AO turns negative.
Recommendation
The recommendation will be to go long at market. Stop loss will be set around the 4.5 price level with a target of 6.50. This produces a risk reward ratio of 1.15.
Disclaimer
The views expressed are mine and do not represent the views of my employers and business partners. Persons acting on these recommendations are doing so at their own risk. These recommendations are not a solicitation to buy or to sell but are for purely discussion purposes. At the time publishing, I have a position in EOS.

EOS is going up EOS is bullish following the other cryptos, I feel right now is a good time to get in and hold $$$$
EOS pump to 6 bucks tomorrowWe simply breakout from this bullish flag pattern for the 3rd wave in the form of series of initials
Targets at 6 bucks then beyond
Invalidation under the dotted horizontal
Cheers
Keep buying kings
EOS/USD Break Out Coming SoonApparently my previous post on EOS was taken down. EOS is on the verge of breaking out of the wedge with initial target of $7 then $10. If you would like access to our Pro Oscillator please DM us. As always, please DYOR.
